. 2023 Dec 26;42(12):113487.
doi: 10.1016/j.celrep.2023.113487. Epub 2023 Nov 22.

Development of white matter fiber covariance networks supports executive function in youth

Affiliations

Development of white matter fiber covariance networks supports executive function in youth

Joëlle Bagautdinova et al. Cell Rep. .

Abstract

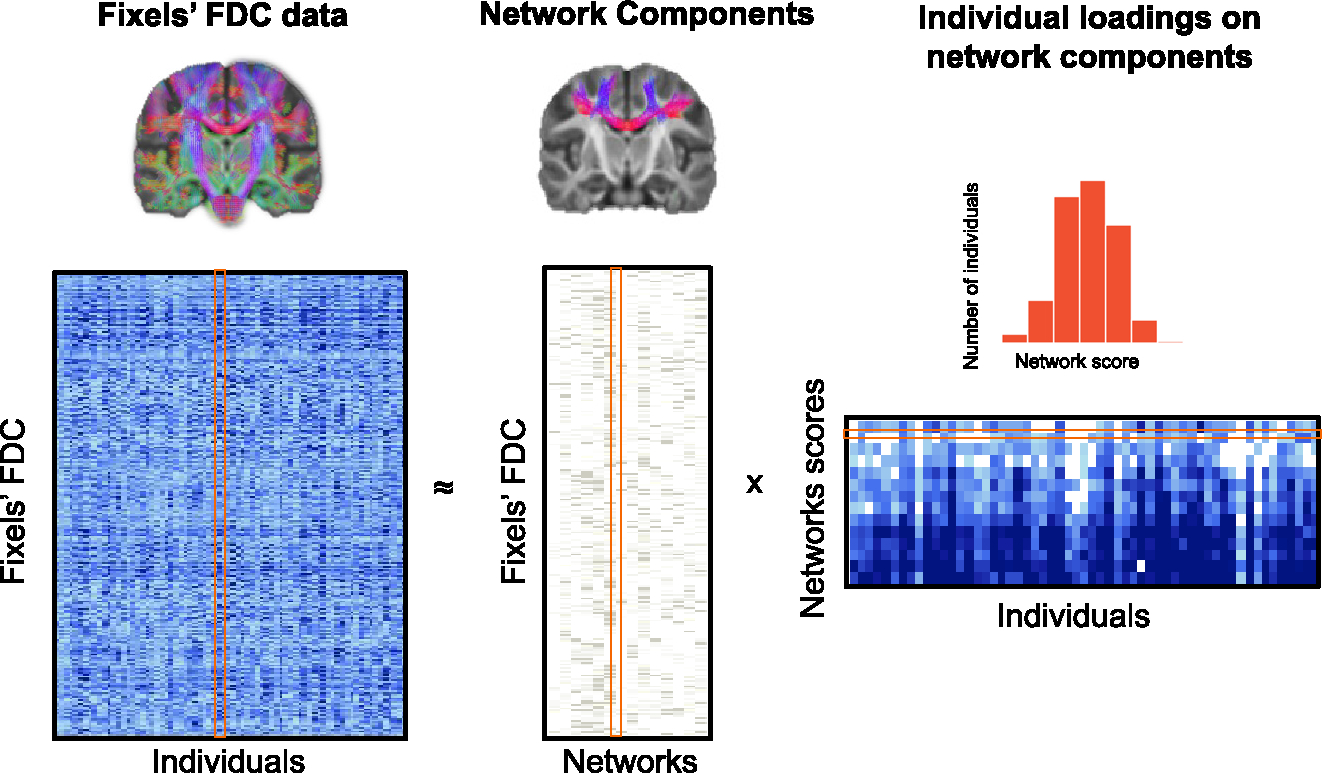
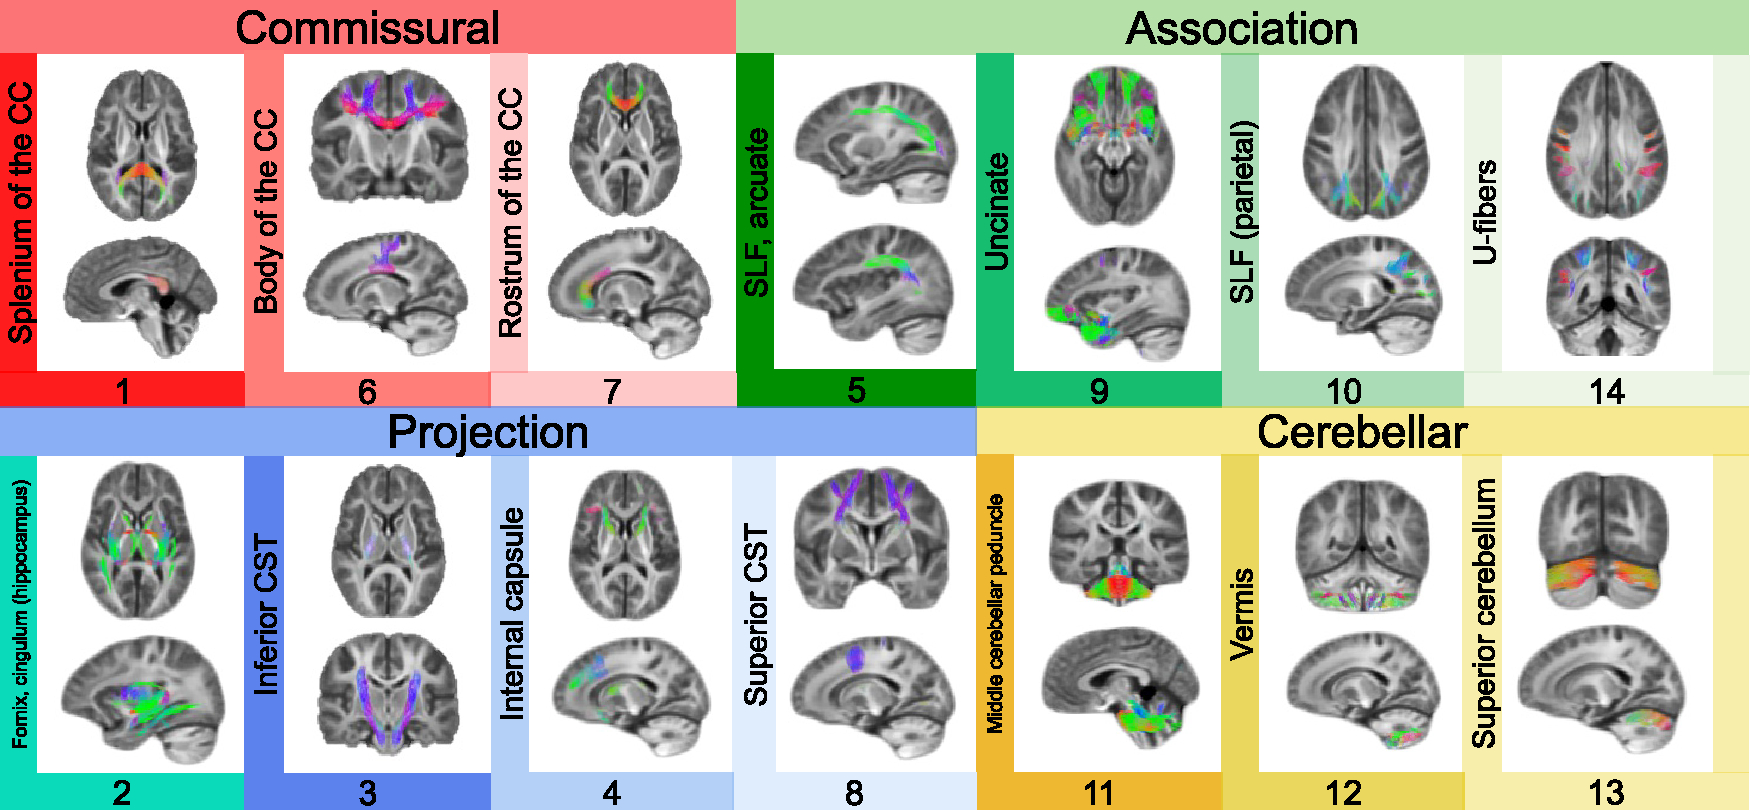
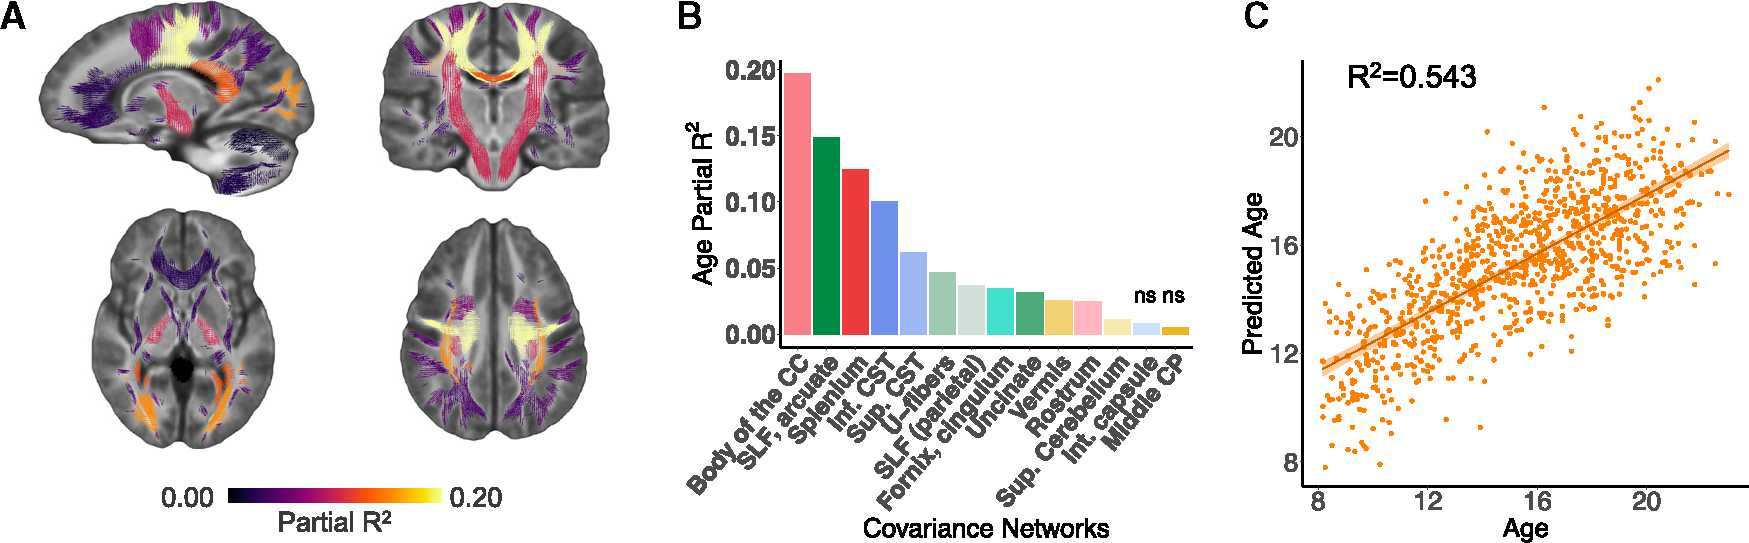
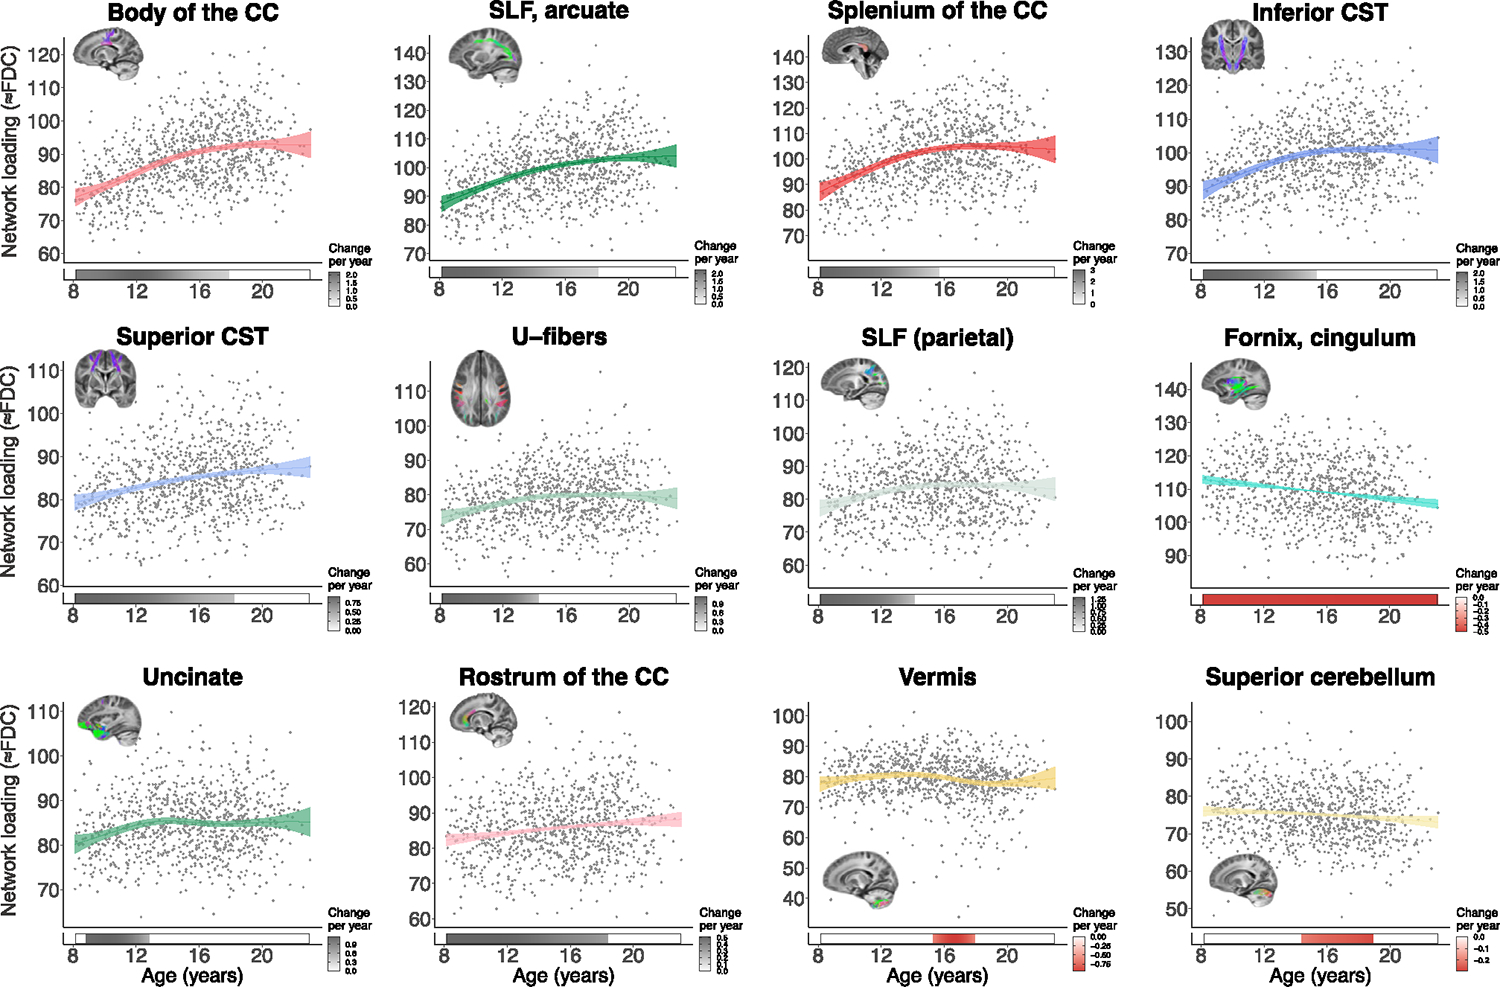
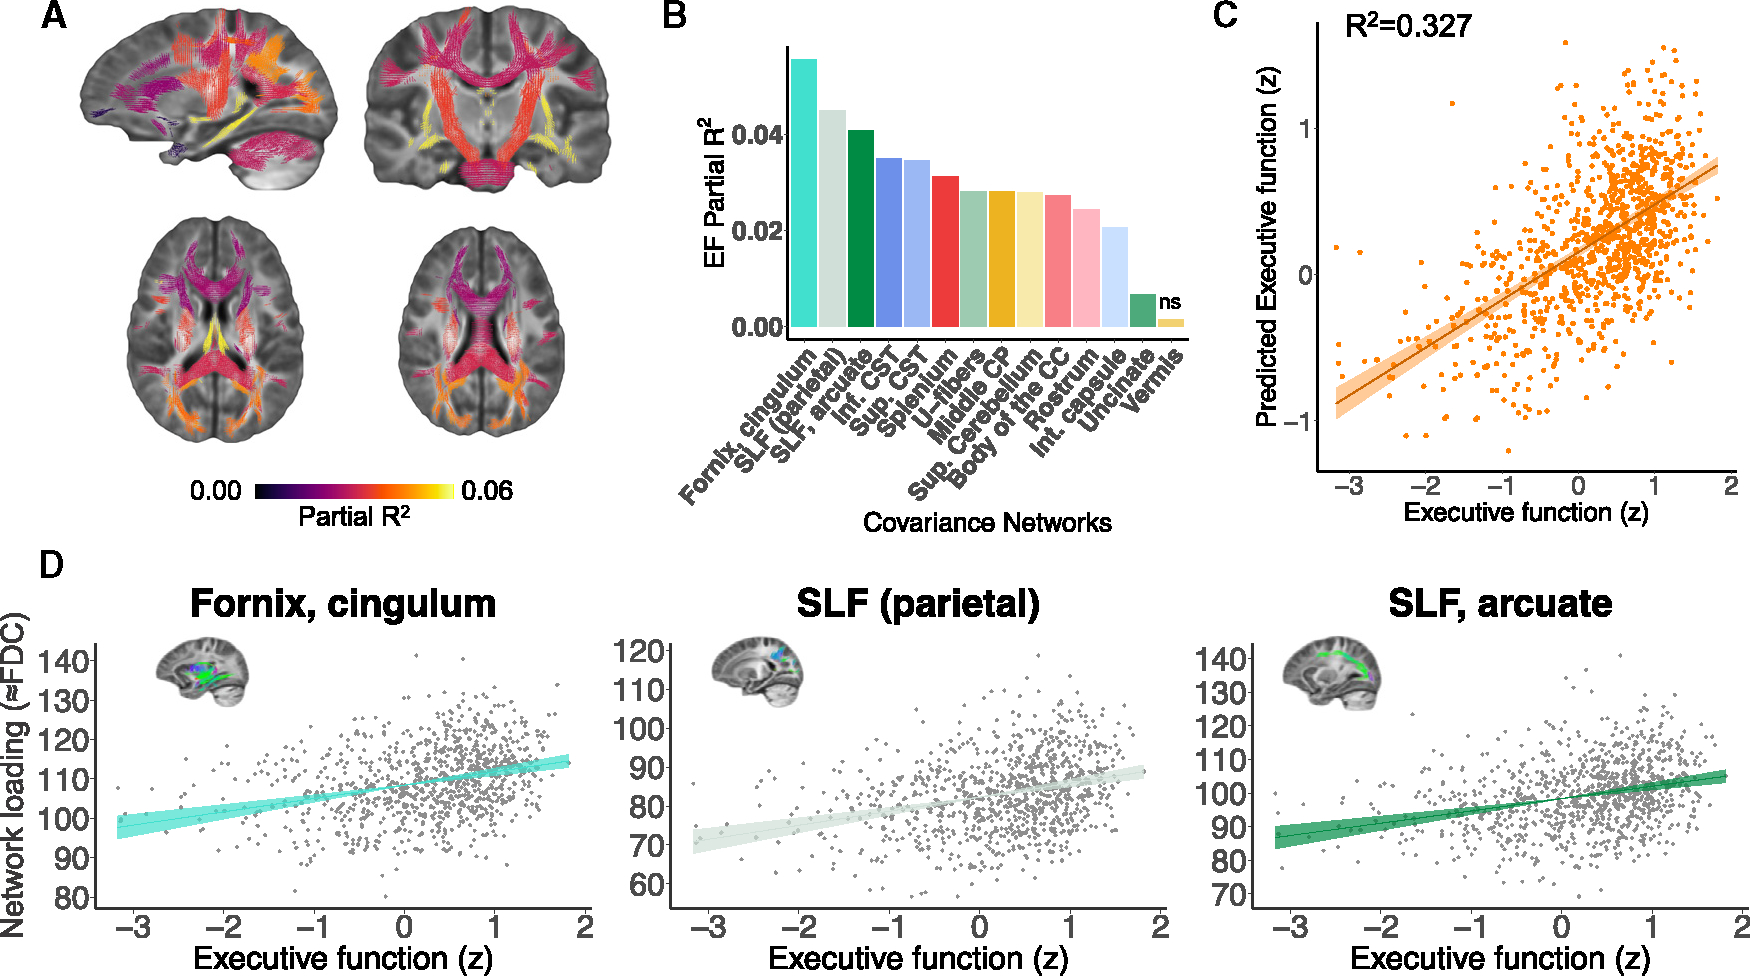
During adolescence, the brain undergoes extensive changes in white matter structure that support cognition. Data-driven approaches applied to cortical surface properties have led the field to understand brain development as a spatially and temporally coordinated mechanism that follows hierarchically organized gradients of change. Although white matter development also appears asynchronous, previous studies have relied largely on anatomical tract-based atlases, precluding a direct assessment of how white matter structure is spatially and temporally coordinated. Harnessing advances in diffusion modeling and machine learning, we identified 14 data-driven patterns of covarying white matter structure in a large sample of youth. Fiber covariance networks aligned with known major tracts, while also capturing distinct patterns of spatial covariance across distributed white matter locations. Most networks showed age-related increases in fiber network properties, which were also related to developmental changes in executive function. This study delineates data-driven patterns of white matter development that support cognition.

Keywords: CP: Neuroscience; development; diffusion-weighted imaging; executive function; fixel-based analysis; network; non-negative matrix factorization; youth.


Conflict of interest statement

Declaration of interests The authors declare no competing interests.

Figures

Figure 1.
Figure 1.. Identifying fiber covariance networks using NMF
In this schematic, the original whole-brain FDC data for each fixel (rows) and for all individuals (columns) are fed into opNMF, which then decomposes the data into a matrix of network components and a matrix of individual loadings in each network. The network components matrix contains the loadings of each fixel in each of the 14 networks. Above the network components matrix is one example of fixel loadings onto an opNMF network. The individual loadings matrix contains the participant-specific scores for each network. The histogram above shows a sample row of the matrix with scores for all of the participants in one network. More important, both output matrices are ≥0 (e.g., elements of the factorization are nonnegative). The individual network loadings were used as the dependent variable in group-level analyses.
Figure 2.
Figure 2.. Delineating fiber covariance networks with orthogonal projective NMF
opNMF yields a probabilistic parcellation such that each fixel receives a loading score onto each of the 14 networks quantifying the extent to which the fixel belongs to each network. Here, the probabilistic parcellation was converted into discrete covariance network definitions for display by labeling each fixel according to its highest loading. The coloring of fixels is based on the red-green-blue (RGB) convention, which encodes the left-right, anterior-posterior, and inferior-superior directions, respectively. The networks identified include commissural bundles (1, 6, and 7), cerebellar white matter (11, 12, and 13), association bundles (5, 9, 10, 14, and 2), and projection bundles (2, 3, 4, and 8). Network 2 is included both in the association and projection networks because it encompasses the fornix and the cingulum (hippocampus). Network 10 refers to the parietal portion of the superior longitudinal fasciculus (SLF). CC, corpus callosum; CST, corticospinal tract.
Figure 3.
Figure 3.. Developmental refinement of fiber covariance networks
(A) Mass-univariate analyses using GAMs revealed that age was associated with significant changes in FDC in 12 of 14 networks. The coloring of the fixels of the covariance networks is based on the variance explained (partial R2). Multiple comparisons were accounted for using the FDR (q < 0.05). (B) Bar graph depicting the effect size (partial R2) of the developmental effect for each network. The greatest effect sizes were seen in networks such as the body of the corpus callosum (CC), the superior longitudinal (SLF) and arcuate fasciculi, and the splenium of the CC (networks 6 and 5 and 1). Nonsignificant associations are marked by “ns.” (C) We tested whether the multivariate signature of fiber covariance networks could predict age above and beyond sex and data quality by comparing a full model to a null model excluding the 14 covariance networks. We found a significant difference between a reduced covariate-only model (i.e., sex, motion, and image quality) and a full model that included both the fiber covariance networks and covariates (F = 76.3, df = 14, p < 0.001). The proportion of variance in age explained by the 14 covariance networks was R2 = 0.543, resulting in a good correspondence between age and predicted age. CST, corticospinal tract; CP, cerebellar peduncle; Int, internal; Sup, superior.
Figure 4.
Figure 4.. Development is associated with increased FDC in most fiber covariance networks
Plots display relationships quantified by GAMs between FDC and age for each covariance network. Significant age-related changes were characterized by increasing FDC in most networks, with the exception of the fornix/cingulum (network 2), vermis (network 12), and superior cerebellum (network 13). Bars below the x axis depict the derivative of the fitted GAM smooth function and correspond to developmental windows of significant white matter maturation. The filled portion of the bar indicates periods in which the magnitude of the derivative is significant. A gray bar color indicates significant FDC increases (i.e., a positive derivative), and a red bar color indicates significant FDC decreases (negative derivative). CC, corpus callosum; CST, corticospinal tract; SLF, superior longitudinal fasciculus.
Figure 5.
Figure 5.. Fiber covariance network features are associated with executive function in youth
(A) Univariate analyses using GAMs that controlled for sex, motion, and image quality revealed that executive function was associated with higher FDC in 13 of 14 networks. The coloring of the fixels of the covariance networks is based on the partial R2 scores of executive function. Multiple comparisons were accounted for using the FDR (q < 0.05). (B) Bar graph depicting the effect size of executive function for each network (partial R2). These partial R2 magnitudes were highest in association networks such as the fornix/cingulum (hippocampus), the parietal part of the superior longitudinal fasciculus (SLF), and the superior longitudinal and arcuate fasciculi (networks 2, 5, and 10). (C) We tested whether the multivariate signature of the fiber covariance networks could predict executive function above and beyond sex and data quality by comparing a full model to a null model excluding the 14 covariance networks. We found a significant difference between a reduced covariate-only model (i.e., sex, motion, and image quality) and a full model that included both the fiber covariance networks and covariates (F = 6.56, df = 14, p < 0.001). The proportion of variance in executive function explained by the 14 covariance networks was R2 = 0.327, resulting in a good correspondence executive function and predicted executive function. (D) The association between executive function and FDC is shown for the covariance networks with the highest partial R2 scores. EF, executive function; CC, corpus callosum; CST, corticospinal tract; CP, cerebellar peduncle; Int, internal; Sup, superior.

Update of

Comment in

Similar articles

Cited by

References

    1. Lebel C, and Beaulieu C (2011). Longitudinal development of human brain wiring continues from childhood into adulthood. J. Neurosci. 31, 10937–10947. - PMC - PubMed
    1. Westlye LT, Walhovd KB, Dale AM, Bjørnerud A, Due-Tønnessen P, Engvig A, Grydeland H, Tamnes CK, Østby Y, and Fjell AM (2010). Life-span changes of the human brain white matter: Diffusion tensor imaging (DTI) and volumetry. Cereb. Cortex 20, 2055–2068. - PubMed
    1. Paus T (2010). Growth of white matter in the adolescent brain: Myelin or axon? Brain Cogn. 72, 26–35. - PubMed
    1. Raffelt DA, Tournier JD, Smith RE, Vaughan DN, Jackson G, Ridgway GR, and Connelly A (2017). Investigating white matter fibre density and morphology using fixel-based analysis. Neuroimage 144, 58–73. - PMC - PubMed
    1. Gur RC, Richard J, Calkins ME, Chiavacci R, Hansen JA, Bilker WB, Loughead J, Connolly JJ, Qiu H, Mentch FD, et al. (2012). Age group and sex differences in performance on a computerized neuro-cognitive battery in children age 8–21. Neuropsychology 26, 251–265. - PMC - PubMed

LinkOut - more resources