

Interpretable prediction models for widespread m6A RNA modification across cell lines and tissues
- PMID: 37995291
- PMCID: PMC10697738
- DOI: 10.1093/bioinformatics/btad709
Interpretable prediction models for widespread m6A RNA modification across cell lines and tissues
Abstract
Motivation: RNA N6-methyladenosine (m6A) in Homo sapiens plays vital roles in a variety of biological functions. Precise identification of m6A modifications is thus essential to elucidation of their biological functions and underlying molecular-level mechanisms. Currently available high-throughput single-nucleotide-resolution m6A modification data considerably accelerated the identification of RNA modification sites through the development of data-driven computational methods. Nevertheless, existing methods have limitations in terms of the coverage of single-nucleotide-resolution cell lines and have poor capability in model interpretations, thereby having limited applicability.
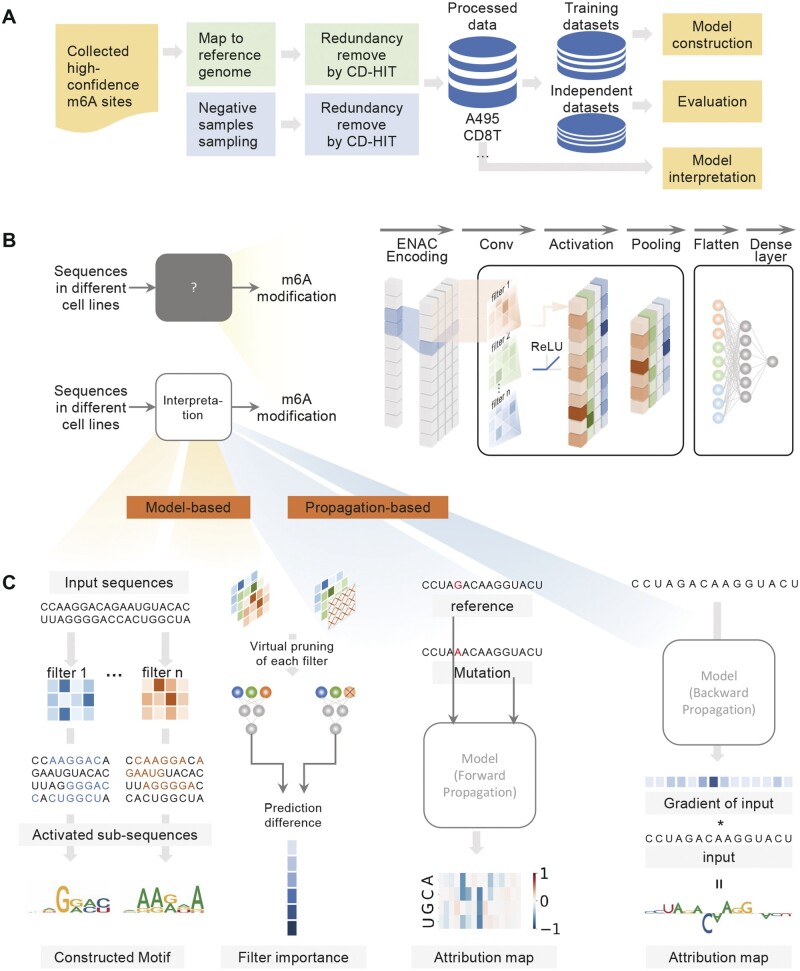
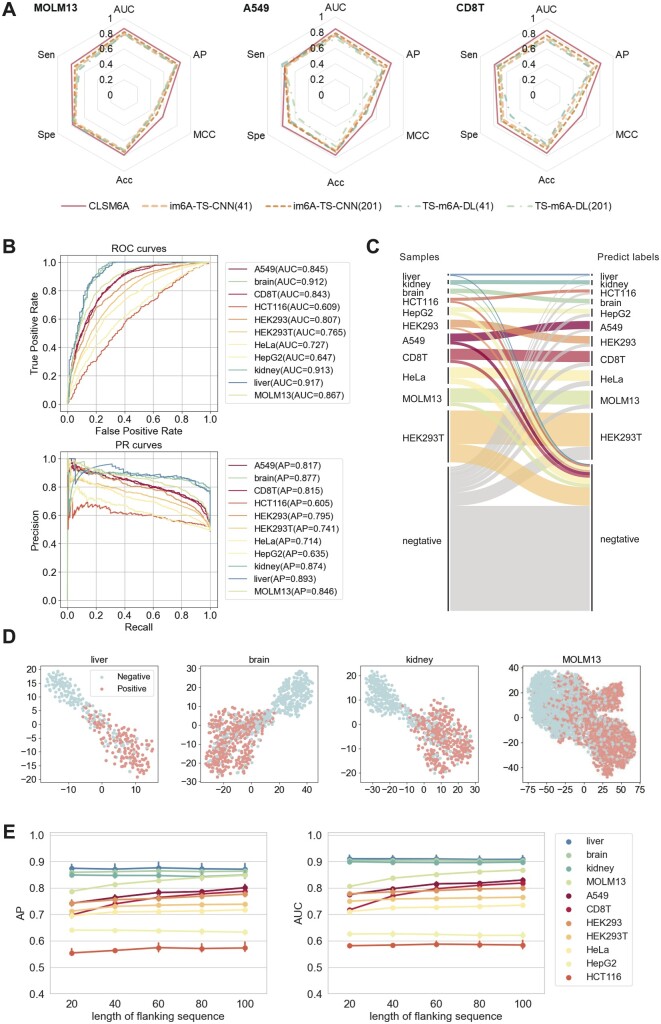
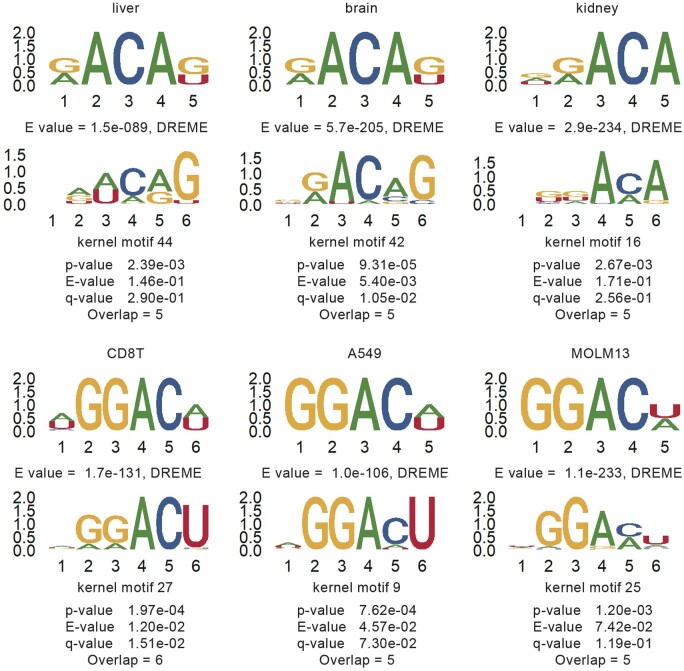
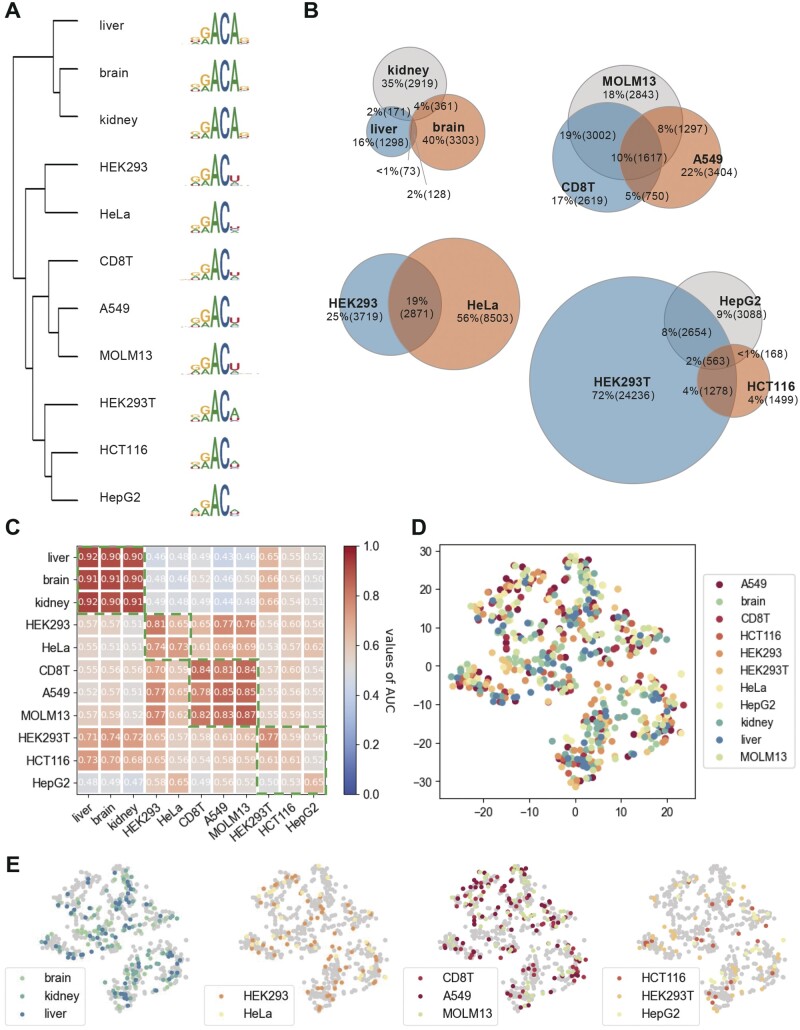
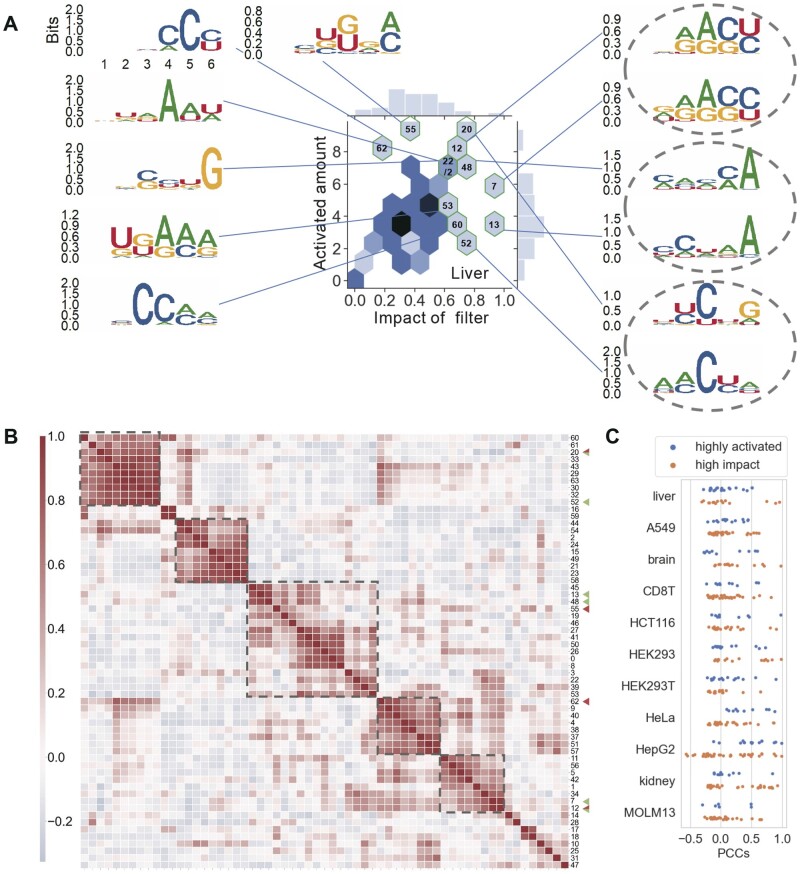
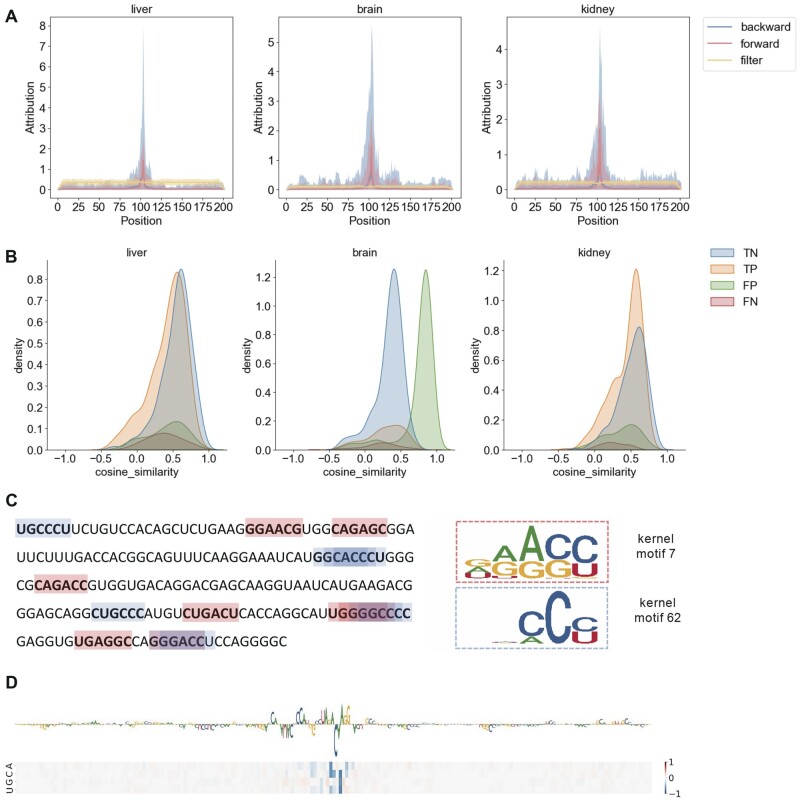
Results: In this study, we present CLSM6A, comprising a set of deep learning-based models designed for predicting single-nucleotide-resolution m6A RNA modification sites across eight different cell lines and three tissues. Extensive benchmarking experiments are conducted on well-curated datasets and accordingly, CLSM6A achieves superior performance than current state-of-the-art methods. Furthermore, CLSM6A is capable of interpreting the prediction decision-making process by excavating critical motifs activated by filters and pinpointing highly concerned positions in both forward and backward propagations. CLSM6A exhibits better portability on similar cross-cell line/tissue datasets, reveals a strong association between highly activated motifs and high-impact motifs, and demonstrates complementary attributes of different interpretation strategies.
Availability and implementation: The webserver is available at http://csbio.njust.edu.cn/bioinf/clsm6a. The datasets and code are available at https://github.com/zhangying-njust/CLSM6A/.
© The Author(s) 2023. Published by Oxford University Press.
Conflict of interest statement
None declared.
Figures
Similar articles
-
MST-m6A: A Novel Multi-Scale Transformer-based Framework for Accurate Prediction of m6A Modification Sites Across Diverse Cellular Contexts.J Mol Biol. 2025 Mar 15;437(6):168856. doi: 10.1016/j.jmb.2024.168856. Epub 2024 Nov 6. J Mol Biol. 2025. PMID: 39510345
-
Comprehensive review and assessment of computational methods for predicting RNA post-transcriptional modification sites from RNA sequences.Brief Bioinform. 2020 Sep 25;21(5):1676-1696. doi: 10.1093/bib/bbz112. Brief Bioinform. 2020. PMID: 31714956 Review.
-
Discovering Consensus Regions for Interpretable Identification of RNA N6-Methyladenosine Modification Sites via Graph Contrastive Clustering.IEEE J Biomed Health Inform. 2024 Apr;28(4):2362-2372. doi: 10.1109/JBHI.2024.3357979. Epub 2024 Apr 4. IEEE J Biomed Health Inform. 2024. PMID: 38265898
-
Modeling multi-species RNA modification through multi-task curriculum learning.Nucleic Acids Res. 2021 Apr 19;49(7):3719-3734. doi: 10.1093/nar/gkab124. Nucleic Acids Res. 2021. PMID: 33744973 Free PMC article.
-
Predicting N6-Methyladenosine Sites in Multiple Tissues of Mammals through Ensemble Deep Learning.Int J Mol Sci. 2022 Dec 7;23(24):15490. doi: 10.3390/ijms232415490. Int J Mol Sci. 2022. PMID: 36555143 Free PMC article. Review.
Cited by
-
Interpretable deep cross networks unveiled common signatures of dysregulated epitranscriptomes across 12 cancer types.Mol Ther Nucleic Acids. 2024 Oct 29;35(4):102376. doi: 10.1016/j.omtn.2024.102376. eCollection 2024 Dec 10. Mol Ther Nucleic Acids. 2024. PMID: 39618823 Free PMC article.
-
Multimodal zero-shot learning of previously unseen epitranscriptomes from RNA-seq data.Brief Bioinform. 2025 Jul 2;26(4):bbaf332. doi: 10.1093/bib/bbaf332. Brief Bioinform. 2025. PMID: 40632498 Free PMC article.
-
Interpretability-guided RNA N6-methyladenosine modification site prediction with invertible neural networks.Commun Biol. 2025 Jul 8;8(1):1022. doi: 10.1038/s42003-025-08265-8. Commun Biol. 2025. PMID: 40629144 Free PMC article.
-
Statistical modeling of single-cell epitranscriptomics enabled trajectory and regulatory inference of RNA methylation.Cell Genom. 2025 Jan 8;5(1):100702. doi: 10.1016/j.xgen.2024.100702. Epub 2024 Dec 5. Cell Genom. 2025. PMID: 39642887 Free PMC article.
-
Methyl-GP: accurate generic DNA methylation prediction based on a language model and representation learning.Nucleic Acids Res. 2025 Mar 20;53(6):gkaf223. doi: 10.1093/nar/gkaf223. Nucleic Acids Res. 2025. PMID: 40156859 Free PMC article.
