Comment
. 2023 Nov 22;186(24):5375-5393.e25.
doi: 10.1016/j.cell.2023.10.019.

S. aureus drives itch and scratch-induced skin damage through a V8 protease-PAR1 axis

Affiliations
Comment

S. aureus drives itch and scratch-induced skin damage through a V8 protease-PAR1 axis

Liwen Deng et al. Cell. .

Abstract

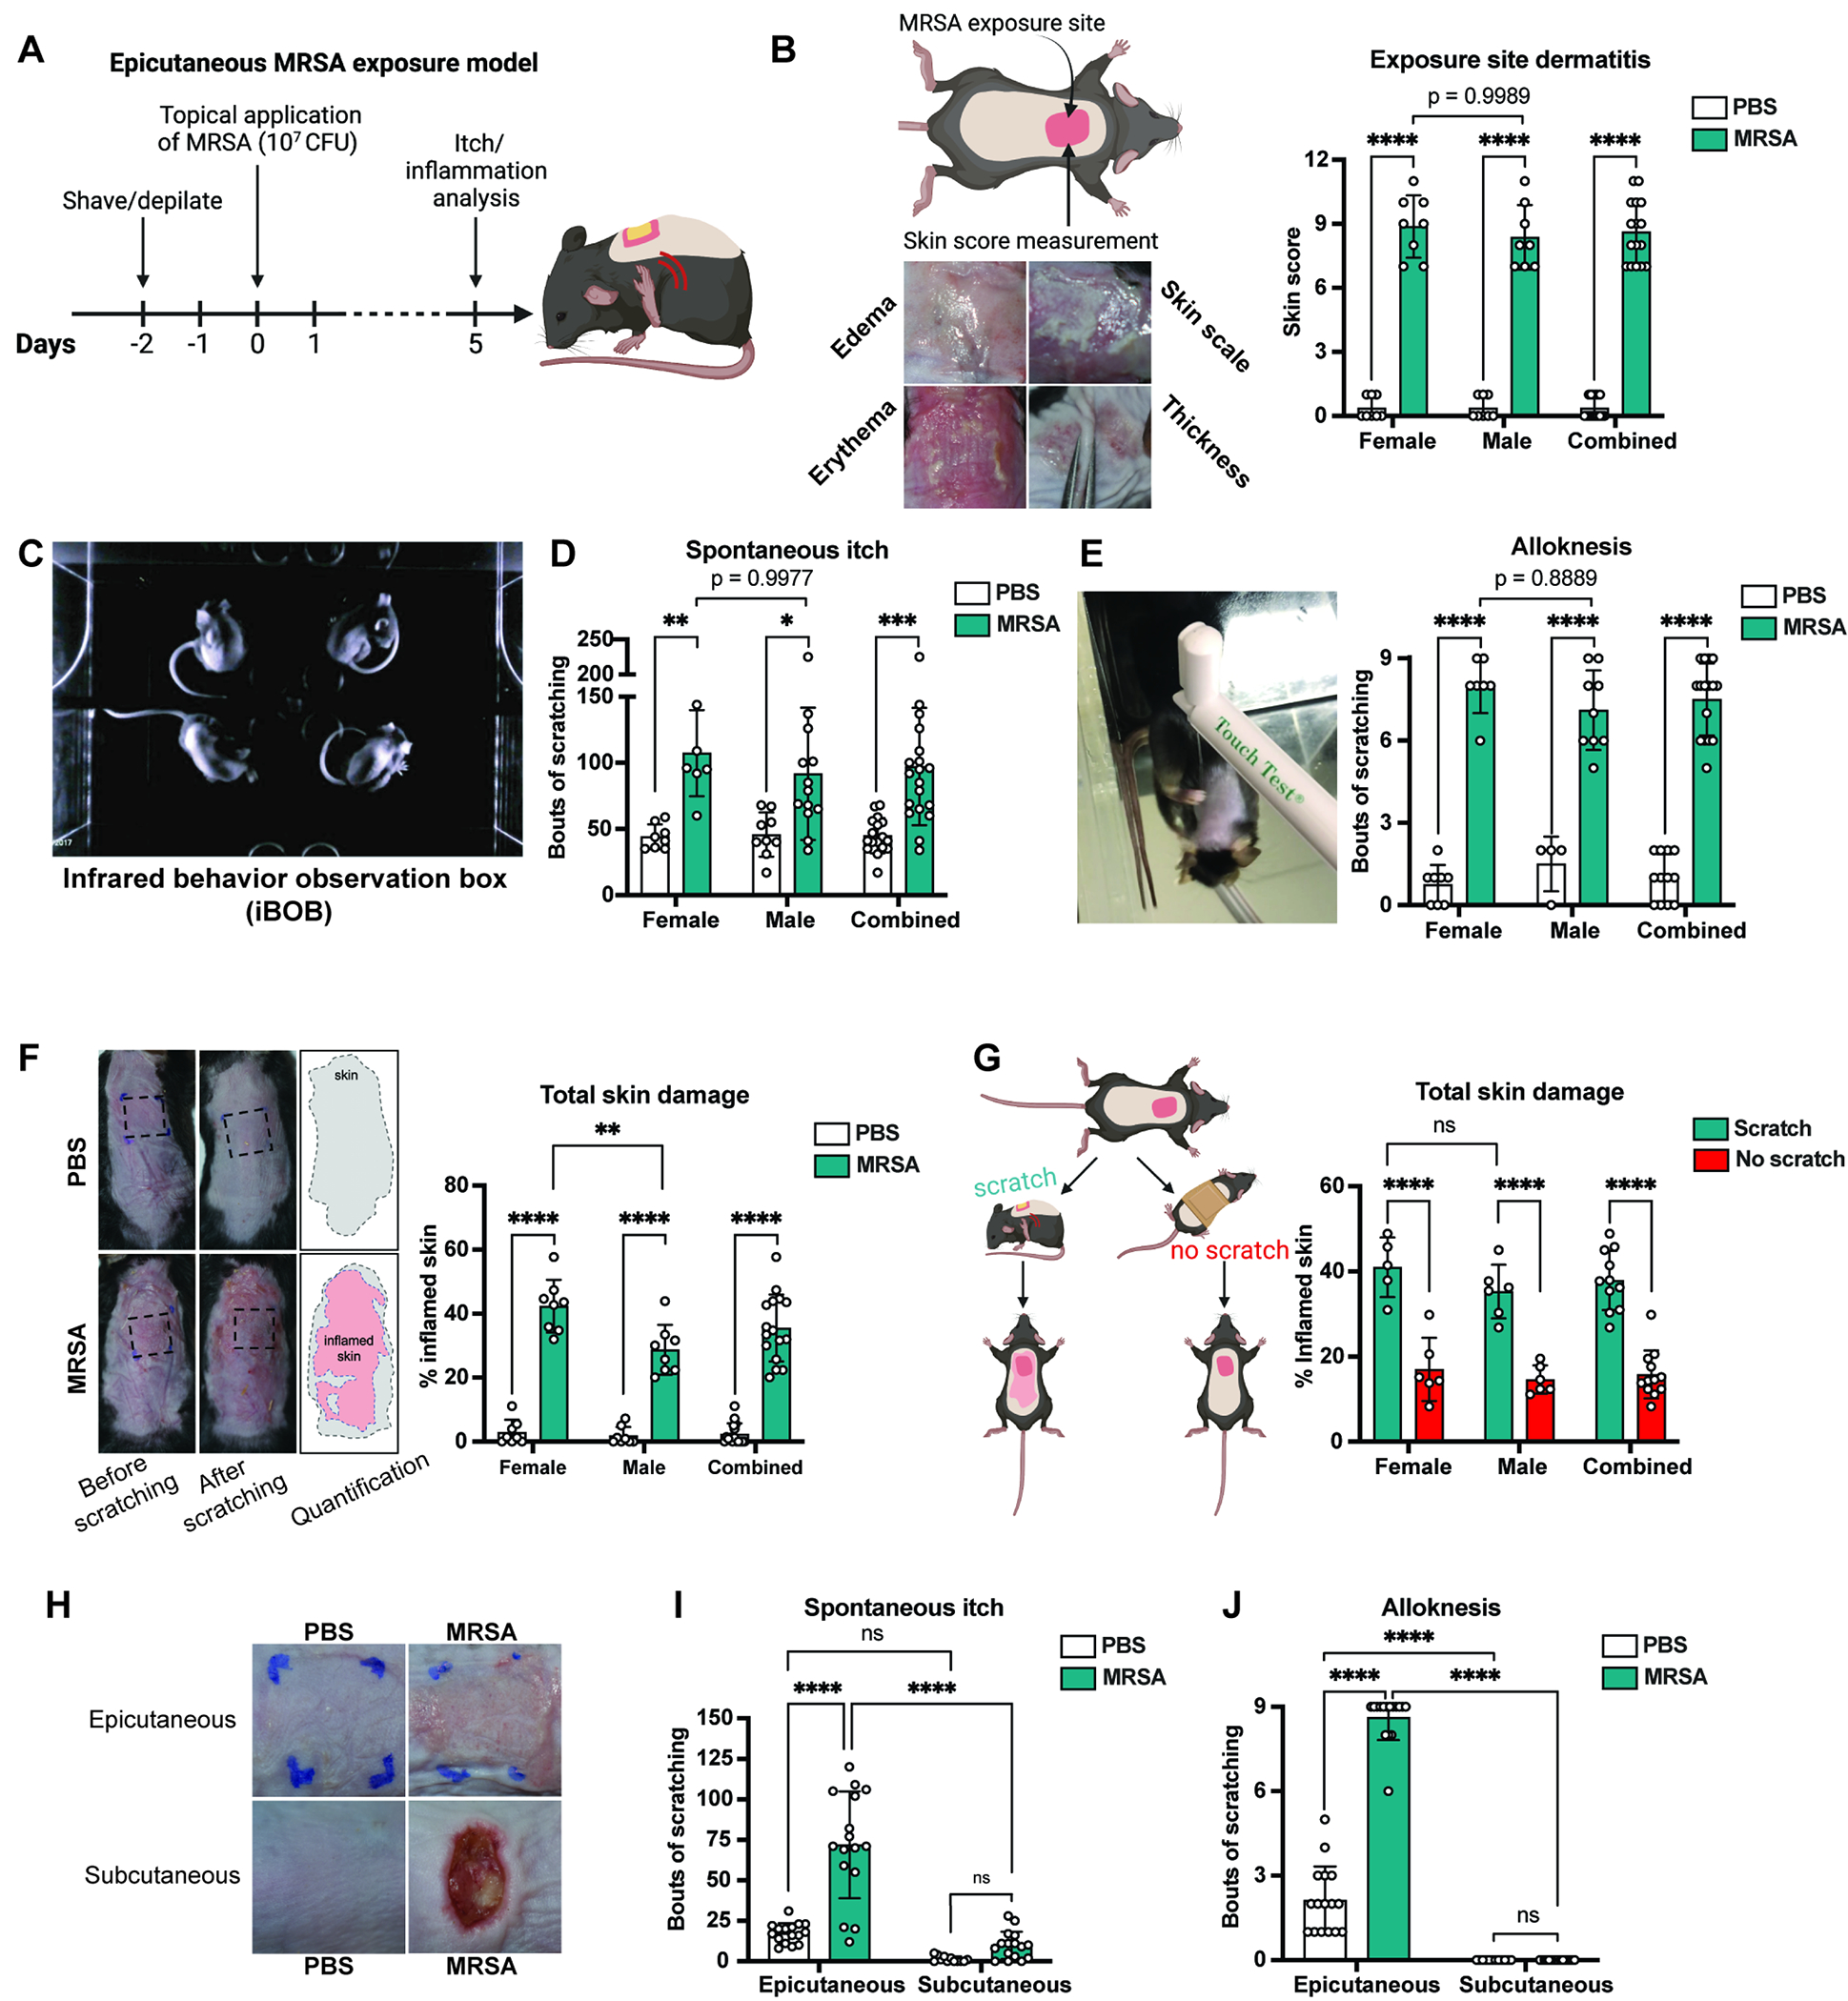
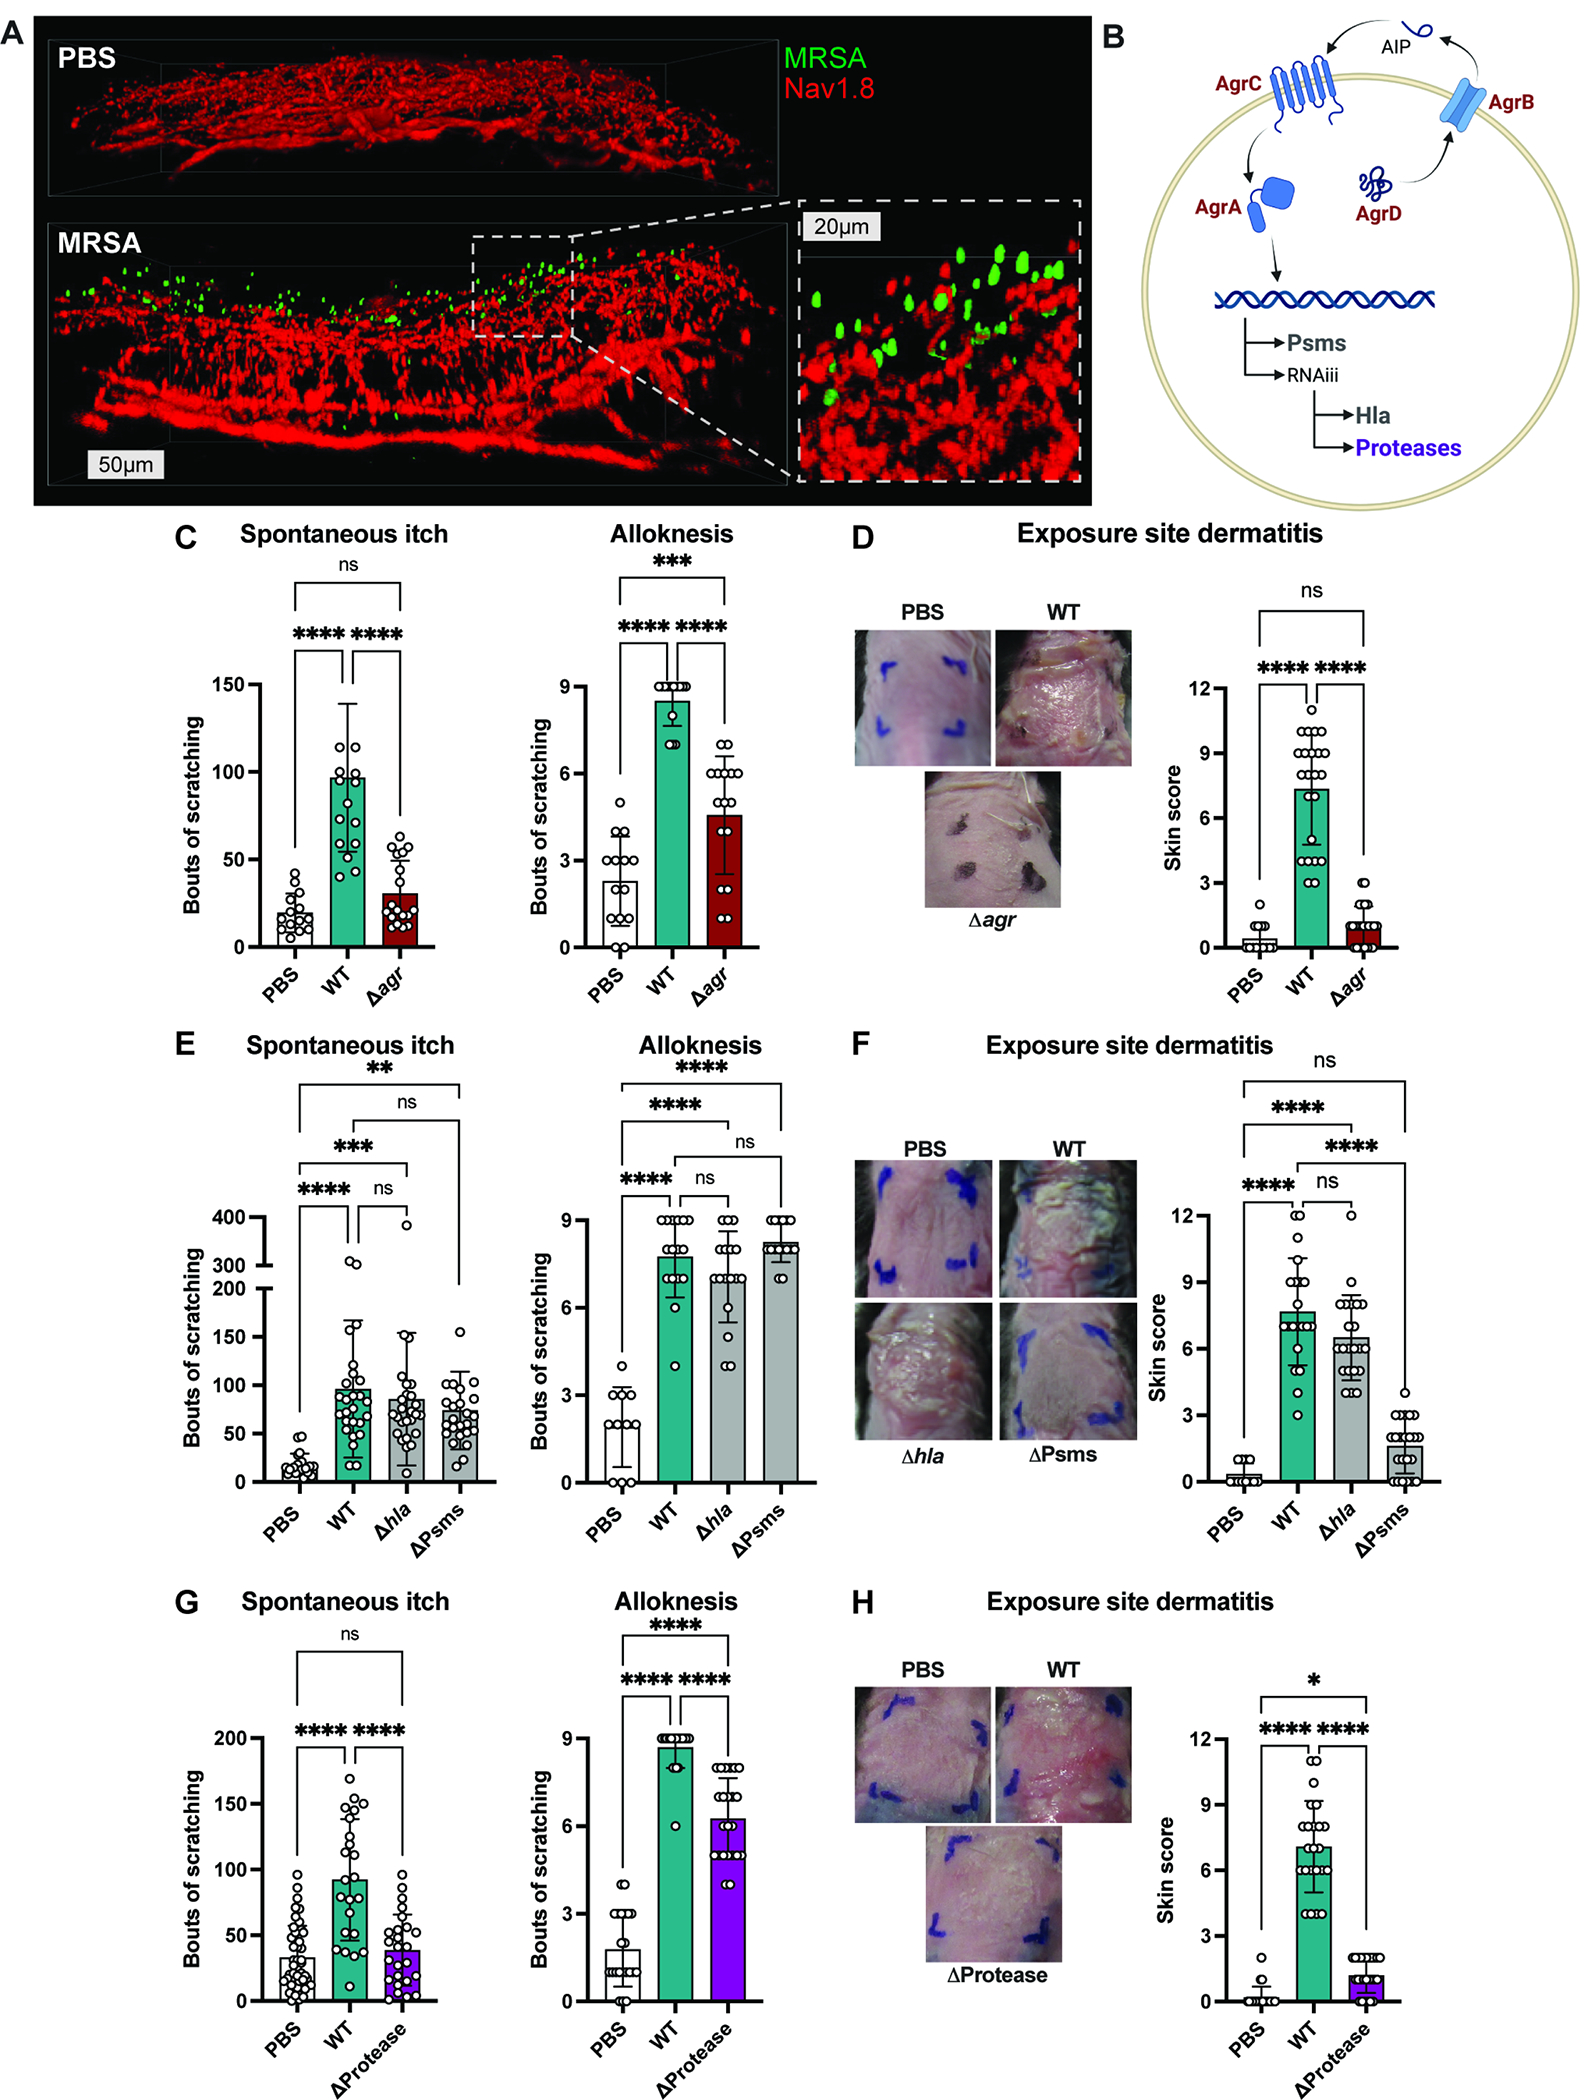
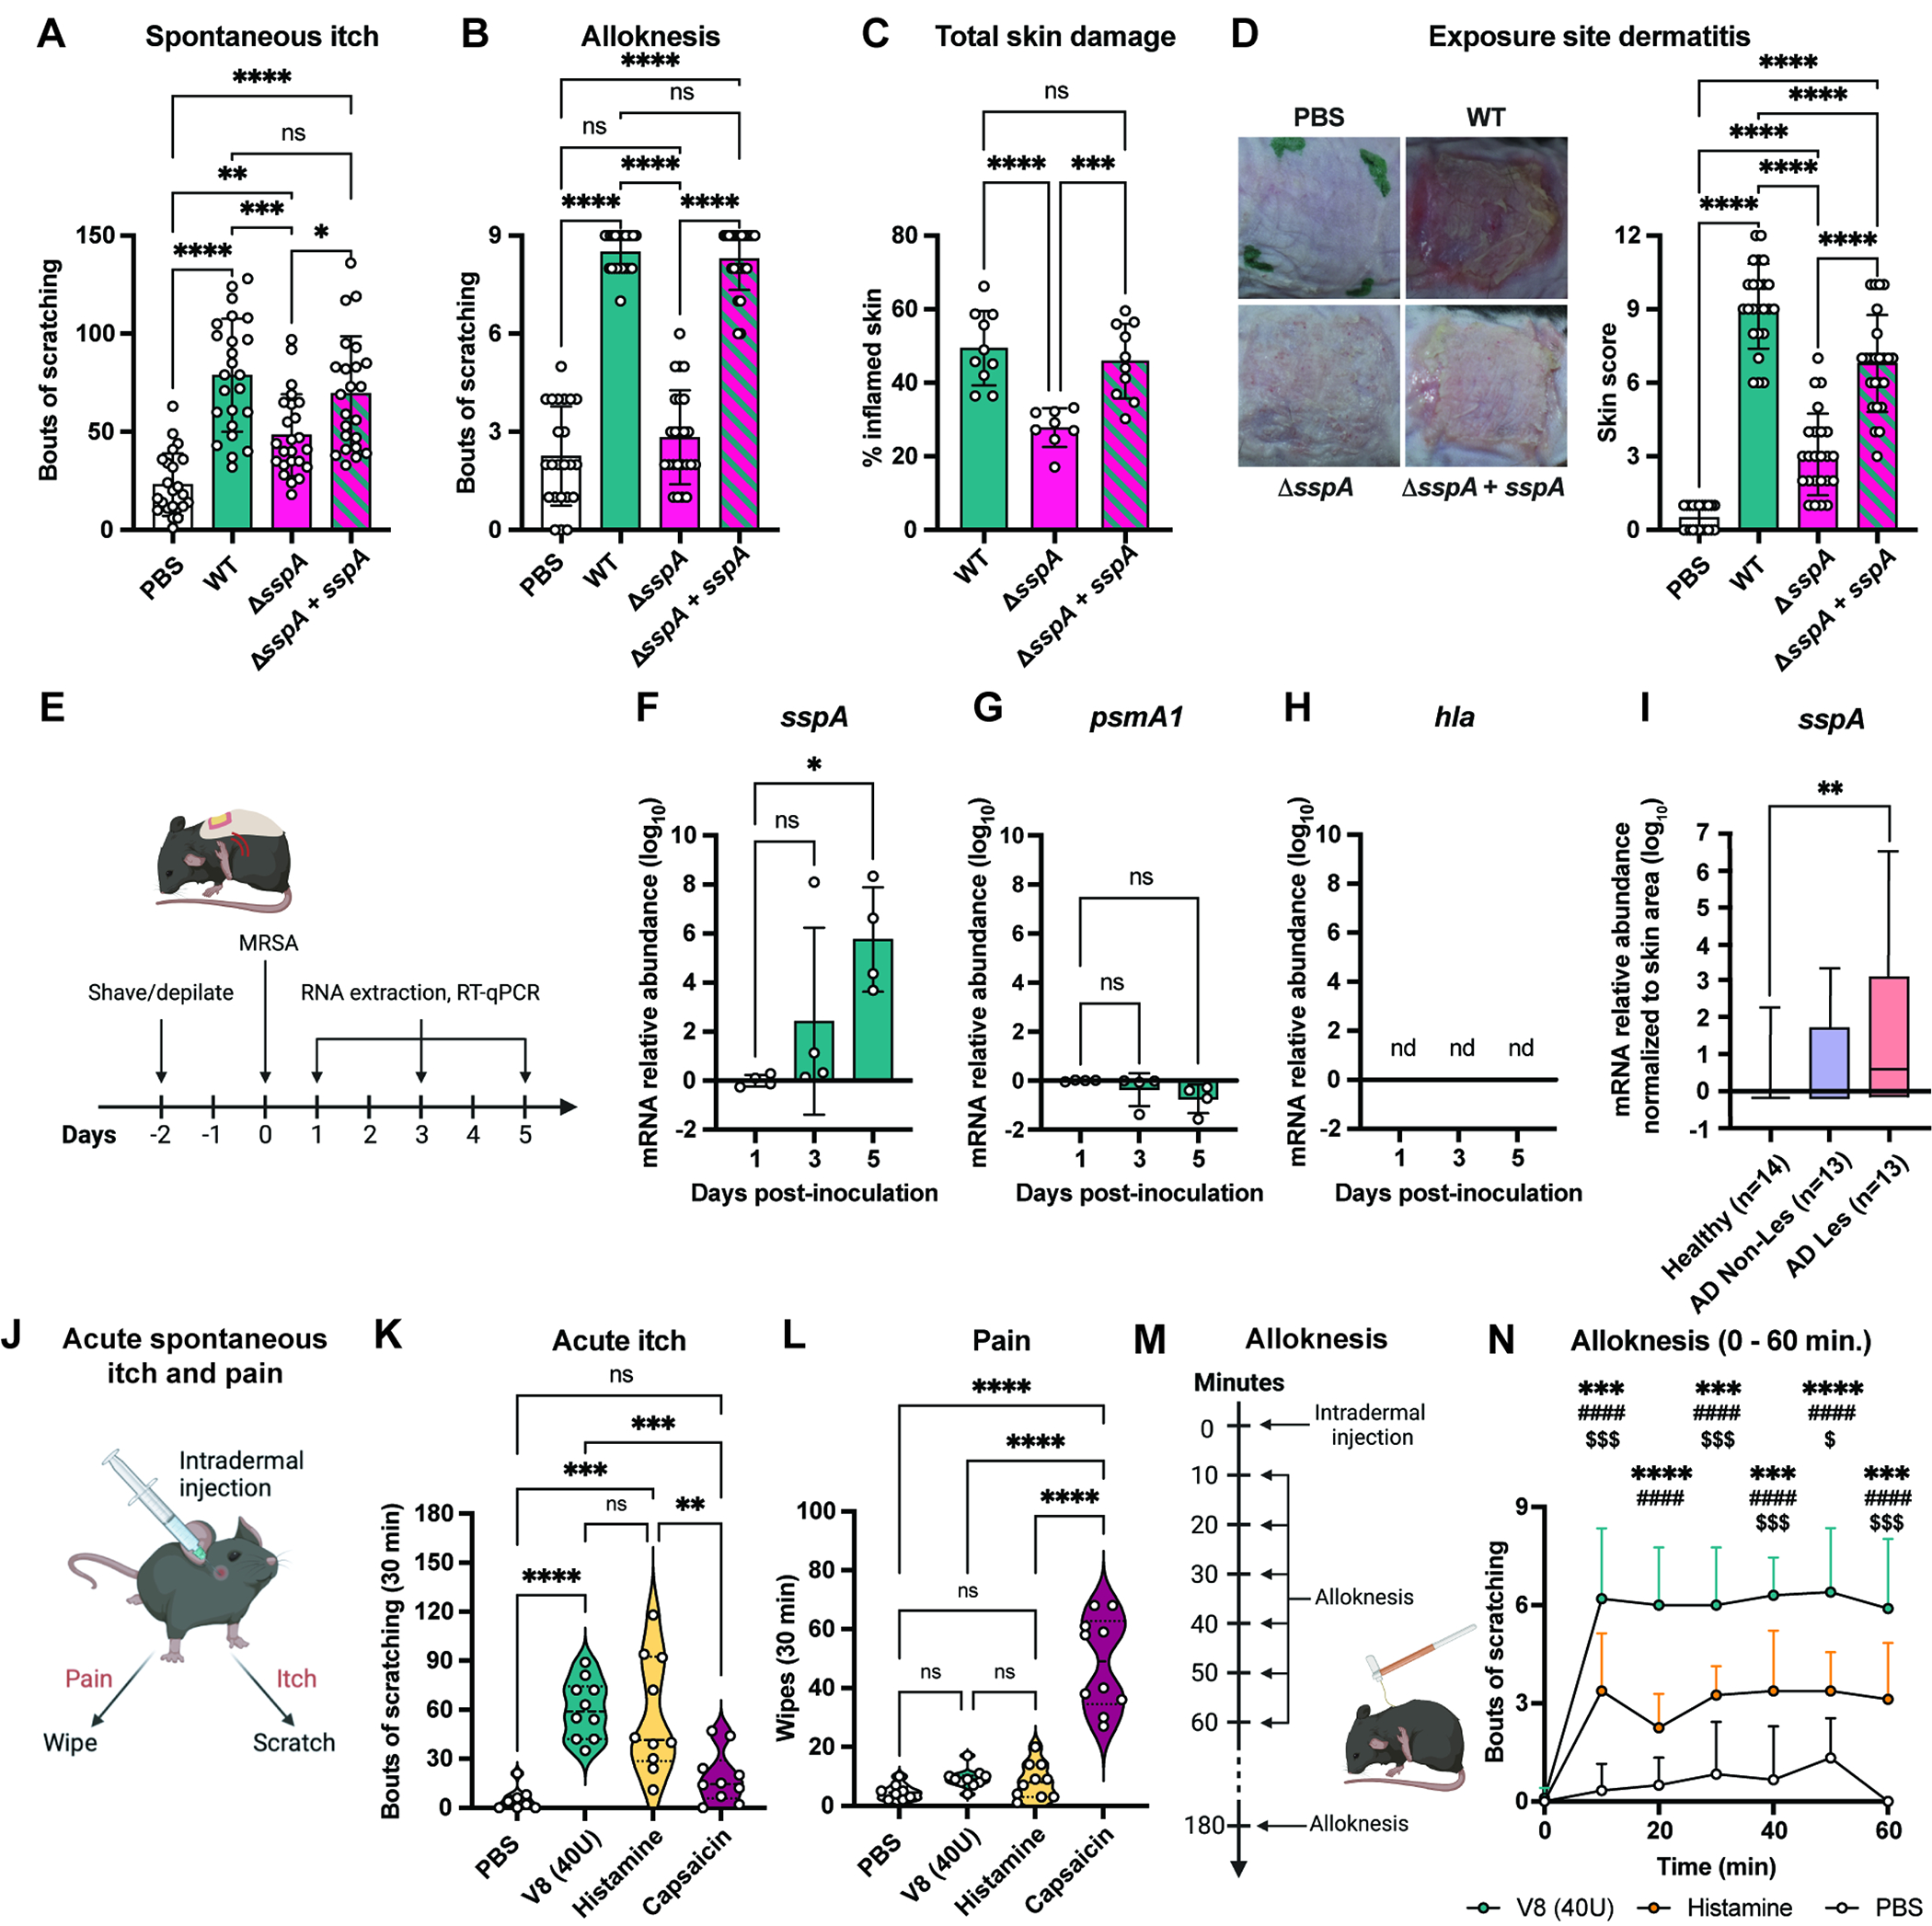
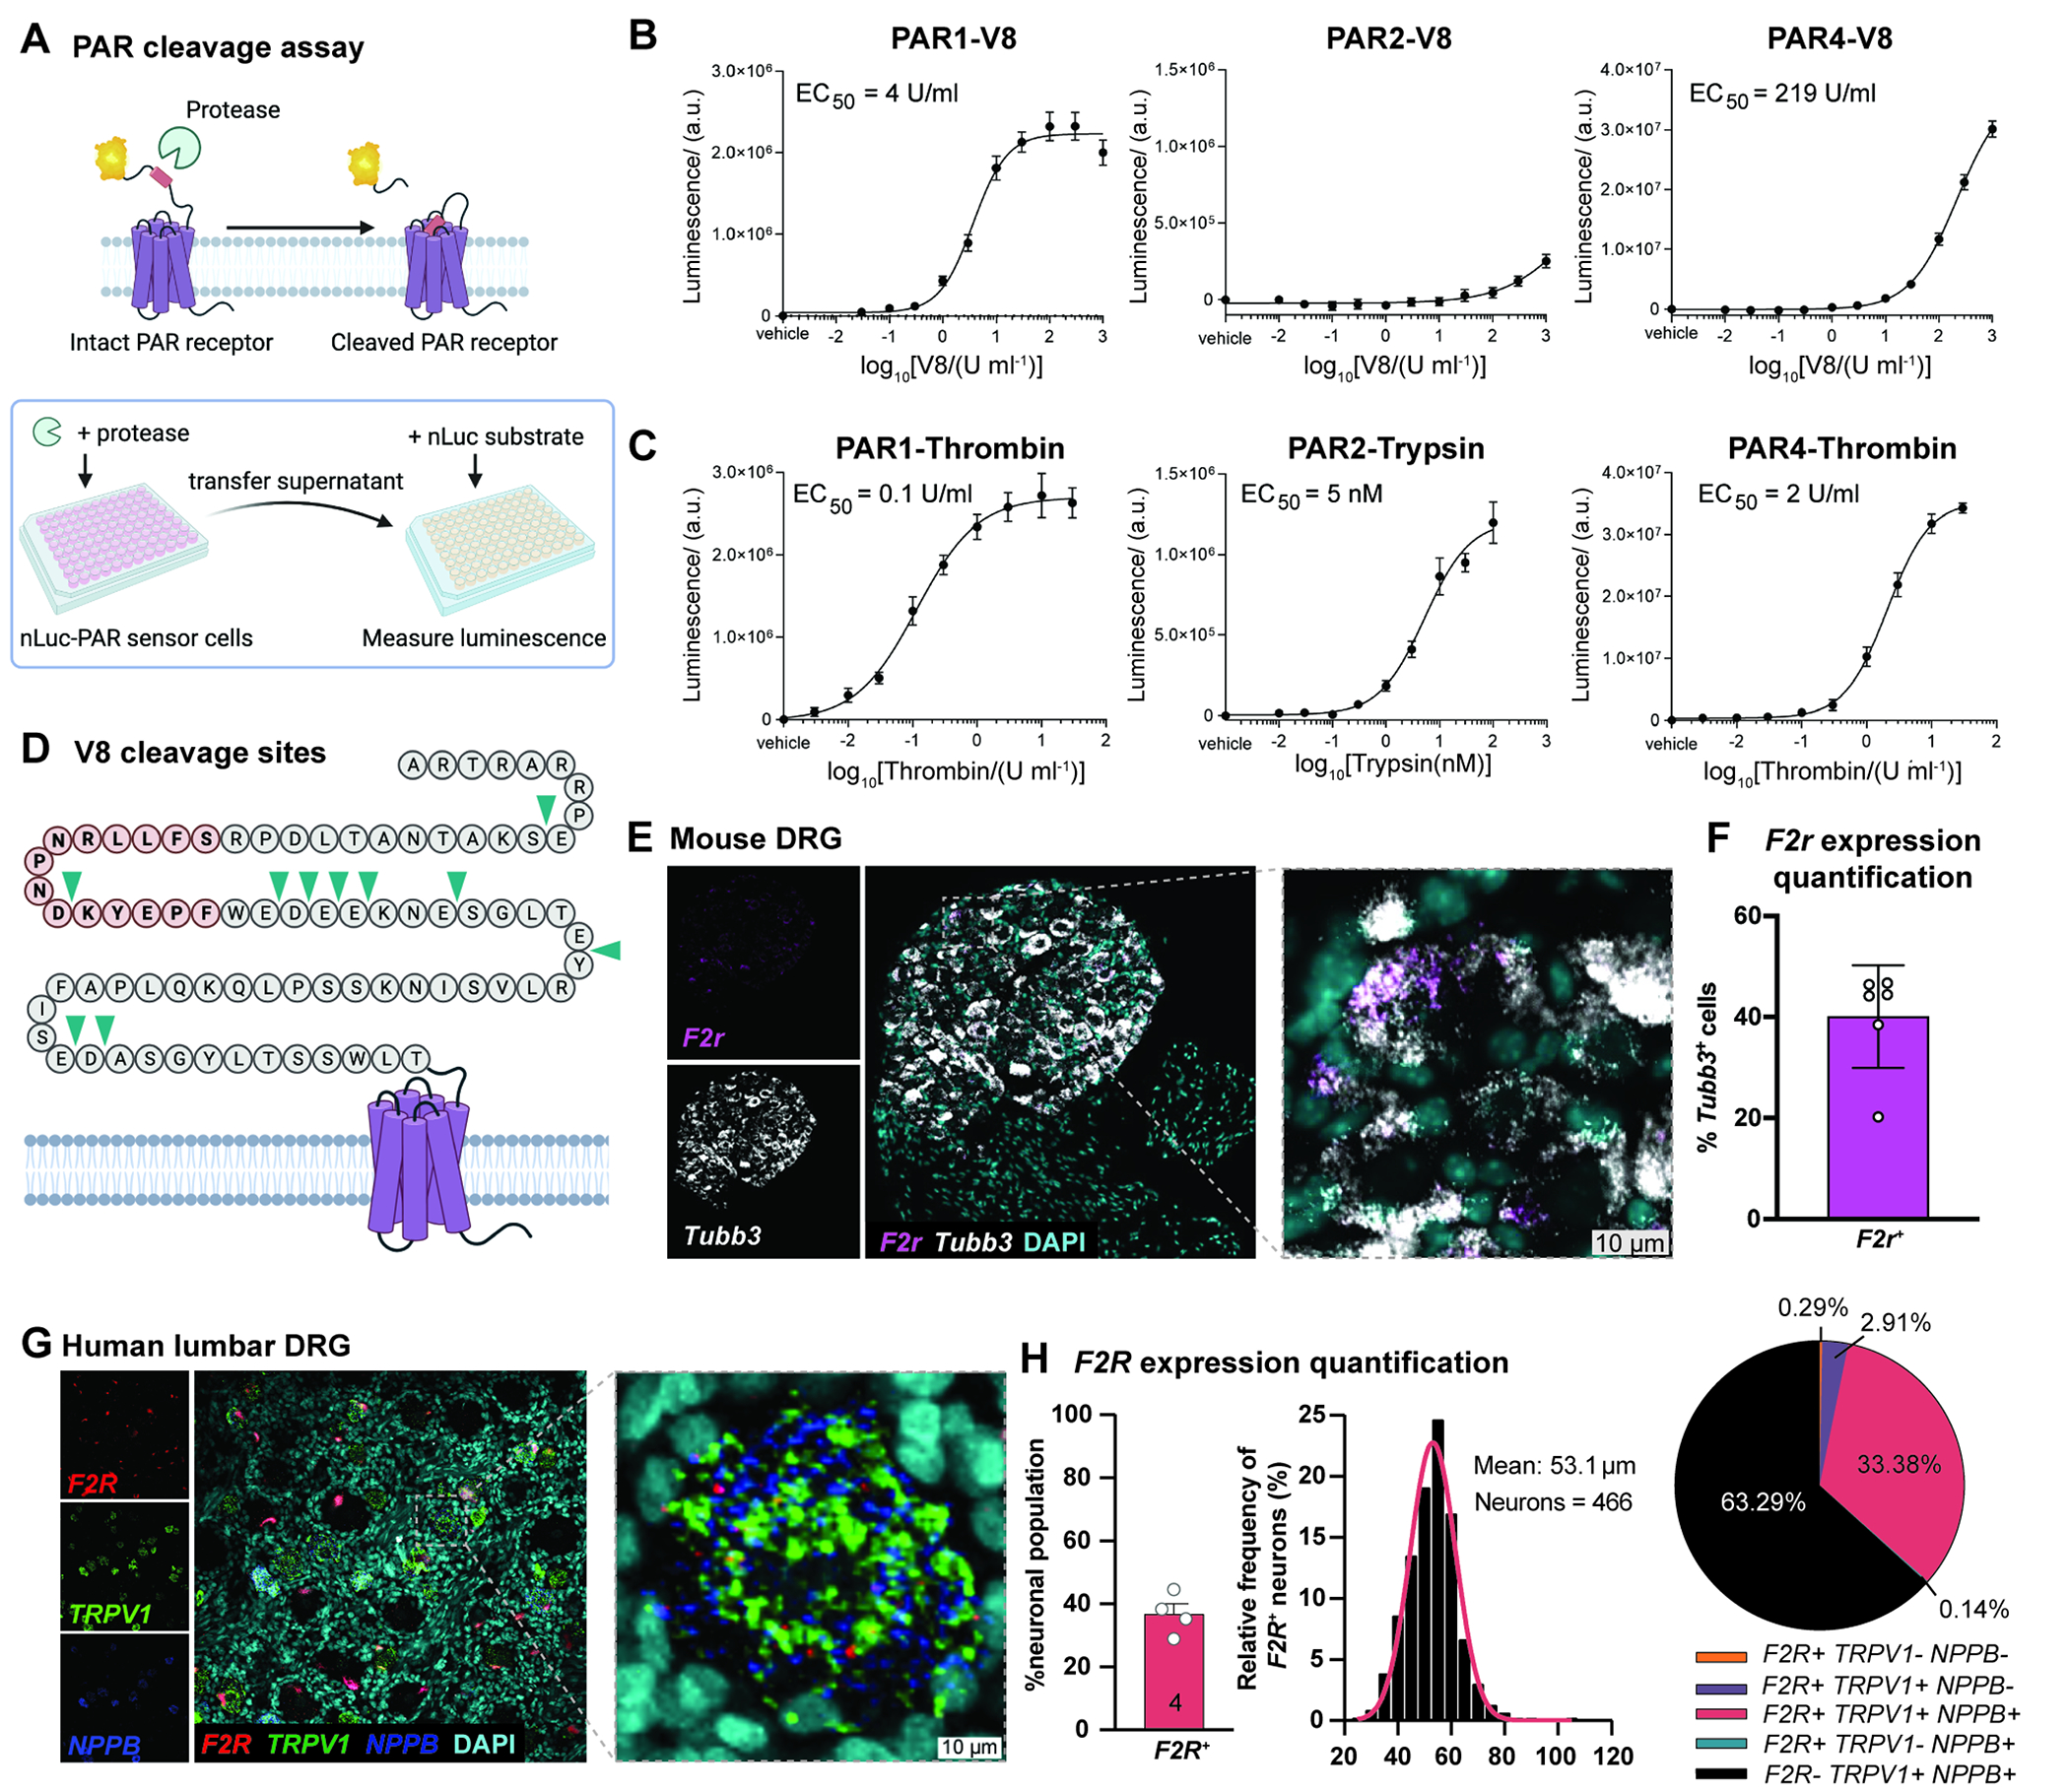
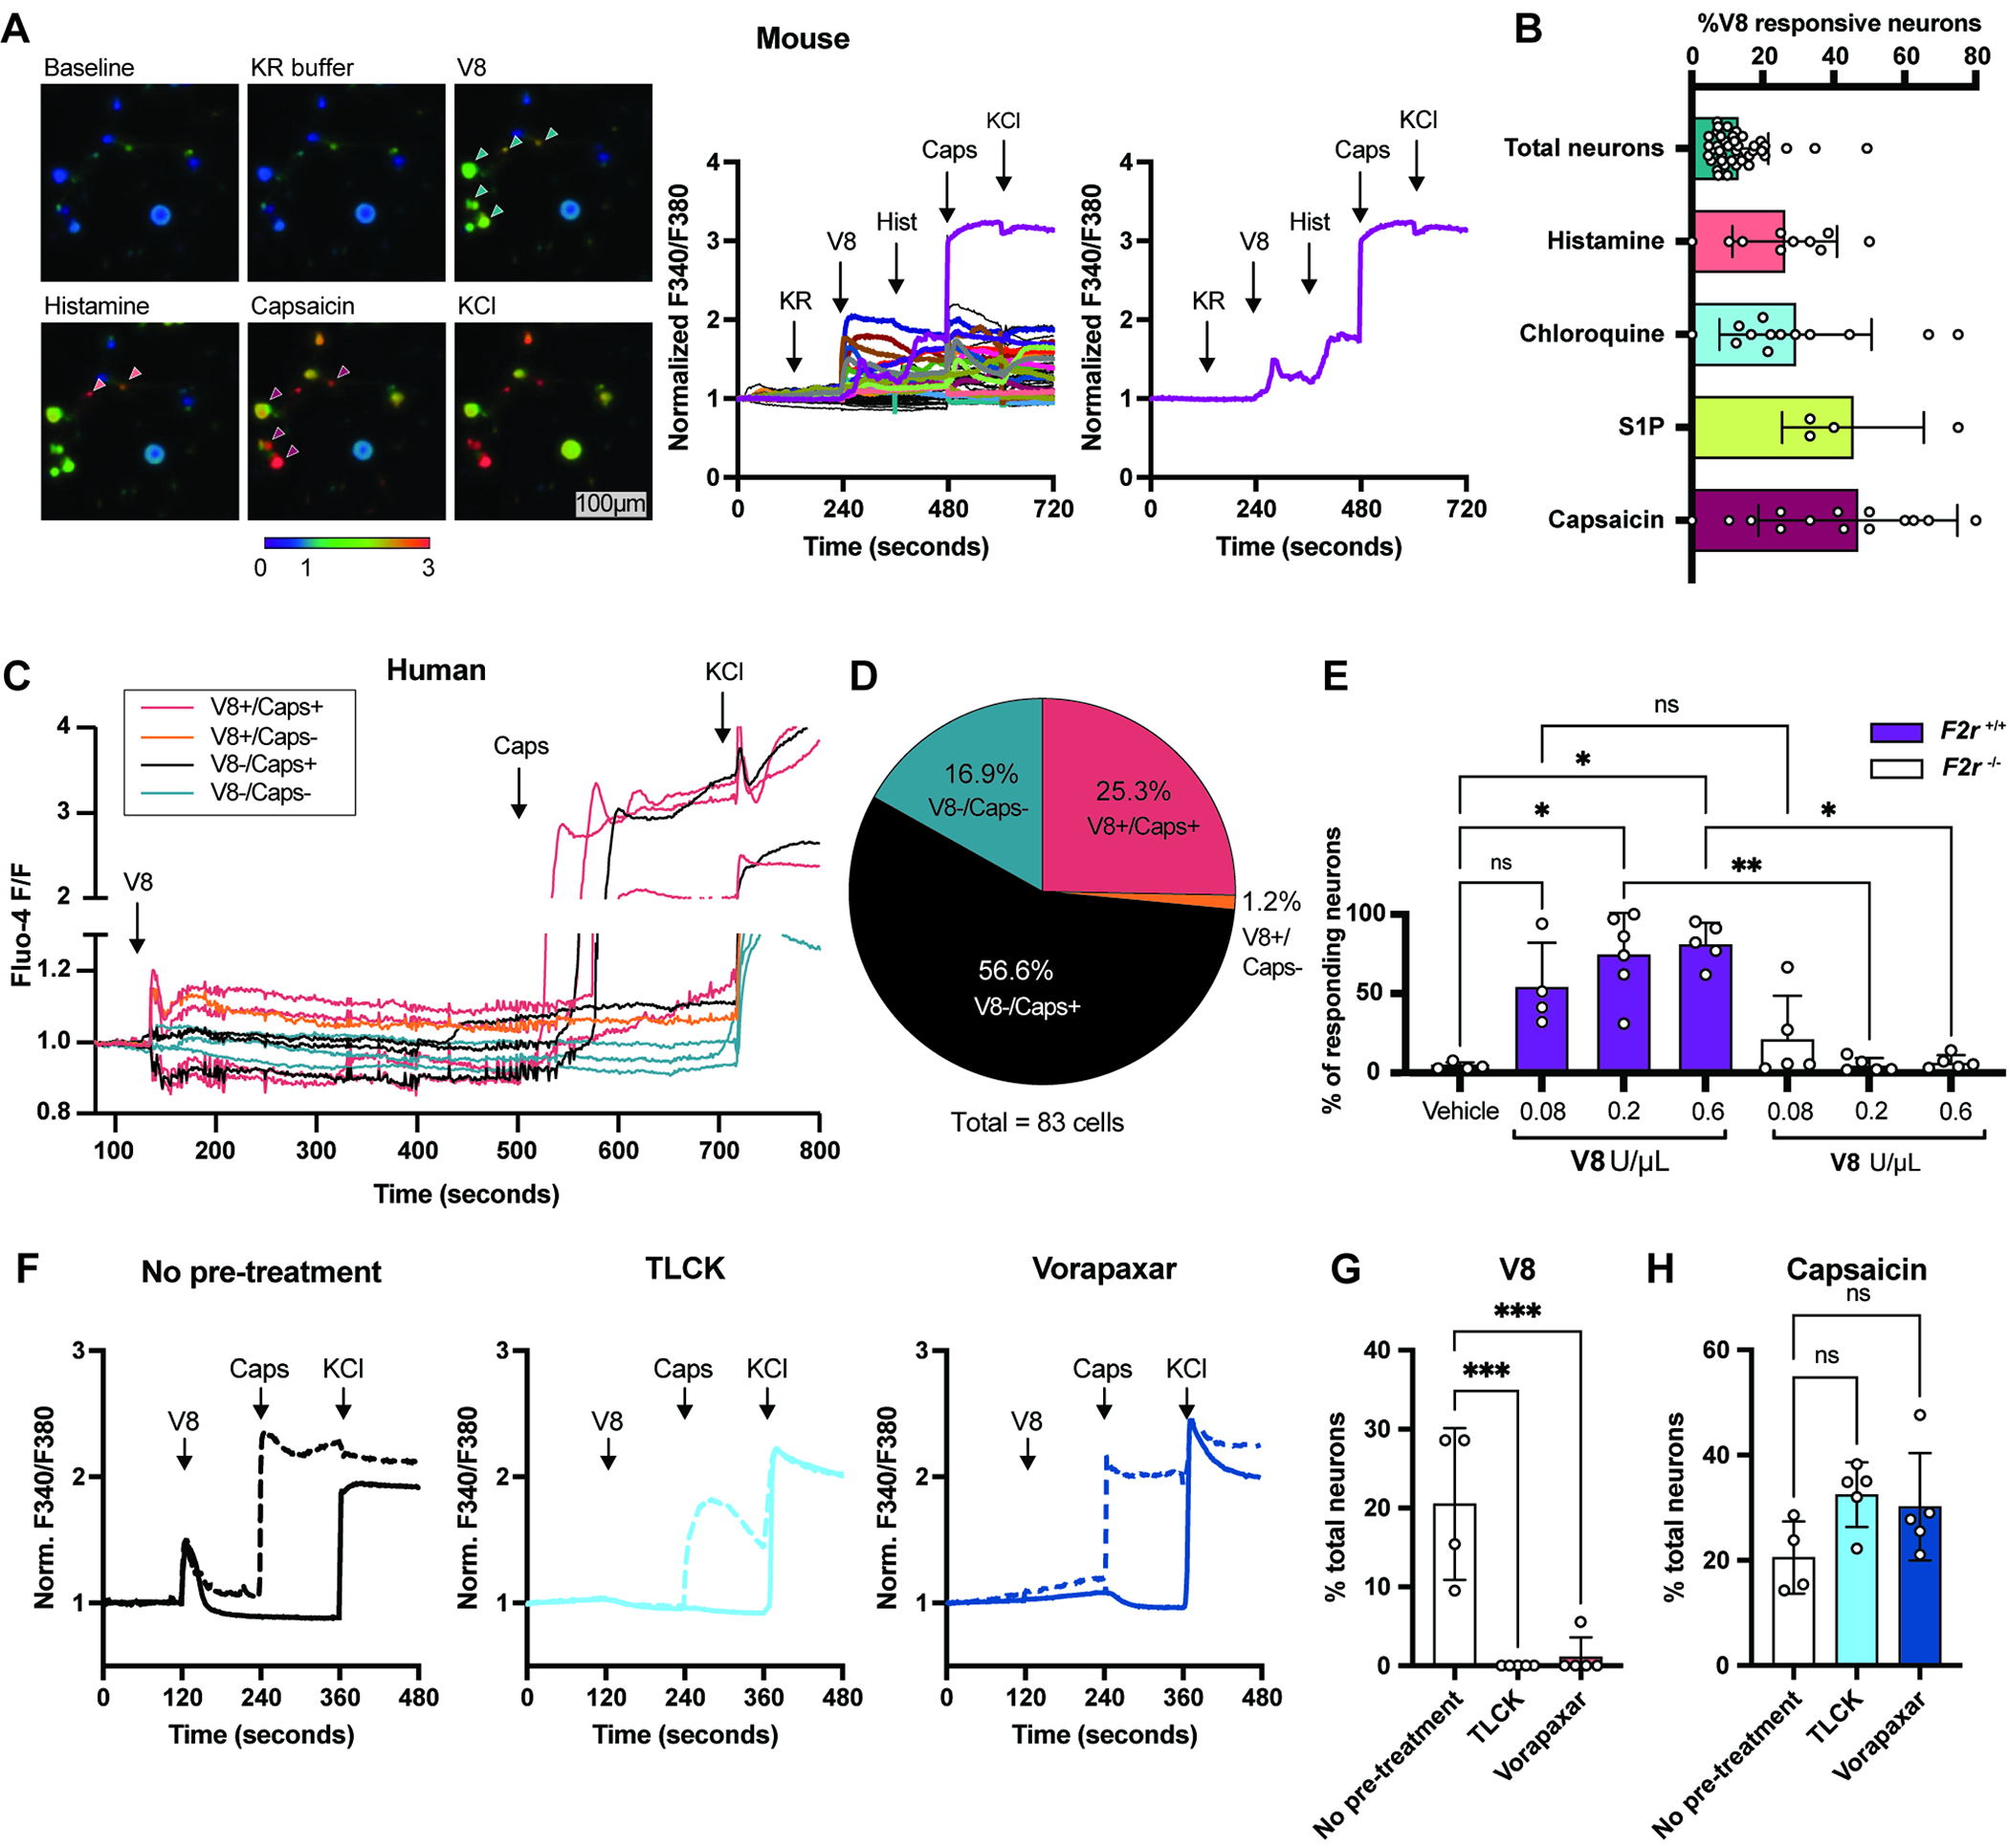
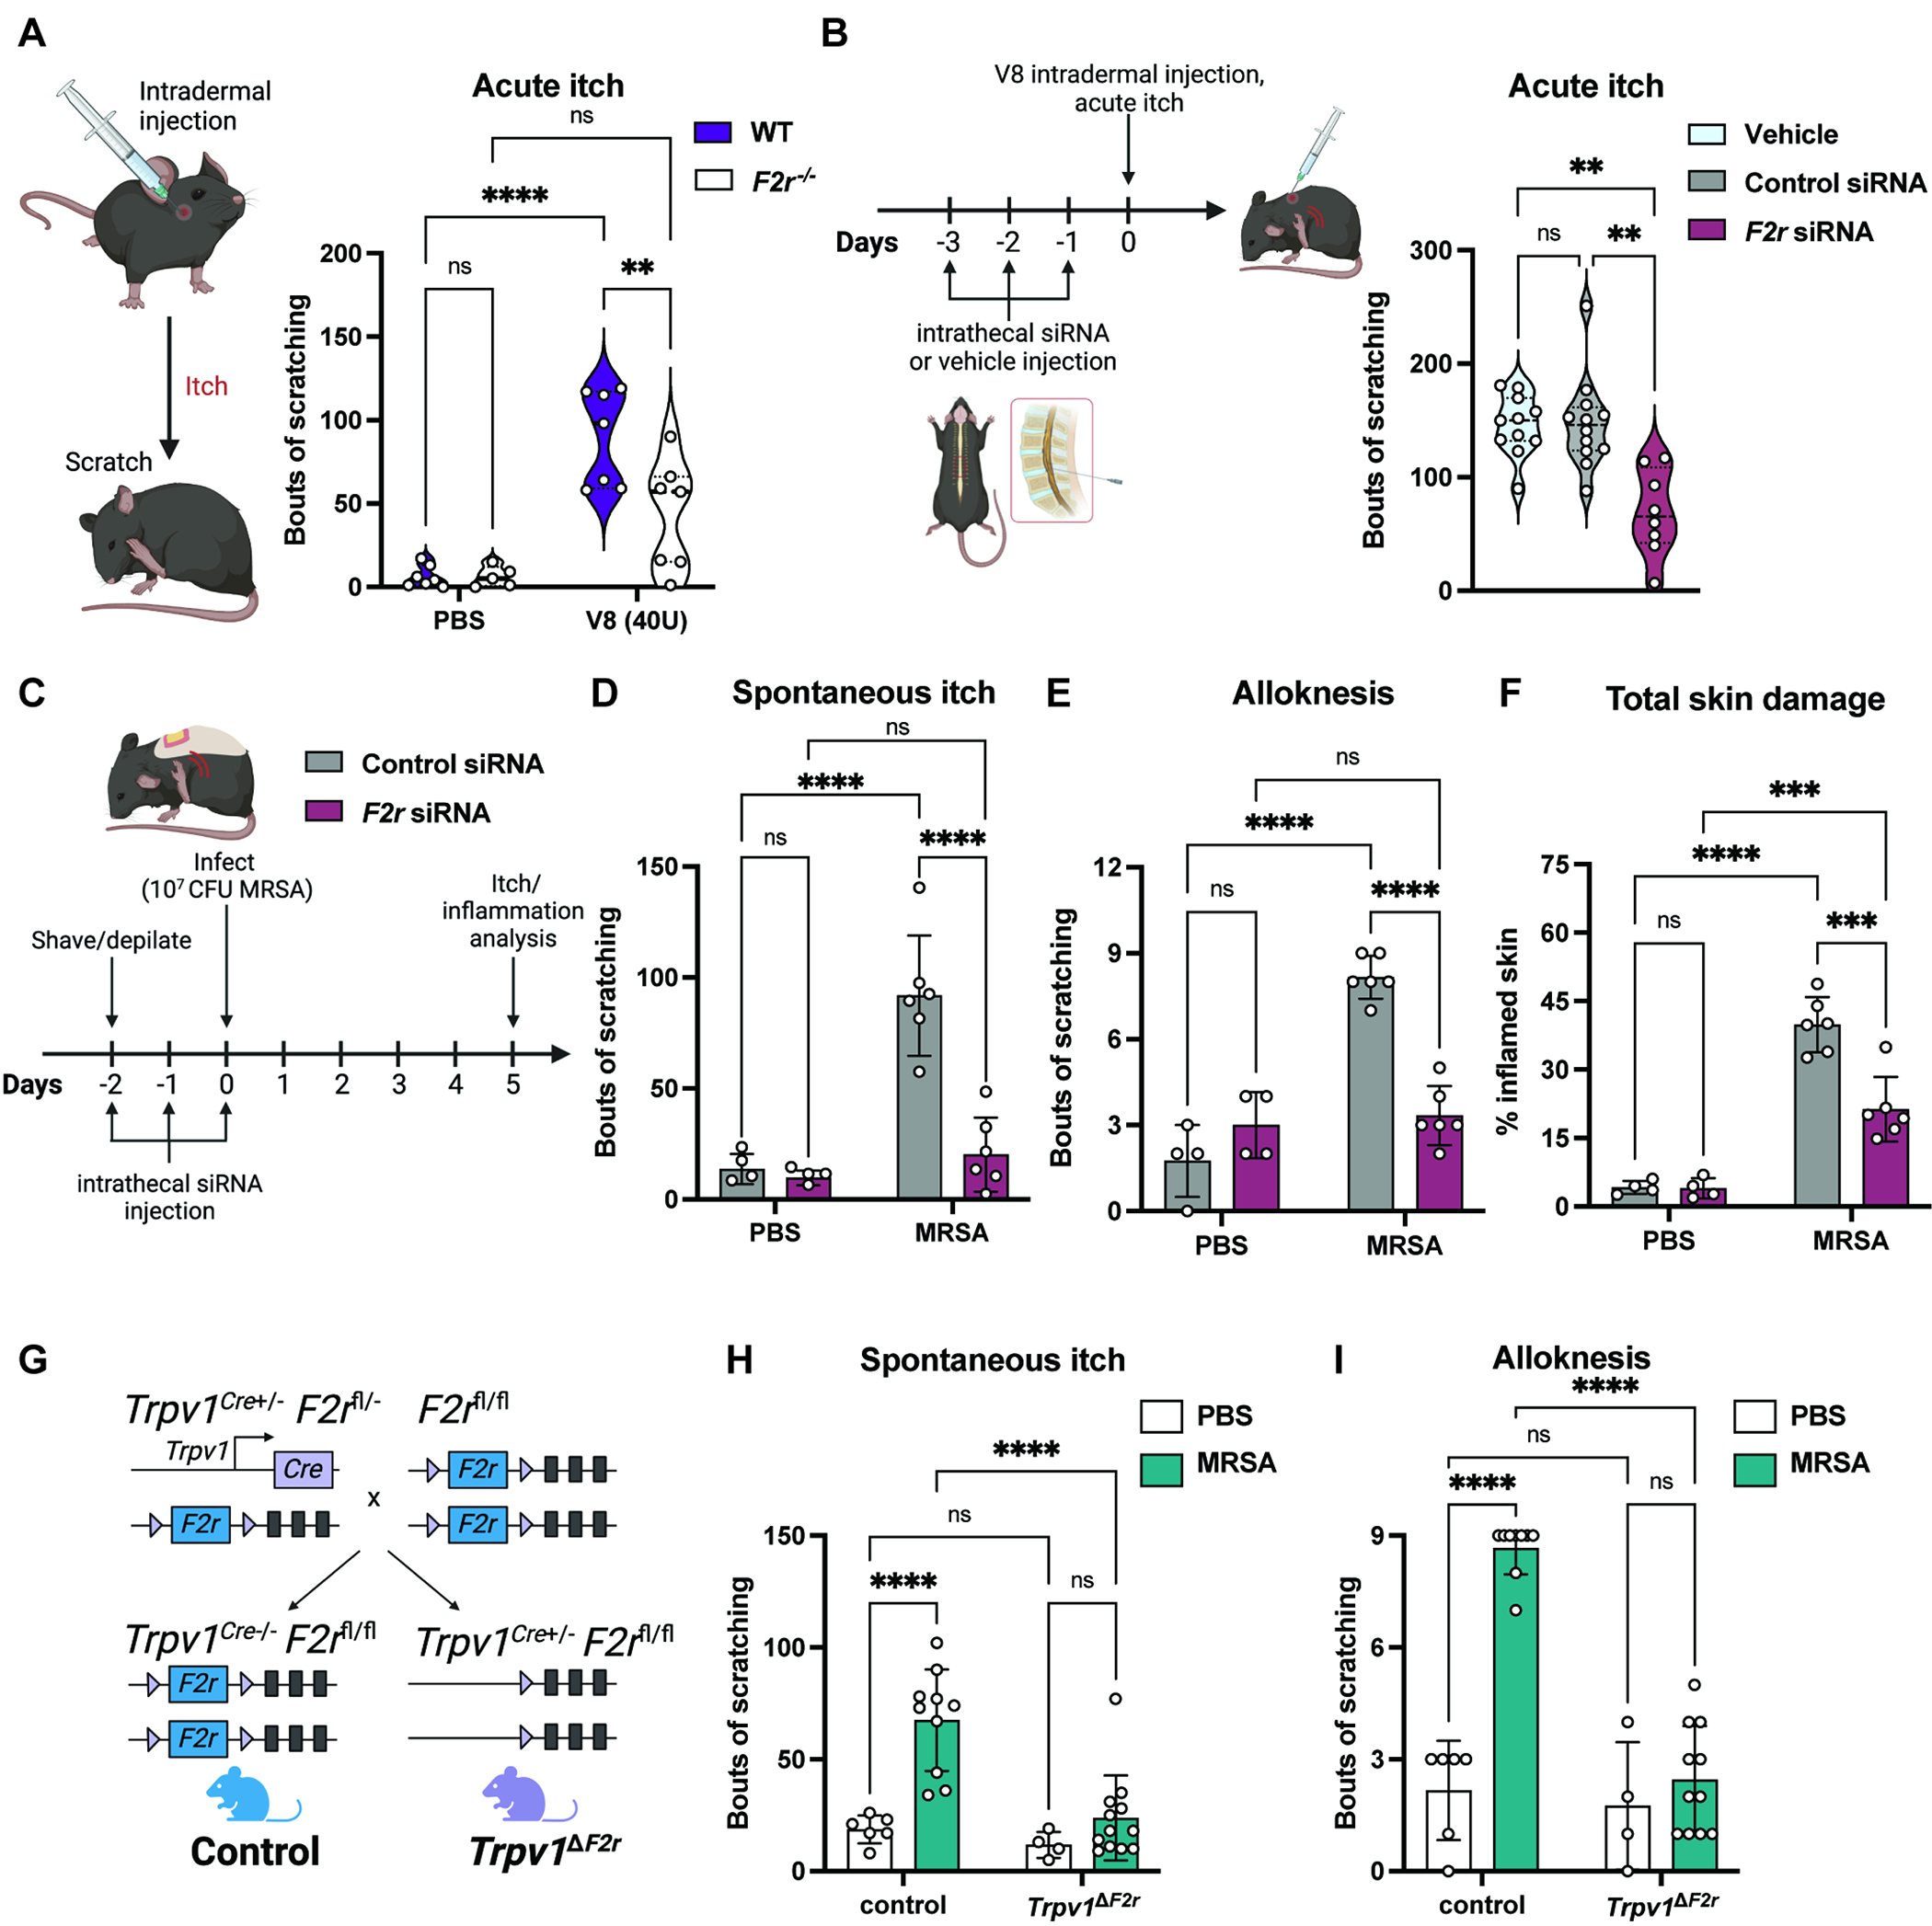
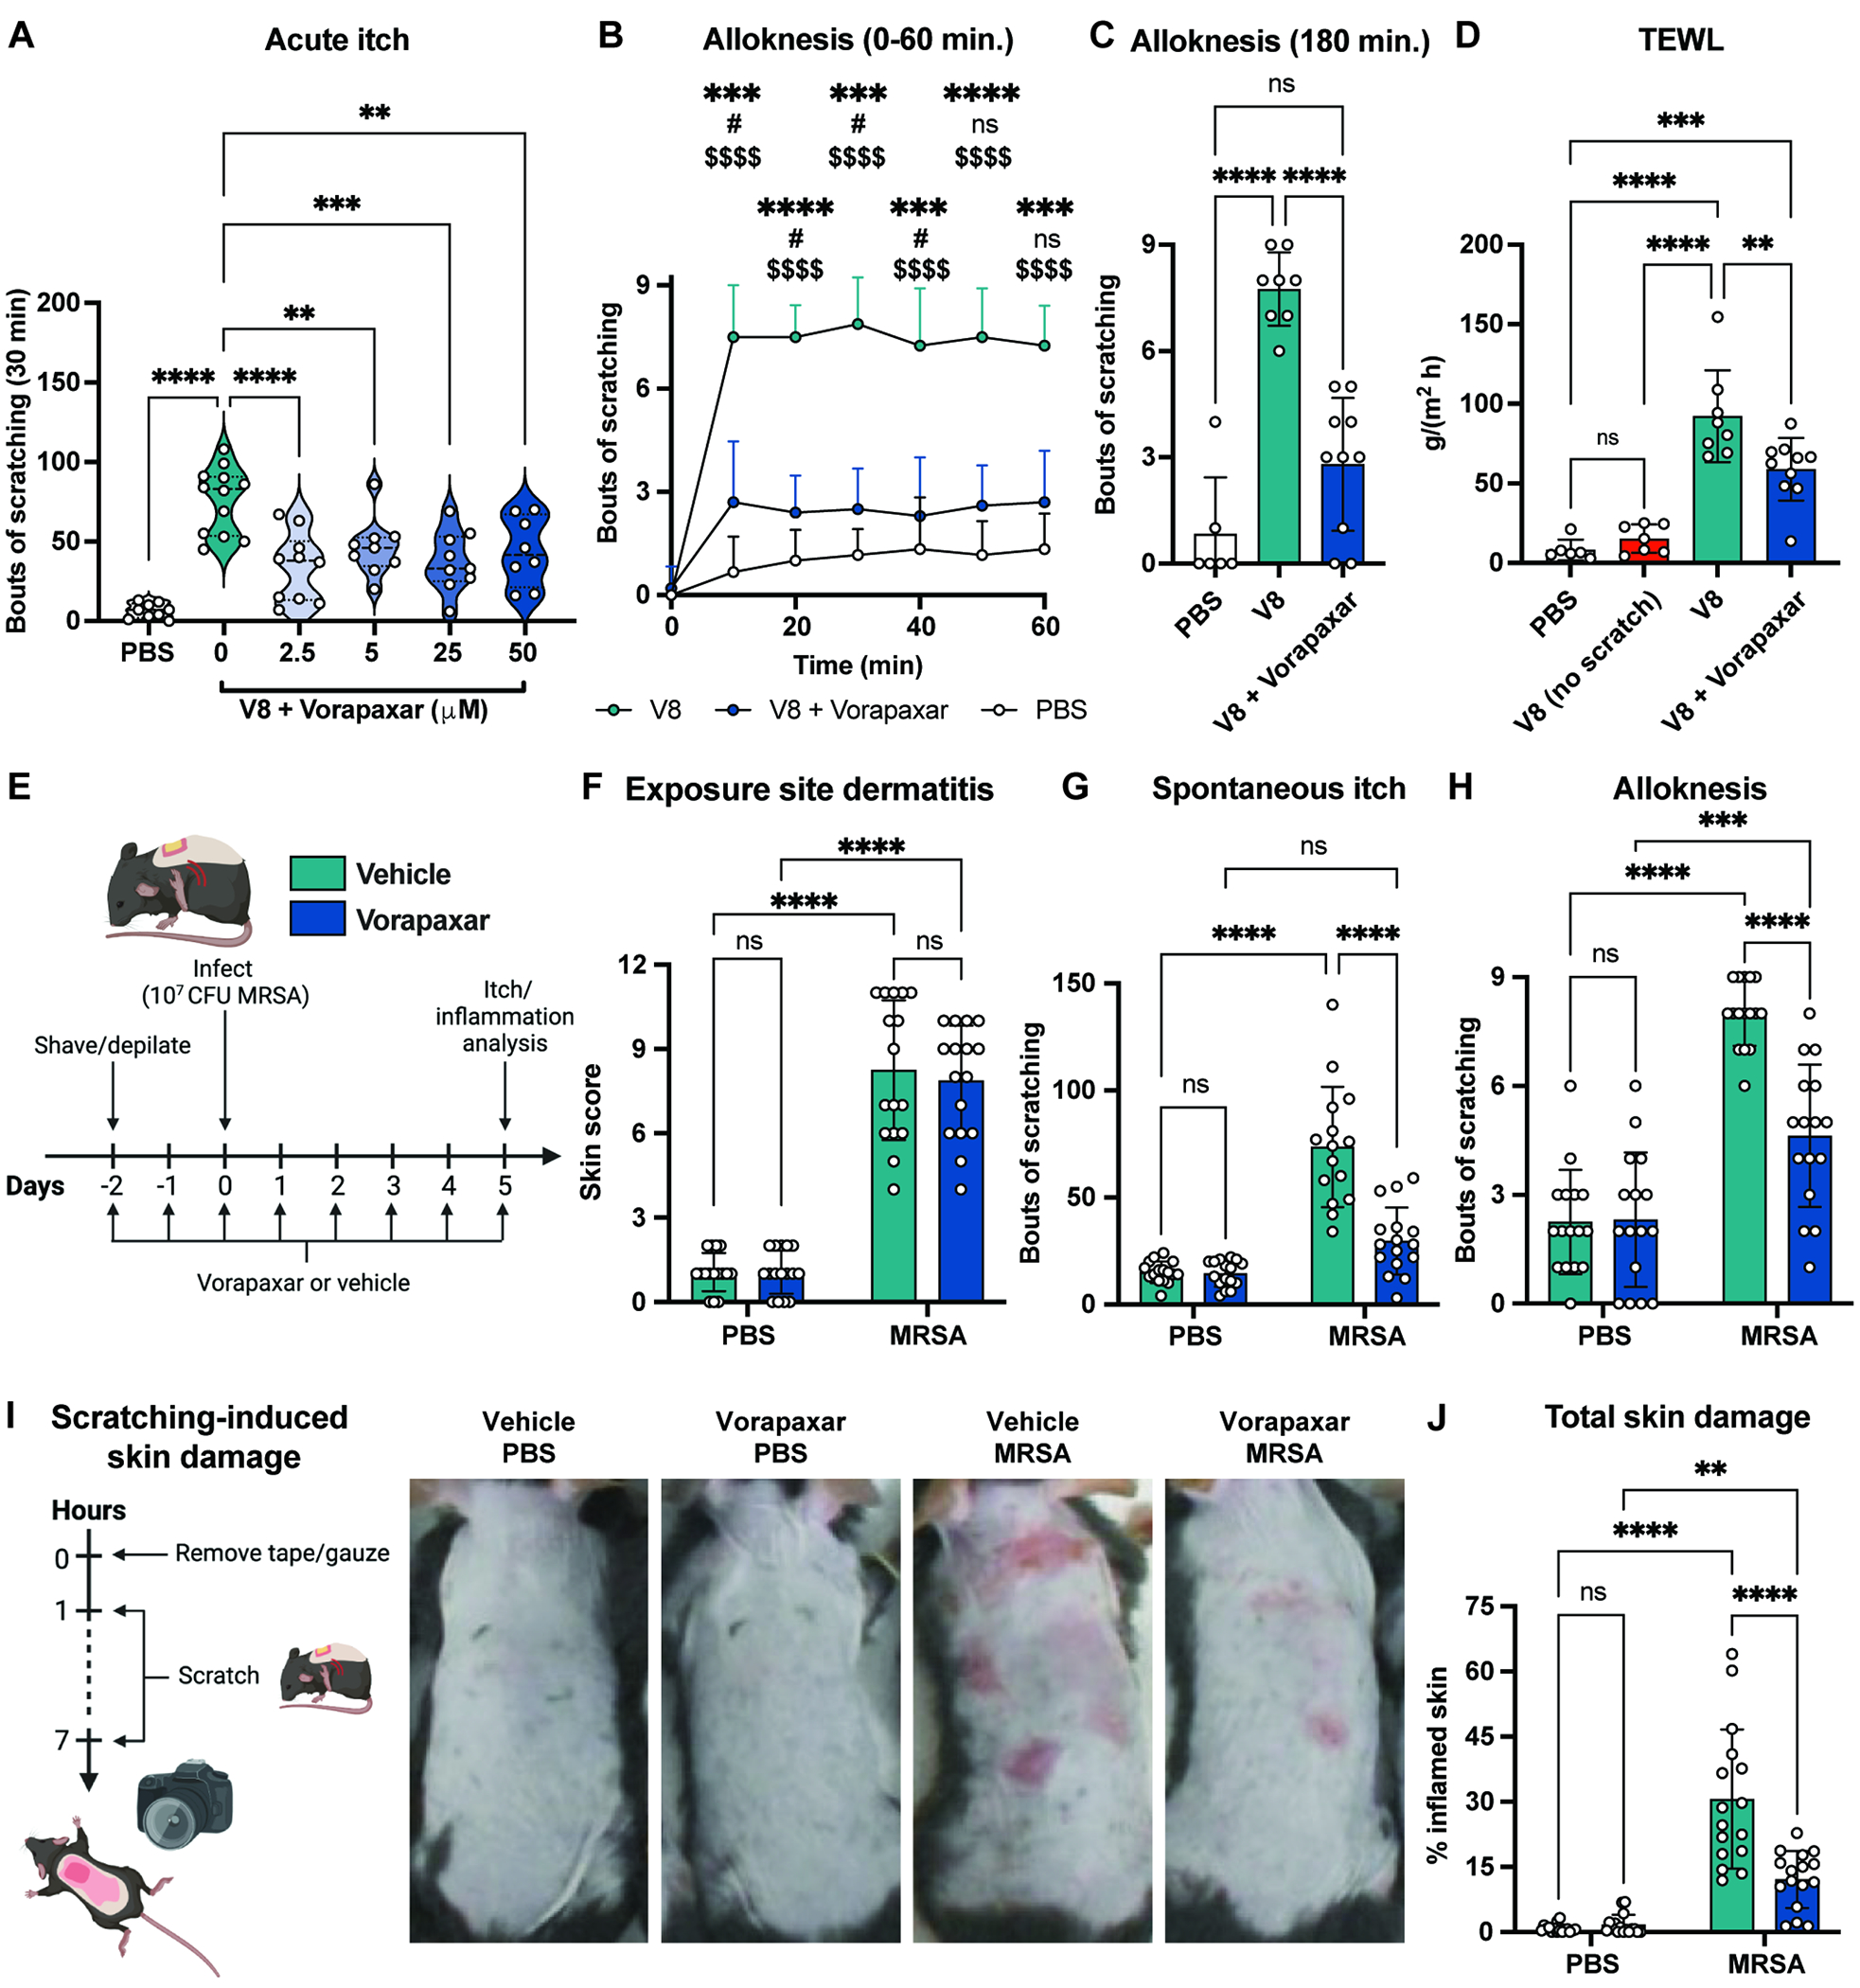
Itch is an unpleasant sensation that evokes a desire to scratch. The skin barrier is constantly exposed to microbes and their products. However, the role of microbes in itch generation is unknown. Here, we show that Staphylococcus aureus, a bacterial pathogen associated with itchy skin diseases, directly activates pruriceptor sensory neurons to drive itch. Epicutaneous S. aureus exposure causes robust itch and scratch-induced damage. By testing multiple isogenic bacterial mutants for virulence factors, we identify the S. aureus serine protease V8 as a critical mediator in evoking spontaneous itch and alloknesis. V8 cleaves proteinase-activated receptor 1 (PAR1) on mouse and human sensory neurons. Targeting PAR1 through genetic deficiency, small interfering RNA (siRNA) knockdown, or pharmacological blockade decreases itch and skin damage caused by V8 and S. aureus exposure. Thus, we identify a mechanism of action for a pruritogenic bacterial factor and demonstrate the potential of inhibiting V8-PAR1 signaling to treat itch.

Keywords: PAR1; Staphylococcus aureus; V8 protease; itch; microbe; proteinase-activated receptor; pruriceptor.


Conflict of interest statement

Declaration of interests I.M.C. serves on the SAB of GSK Pharmaceuticals. Provisional patent application serial no. 63/438,668, of which some co-authors are inventors, was filed based on these findings.

Figures

Figure 1.
Figure 1.. Epicutaneous S. aureus induces itch and scratch-induced skin pathology.
(A) Murine model of S. aureus exposure and itch analysis (B-E) 5-days after epicutaneous exposure, dermatitis (B), spontaneous itch (C-D), and (E) alloknesis were measured (n=8-13 males, 6-8 females per group) (F) Analysis of total skin damage after scratching (n=8 males, 8 females per group) (G) Total skin damage in mice allowed to scratch or prevented from scratching (n=6 males, 5-6 females per group) (H-J) Mice inoculated with S. aureus epicutaneously or infected subcutaneously; Representative images (H), spontaneous itch (I), and alloknesis (J) on day-5 (n=16 per group) For each panel, data combined from 2 independent experiments are shown. Data are represented as mean±SD. Statistical analysis: (B, D, E, F, G, I, J) Two-way ANOVA with Sidak’s multiple comparisons. *P<0.05; **P<0.01; ***P<0.001; ****P<0.0001; ns, not significant. See also Figure S1, S2, and S3.
Figure 2.
Figure 2.. Bacterial factors including Agr quorum sensing and proteases mediate itch.
(A) Whole mount images of skin from Nav1.8-tdTomato mice treated with PBS or GFP-MRSA (scale bars, 50 or 20μm) (B) Agr quorum sensing regulates expression of phenol soluble modulins (Psms), alpha-toxin (Hla), and proteases (C-D) Spontaneous itch, alloknesis (C) and dermatitis scores (D) recorded for control mice (PBS) or mice inoculated with WT or Δagr MRSA (n=10 males, 10 females per group) (E-F) Spontaneous itch, alloknesis (E) and dermatitis scores (F) for control mice (PBS) or mice inoculated with WT, Δhla or ΔPsms MRSA (n=8-15 males, 8-16 females per group) (G-H) Spontaneous itch, alloknesis (G) and dermatitis scores (H) for control mice (PBS) or mice inoculated with WT or ΔProtease MRSA (n=12 males, 12 females per group). For each panel, data combined from 4-6 independent experiments are shown. Data are represented as mean±SD. Statistical analysis: (C-H) One-way ANOVA. *P<0.05; **P<0.01; ***P<0.001; ****P<0.0001; ns, not significant. See also Figure S4 and Table S1.
Figure 3.
Figure 3.. S. aureus V8 protease contributes to itch and inflammation.
(A-B) Spontaneous itch (A) and alloknesis (B) for control mice (PBS) or mice inoculated with WT, ΔsspA, or ΔsspA + sspA MRSA (n=11-12 males, 12 females per group) (C) Total skin damage for control (PBS) or mice inoculated with WT, ΔsspA, or ΔsspA + sspA MRSA (n=4-5 males, 4-5 females per group) (D) Representative skin images and dermatitis scores from control mice (PBS) or mice inoculated with WT, ΔsspA, or ΔsspA + sspA MRSA (n= 11-12 males, 12 females per group) (E-H) Skin collected from mice at 1-, 3-, and 5-days post-inoculation with MRSA quantified for sspA (F), psmA1 (G), and hla (H) transcripts (normalized to 1-day post-inoculation) (n=2 males, 2 females per group) (I) Quantification of sspA mRNA from skin swabs from healthy human subjects or non-lesional and lesional skin from AD patients (n=13-14 per group) (J) Mouse acute itch and pain behavior (K-L) Acute itch (K) and pain (L) following intradermal injection with PBS, V8, histamine or capsaicin (n=4-5 males, 4-5 females per group) (M) Mouse intradermal injection and alloknesis model (N) Alloknesis after injection with PBS, V8, or histamine (n=3-5 males, 3-5 females per group) For each panel, data combined from 2 independent experiments are shown. Data are represented as mean±SD. Statistical analysis: (A-D, F-I, K-L) One-way ANOVA. (N) Two-way ANOVA, Tukey’s multiple comparisons. *V8 vs. Histamine; #Histamine vs. PBS; $V8 vs. PBS; *P<0.05; **P<0.01; ***P<0.001; ****P<0.0001; ns, not significant. See also Figure S5.
Figure 4.
Figure 4.. V8 protease cleaves PAR1, which is expressed by pruriceptors
(A) PAR cleavage assays using nLuc-PAR-eYFP-CHO cells (B-C) Cleavage data of human PAR1, 2, 4 by V8 protease, or thrombin (for PAR1, PAR4) or trypsin (for PAR2). (D) V8 cleavage sites (arrows) on N-terminus of human PAR1 identified by mass spectrometry (E) Representative images of RNAscope hybridization of mouse DRG sections for F2r and Tubb3 (F) Quantification of F2r expression in Tubb3-positive mouse neurons averaged per mouse (n=3 males, 3 females). Data are represented as mean±SD. (G) Representative images of RNAscope hybridization of human DRG sections for F2R, TRPV1, and NPPB. Total of 1,328 neurons analyzed across 4 donors. (H) Quantification of F2R expression in human neurons, proportions and frequency by size and marker expression. See also Figure S6 and Table S2.
Figure 5.
Figure 5.. V8 protease directly activates pruriceptor neurons
(A) Representative Fura-2 ratiometric fields and calcium traces of mouse DRG neurons. Scale, 100μm. (B) Percentages of total neurons (responsive to KCl) (n=41 fields) histamine-responsive (n= 10 fields) chloroquine-responsive (n=14 fields), S1P-responsive (n=4 fields) and capsaicin-responsive (n=16 fields) neurons that also respond to V8. (C) Calcium traces of human DRG neurons from a representative dish treated with V8, capsaicin, KCl (D) Pie chart showing human neuron populations responding to V8 and capsaicin (V8+/Cap+), V8 alone (V8+/Cap−), capsaicin alone (V8−/Cap+), and unresponsive to either (V8−/Cap−) (E) Calcium imaging analysis of DRG neurons from F2r+/+ and F2r−/− mice treated with increasing doses of V8 (F) Representative calcium traces of DRG neurons treated with V8, capsaicin, KCl with no pre-treatment (left) or 5 min. post-treatment with TLCK (middle) or Vorapaxar (right). (G-H) Percentage of untreated neurons and neurons pre-treated with TLCK or Vorapaxar responding to V8 (G) or capsaicin (H). For each panel, data combined from 5 independent experiments are shown. Data are represented as mean±SD. Statistical analysis: (B, E, G, H) One-way ANOVA. *P<0.05; **P<0.01; ***P<0.001; ns, not significant. See also Figure S7.
Figure 6.
Figure 6.. Neuronal PAR1 (F2r) is required for V8 and S. aureus-induced itch
(A) PBS or V8 protease injected intradermally into cheek of wildtype (F2r+/+) and F2r−/− mice, spontaneous scratching over 30 min. (n=3-4 males, 2-4 females per group) (B) Acute itch behaviors measured for mice treated with vehicle, control siRNA, or F2r siRNA (n=4-6 males, 4-6 females per group). (C-F) Mice receiving intrathecal siRNA injections were treated with PBS or exposed to MRSA. Spontaneous itch (D), alloknesis, (E) and scratch-induced skin damage (F) measured 5-days post-exposure (n=4-6 males per group). (G) Generation of Trpv1ΔF2r and Trpv1cre control mice. (H-I) Spontaneous itch (H) and alloknesis (I) for Trpv1ΔF2r and control mice treated with PBS or exposed to MRSA (n=3-8 males, 1-6 females per group). For each panel, data combined from 2-3 independent experiments are shown. Data are represented as mean±SD. Statistical analysis: (A, D-F, H, I) Two-way ANOVA, Sidak’s multiple comparisons. (B, E) Mann-Whitney test. **P<0.01; ***P<0.001; ****P<0.0001; ns, not significant. See also Figure S8.
Figure 7.
Figure 7.. Treatment with PAR1 antagonist reduces itch and skin damage during S. aureus exposure
(A) Bouts of scratching following cheek injection with PBS or V8 with increasing doses of Vorapaxar (n=4-6 males, 4-6 females per group). (B-C) Alloknesis measured every 10 min. for 1hr (B) and 3 hrs (C) after cheek injection with PBS, V8, or V8+Vorapaxar (n=3-5 males, 3-5 females per group). (D) Mice injected with PBS, V8, or V8+Vorapaxar were allowed to scratch; TEWL measured 3 hrs post-injection. One group of V8-injected mice were wrapped in bandages to prevent scratching. (E-J) Mice gavaged daily with vehicle or Vorapaxar from 2-days before exposure to PBS or MRSA. Dermatitis scores (F), spontaneous itch (G), alloknesis (H), scratch-induced skin damage (I-J) measured for control and MRSA-exposed mice treated with vehicle or Vorapaxar (n=7-8 males, 8 females per group) For each panel, data combined from 2 independent experiments are shown. Data are represented as mean±SD. Statistical analysis: (A, C, D) Mann-Whitney test (B) Two-way ANOVA with Tukey’s multiple comparisons: *V8 vs. V8+Vorapaxar; #V8+Vorapaxar vs. PBS; $V8 vs. PBS (F-H, J) Two-way ANOVA with Sidak’s multiple comparisons. *P<0.05; **P<0.01; ***P<0.001; ****P<0.0001; ns, not significant. See also Figure S9.

Comment in

Comment on

Similar articles

Cited by

References

    1. LaMotte RH, Dong X, and Ringkamp M (2014). Sensory neurons and circuits mediating itch. Nat Rev Neurosci 15, 19–31. 10.1038/nrn3641. - DOI - PMC - PubMed
    1. Bautista DM, Wilson SR, and Hoon MA (2014). Why we scratch an itch: the molecules, cells and circuits of itch. Nat Neurosci 17, 175–182. 10.1038/nn.3619. - DOI - PMC - PubMed
    1. Wang F, and Kim BS (2020). Itch: A Paradigm of Neuroimmune Crosstalk. Immunity 52, 753–766. 10.1016/j.immuni.2020.04.008. - DOI - PubMed
    1. Hwang J, Jaros J, and Shi VY (2020). Staphylococcus aureus in Atopic Dermatitis: Past, Present, and Future. Dermatitis 31, 247–258. 10.1097/DER.0000000000000589. - DOI - PubMed
    1. Campione E, Lanna C, Diluvio L, Cannizzaro MV, Grelli S, Galluzzo M, Talamonti M, Annicchiarico-Petruzzelli M, Mancini M, Melino G, et al. (2020). Skin immunity and its dysregulation in atopic dermatitis, hidradenitis suppurativa and vitiligo. Cell Cycle 19, 257–267. 10.1080/15384101.2019.1707455. - DOI - PMC - PubMed

Publication types

MeSH terms