. 2023 Dec 26;42(12):113437.
doi: 10.1016/j.celrep.2023.113437. Epub 2023 Nov 22.

Lidocaine induces apoptosis in head and neck squamous cell carcinoma through activation of bitter taste receptor T2R14

Affiliations

Lidocaine induces apoptosis in head and neck squamous cell carcinoma through activation of bitter taste receptor T2R14

Zoey A Miller et al. Cell Rep. .

Abstract

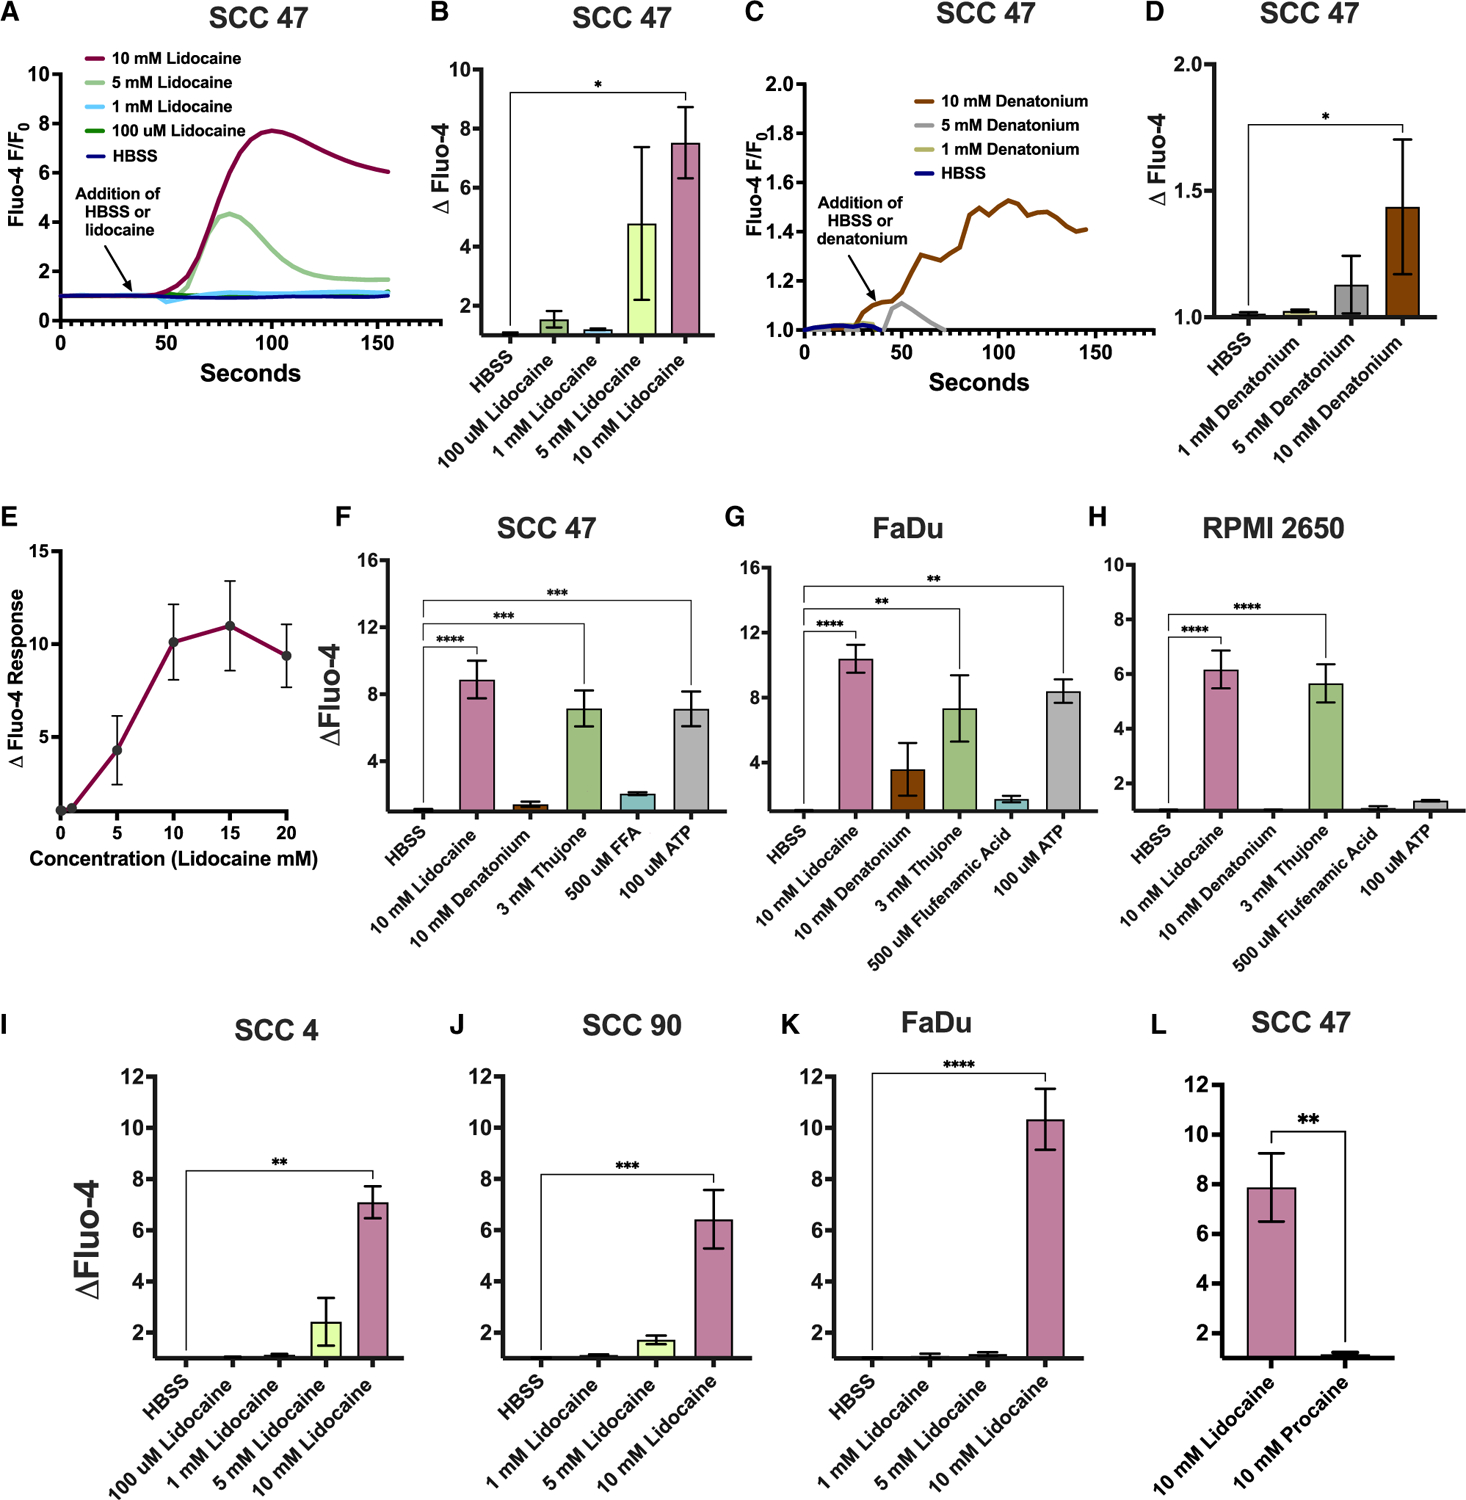
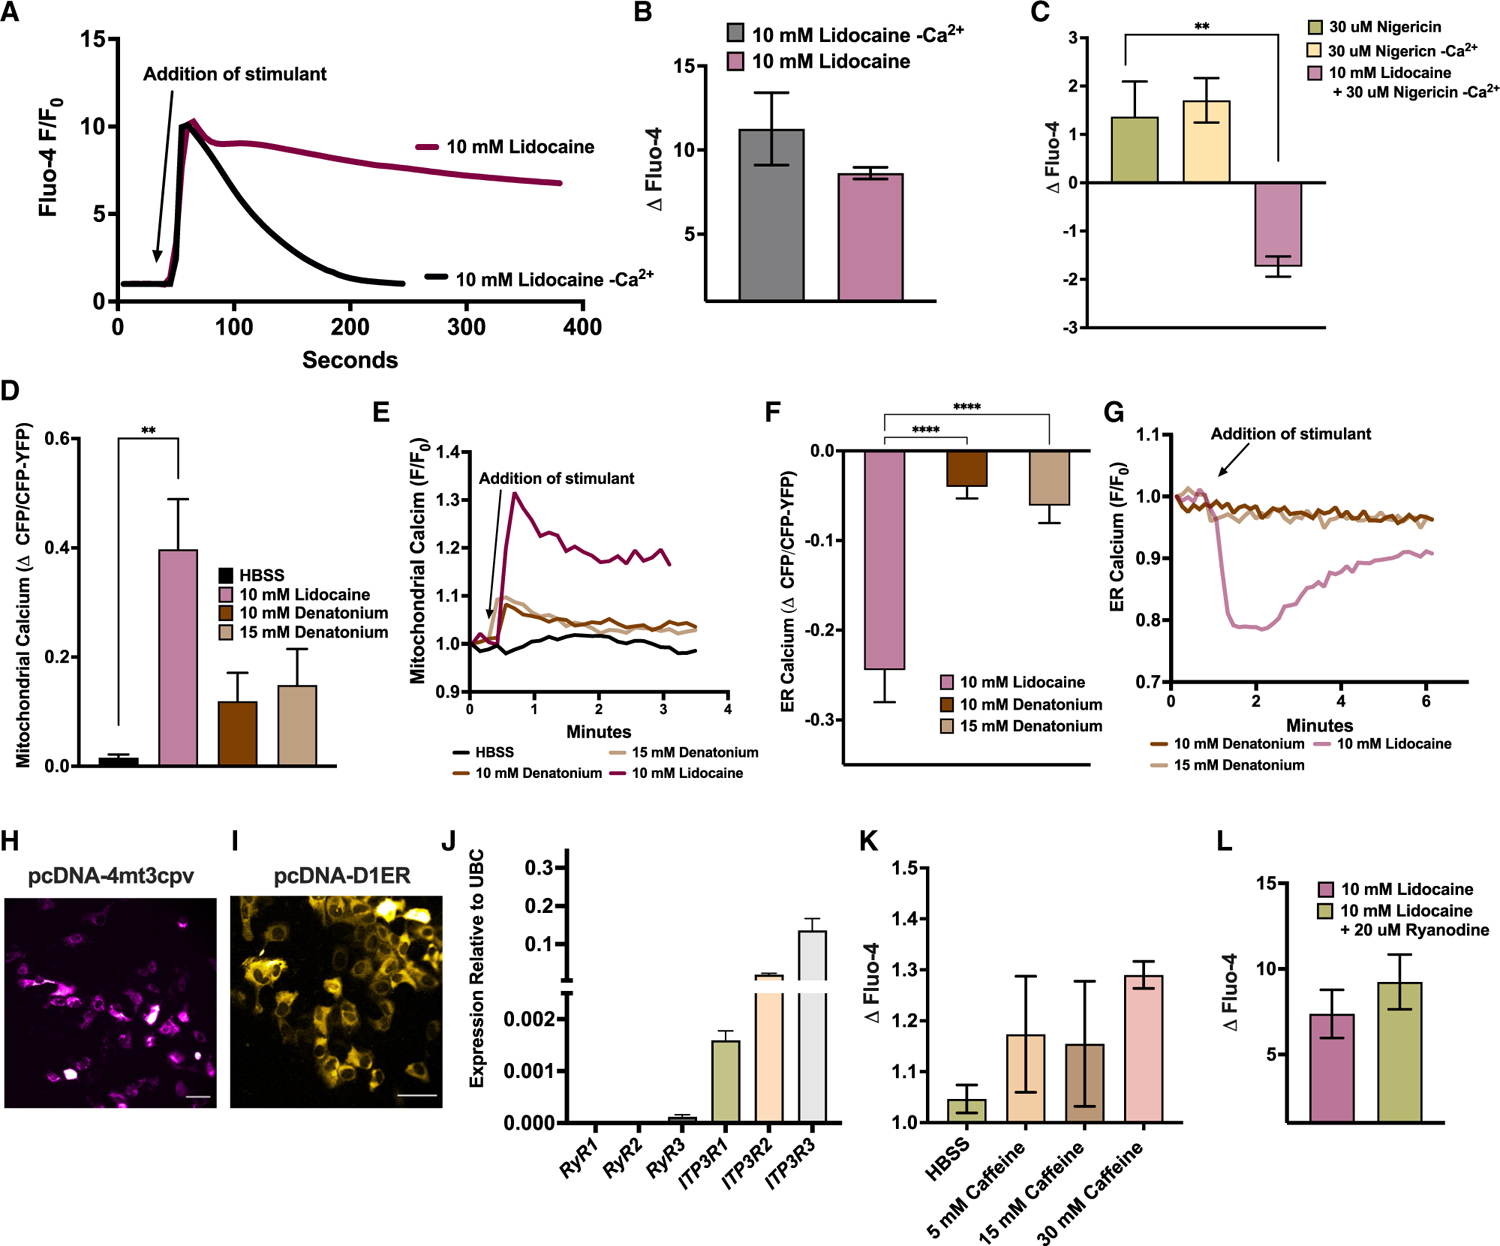
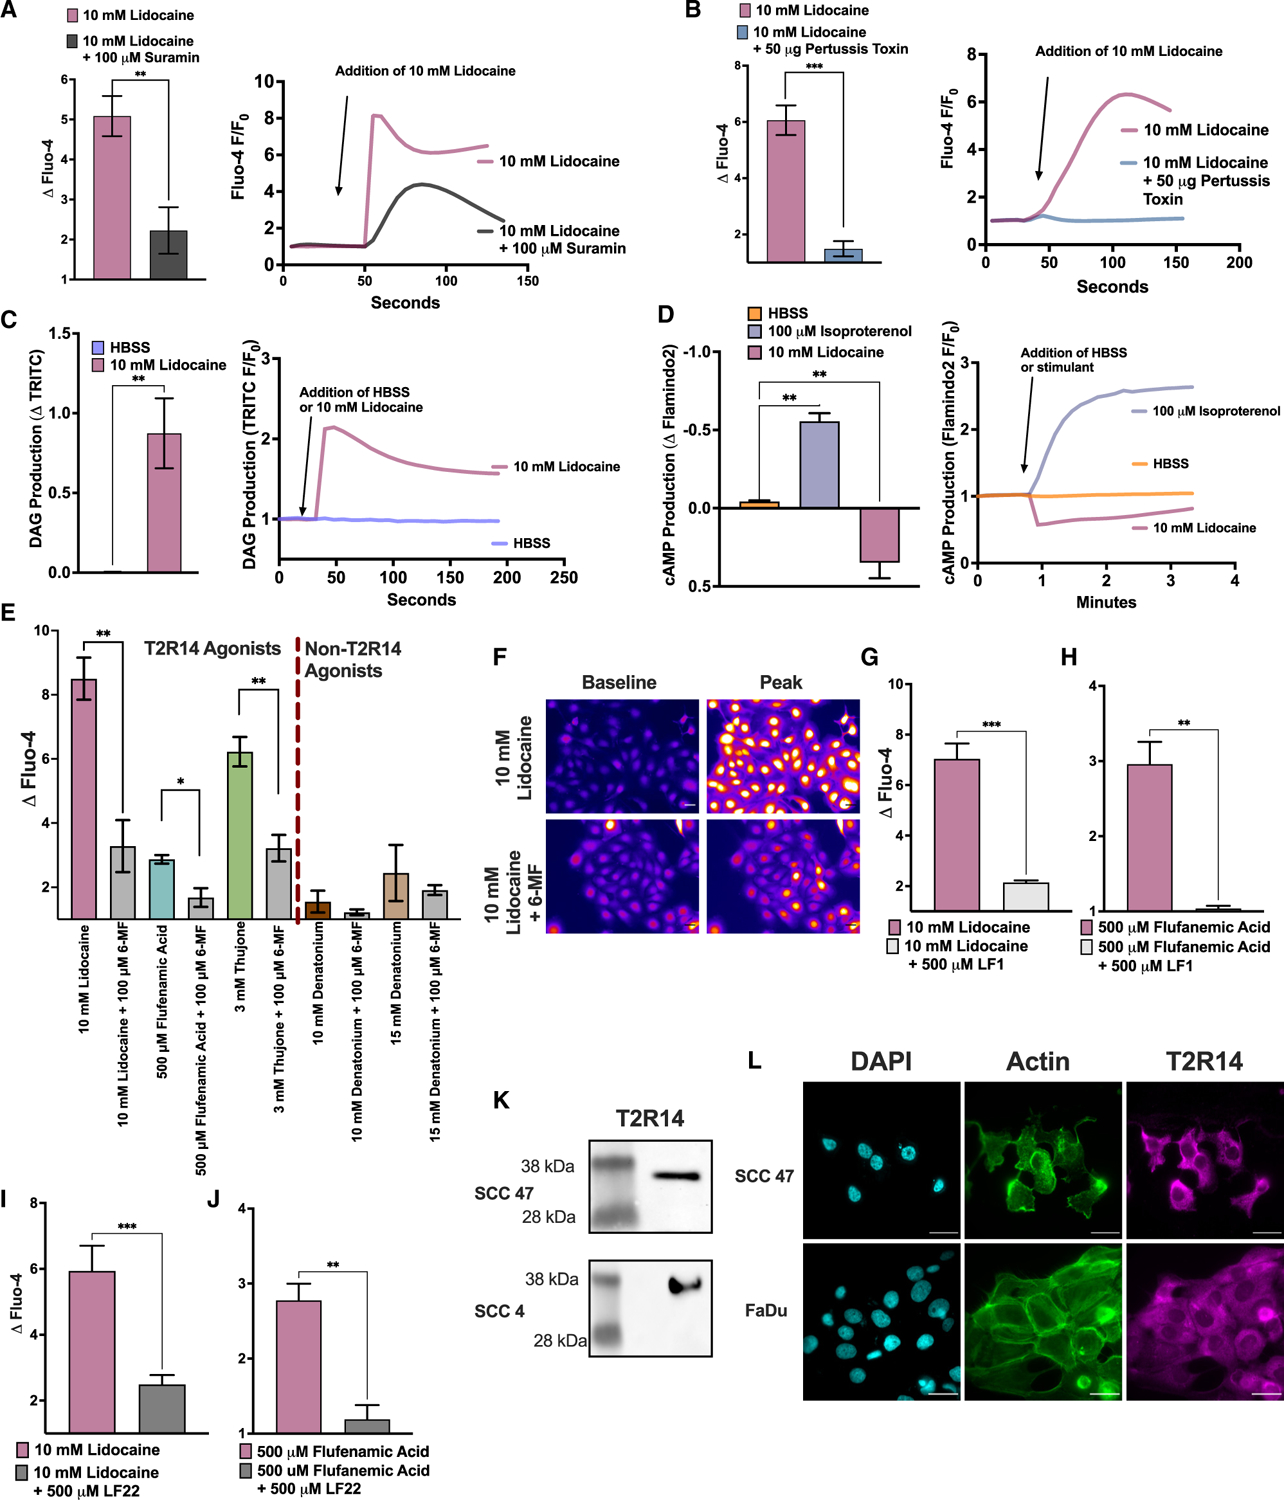
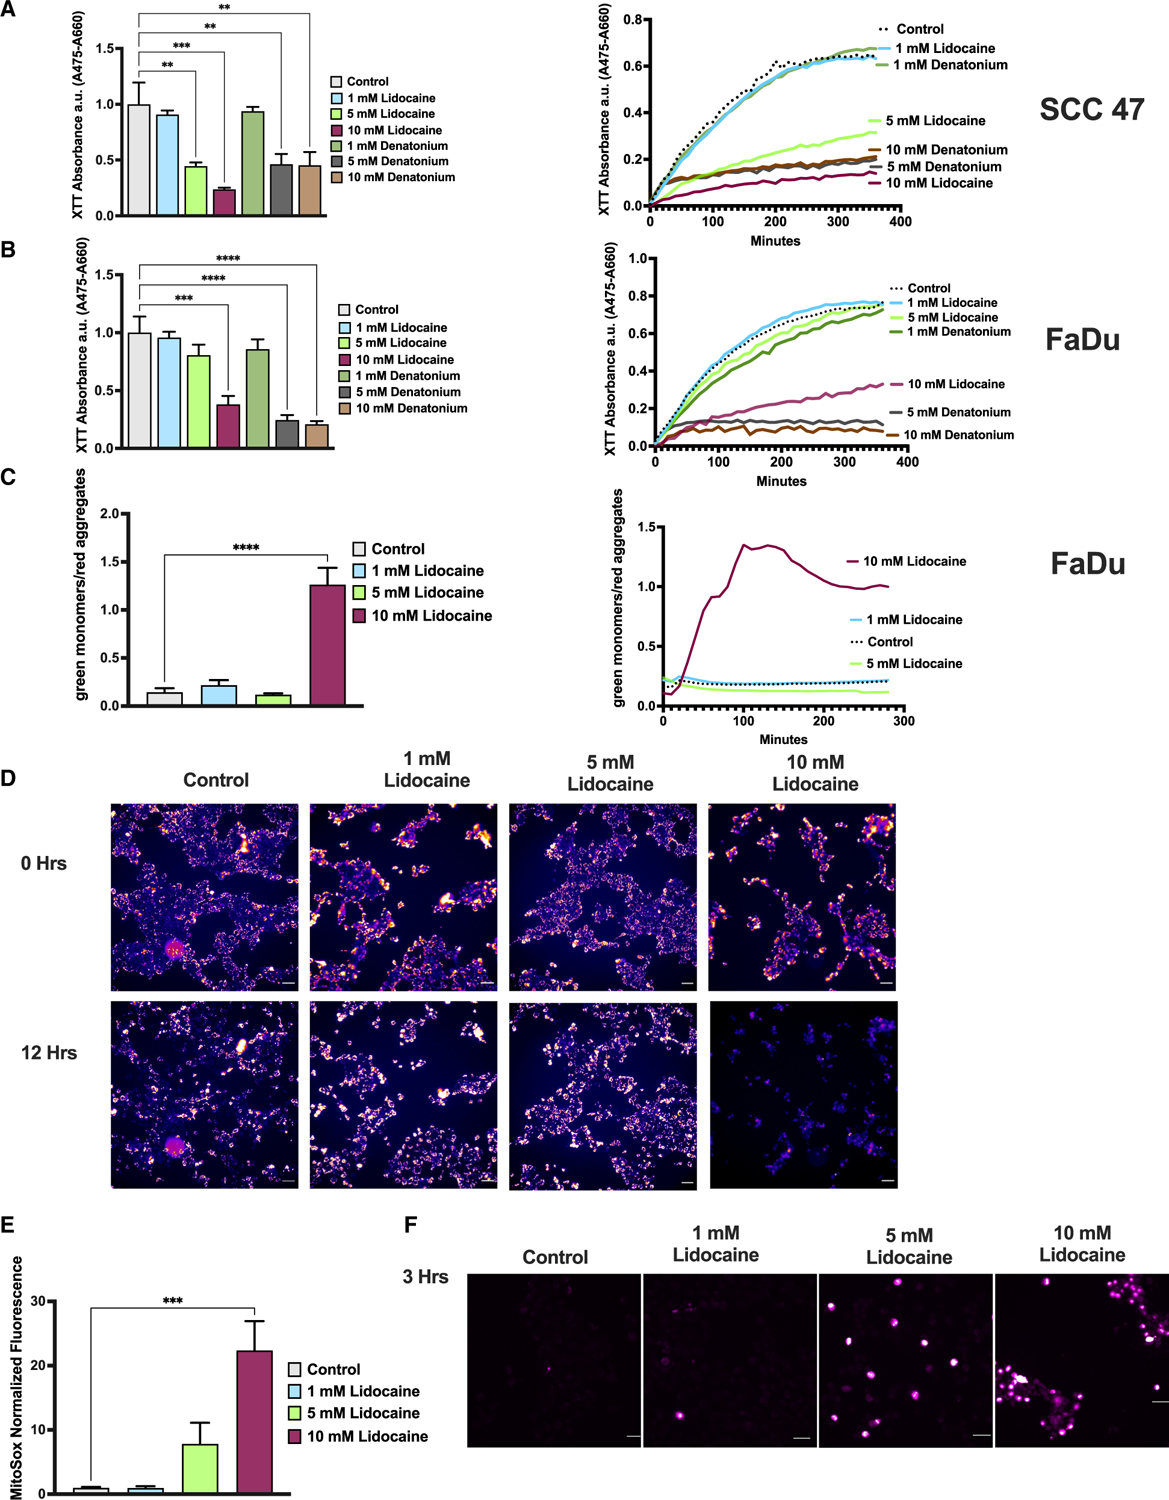
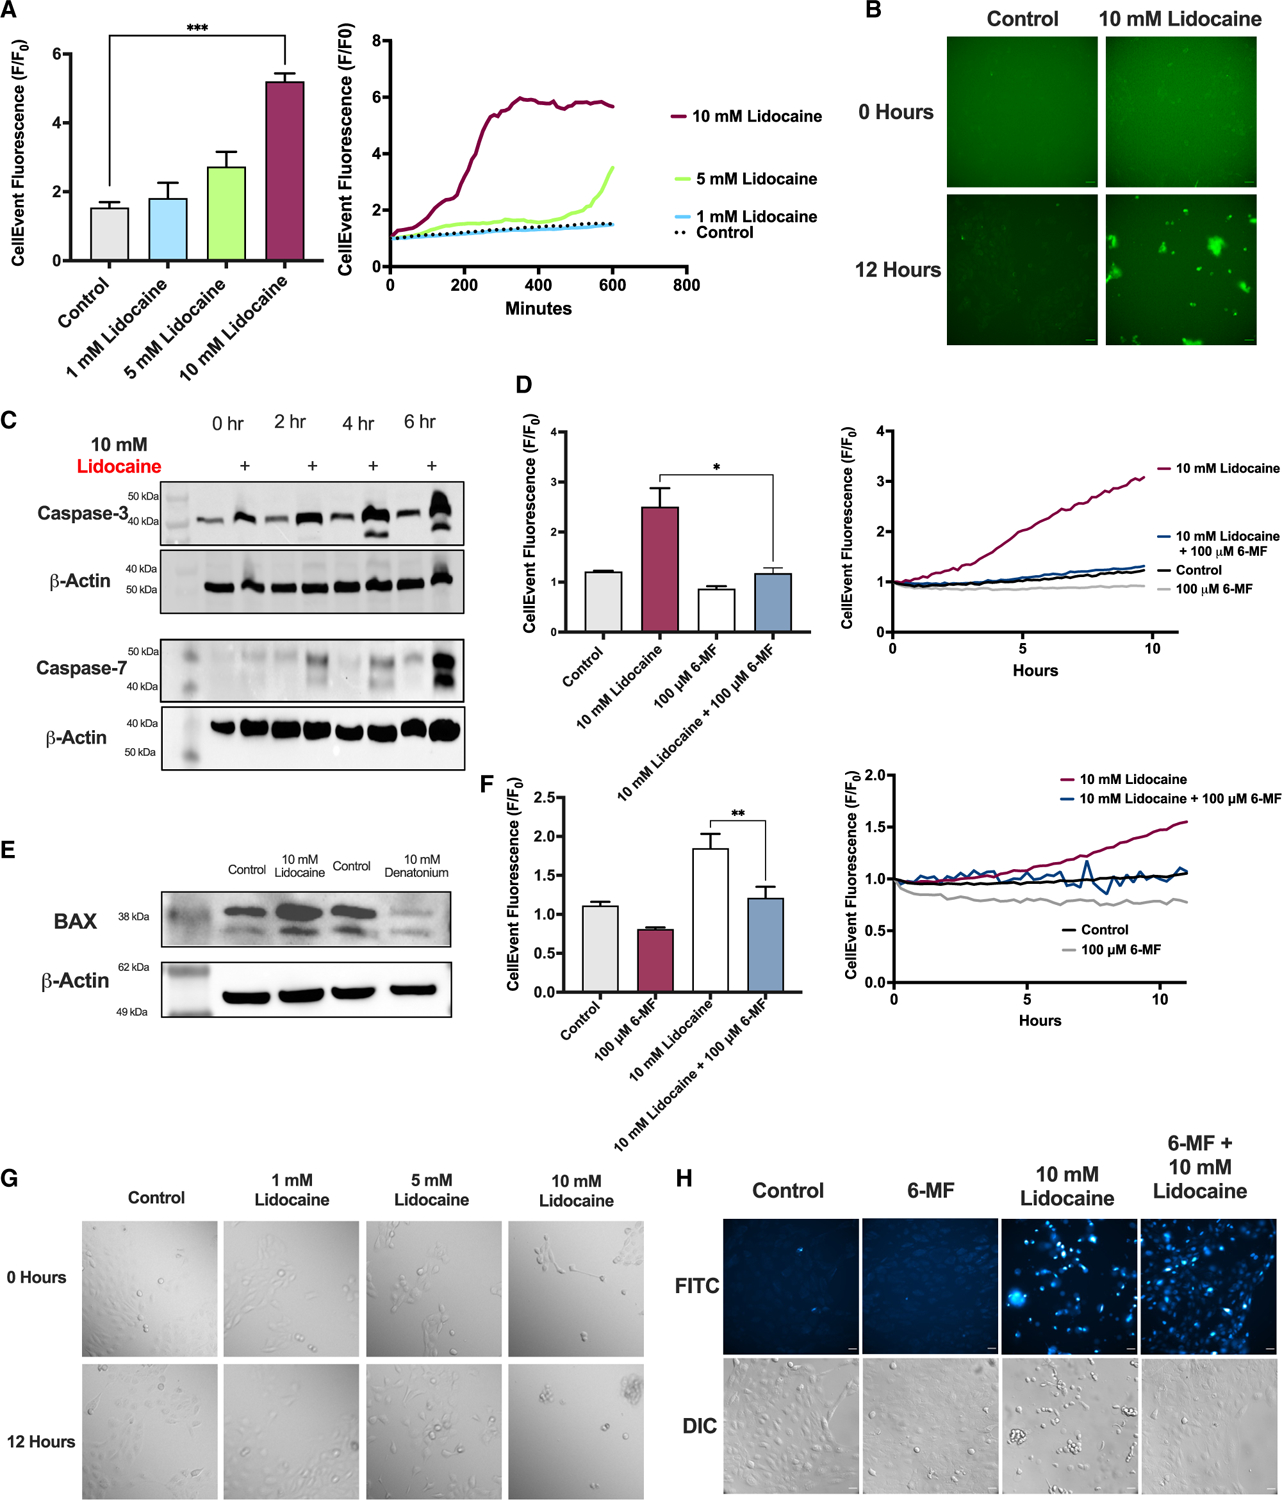
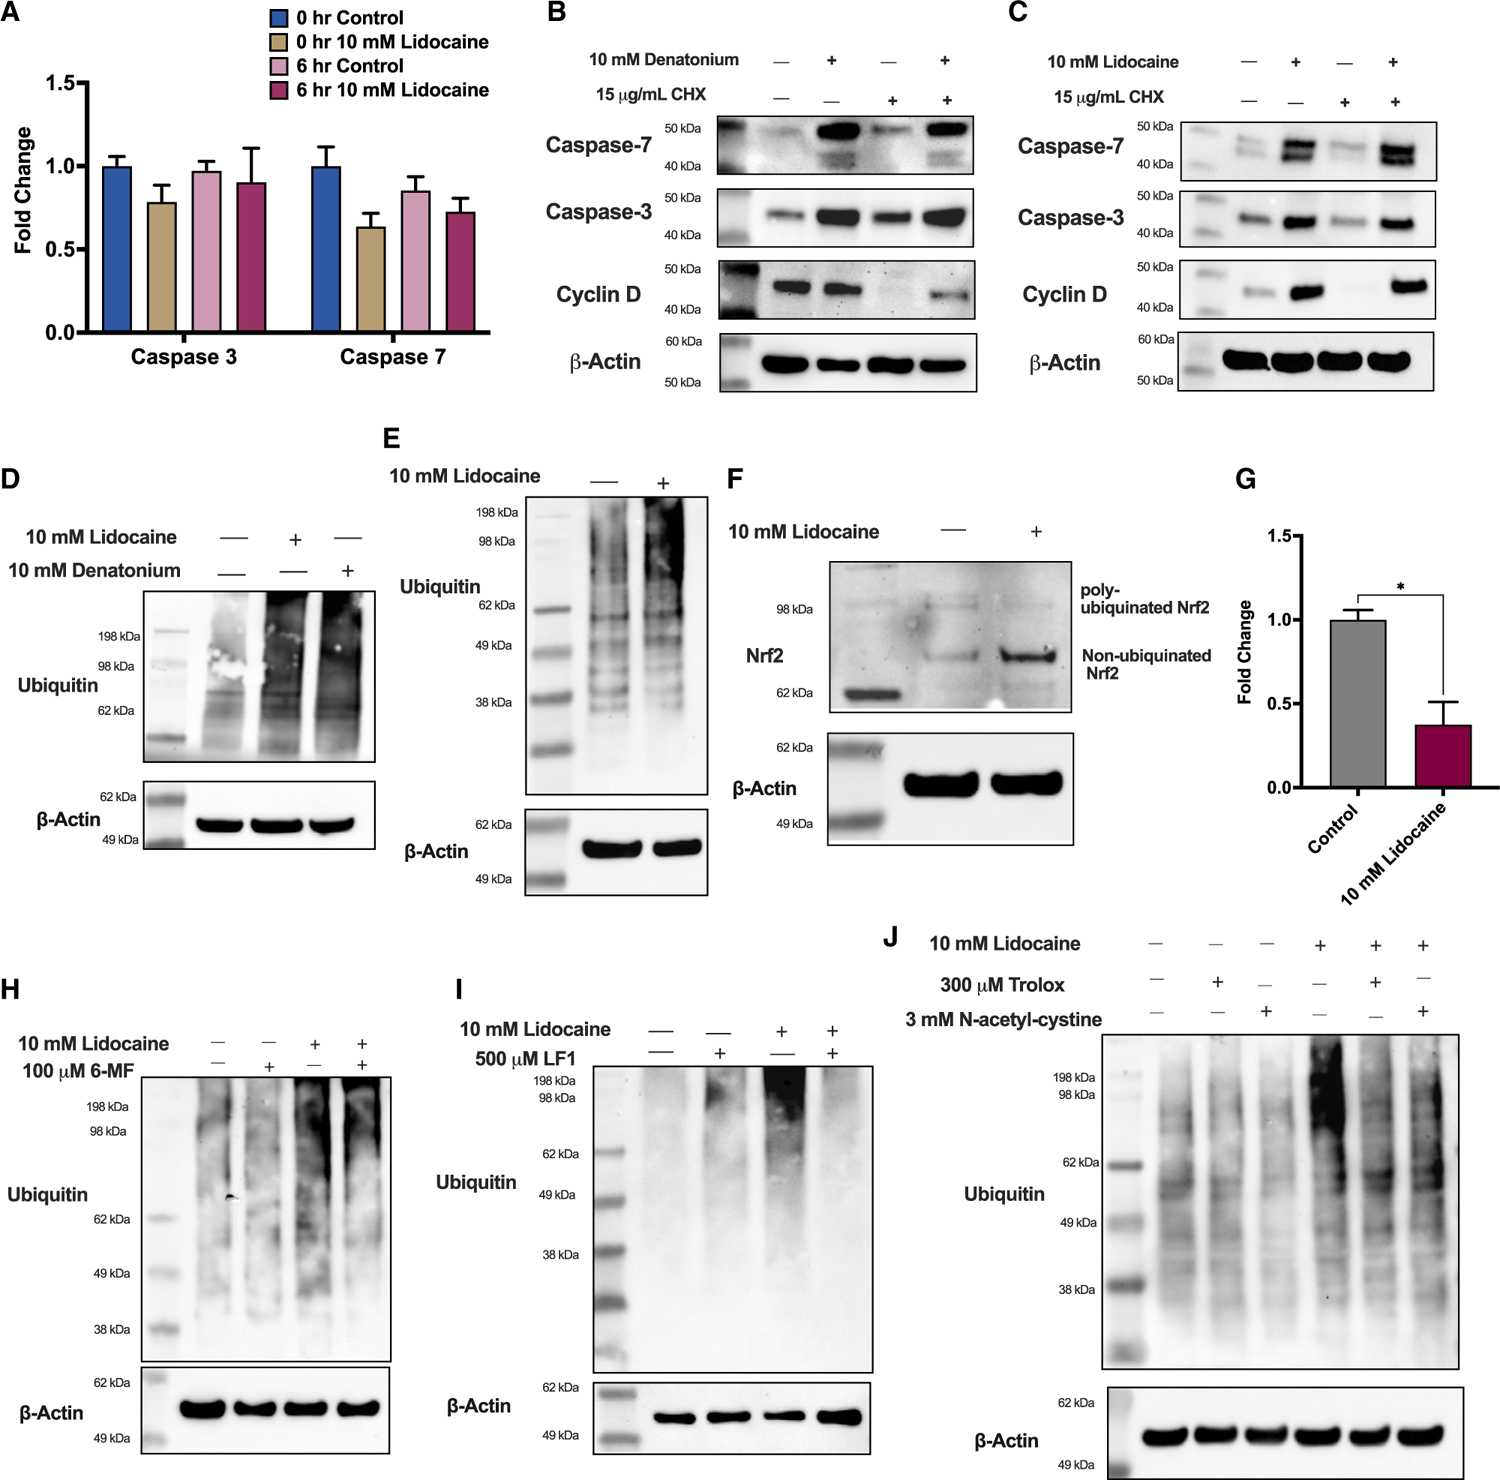
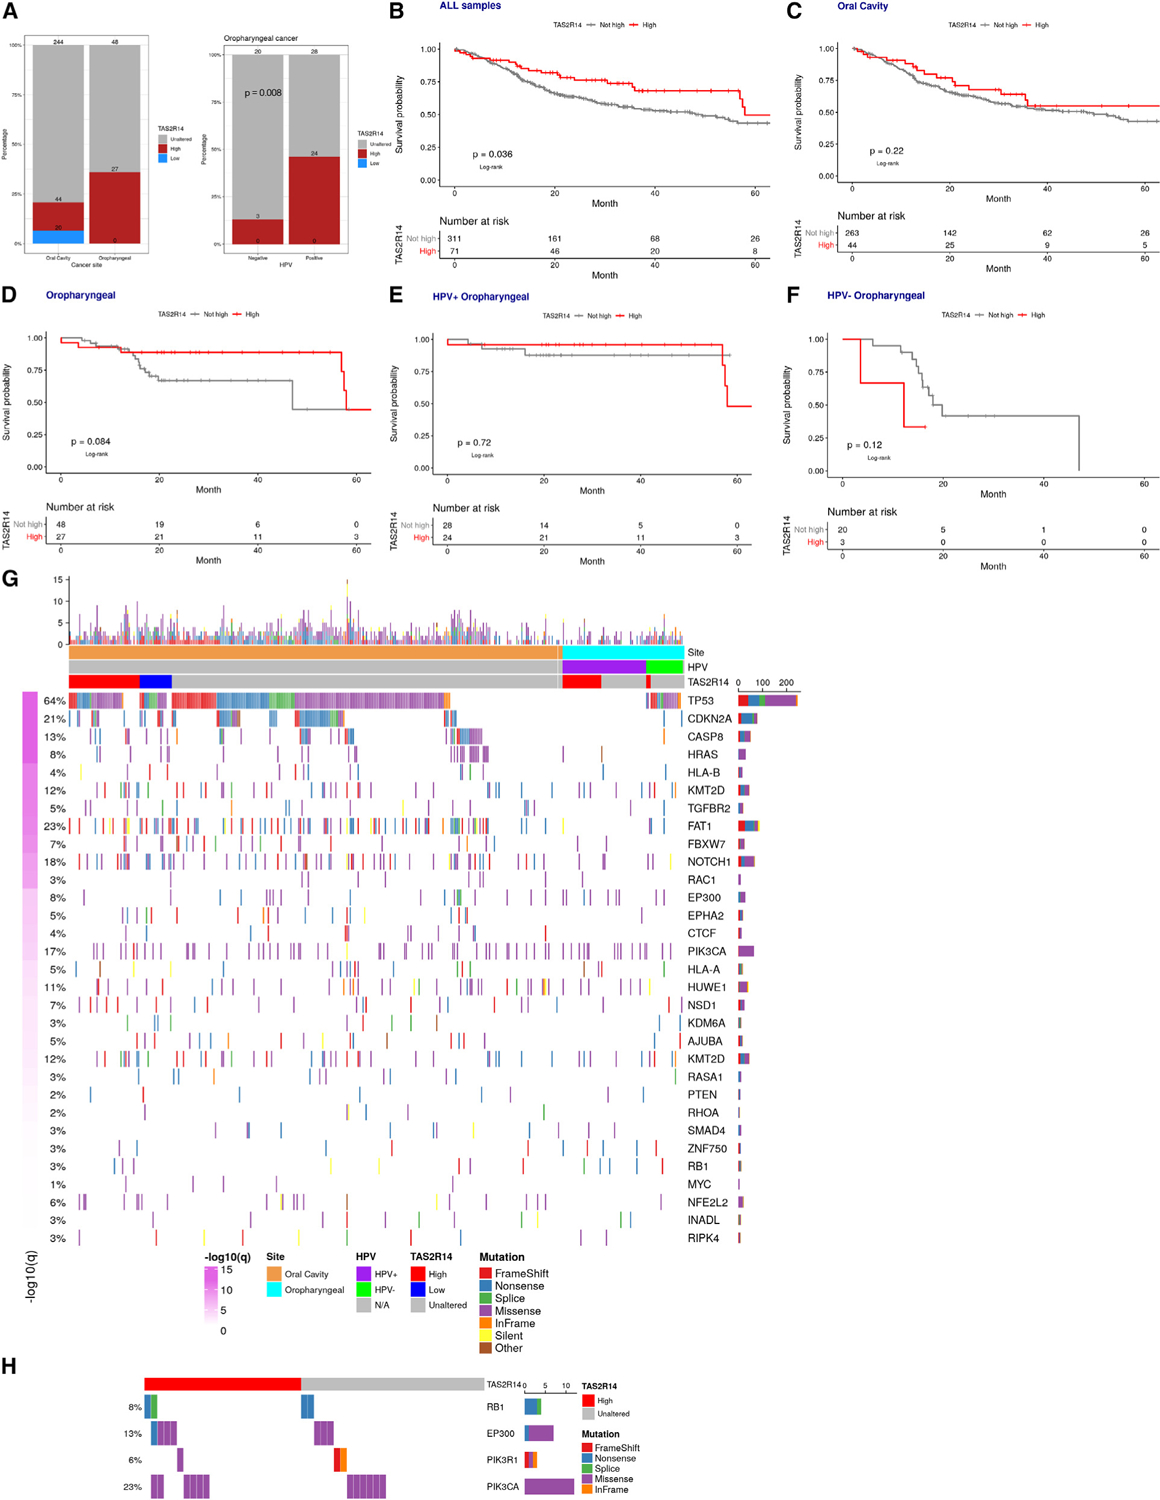
Head and neck squamous cell carcinomas (HNSCCs) have high mortality and significant treatment-related morbidity. It is vital to discover effective, minimally invasive therapies that improve survival and quality of life. Bitter taste receptors (T2Rs) are expressed in HNSCCs, and T2R activation can induce apoptosis. Lidocaine is a local anesthetic that also activates bitter taste receptor 14 (T2R14). Lidocaine has some anti-cancer effects, but the mechanisms are unclear. Here, we find that lidocaine causes intracellular Ca2+ mobilization through activation of T2R14 in HNSCC cells. T2R14 activation with lidocaine depolarizes mitochondria, inhibits proliferation, and induces apoptosis. Concomitant with mitochondrial Ca2+ influx, ROS production causes T2R14-dependent accumulation of poly-ubiquitinated proteins, suggesting that proteasome inhibition contributes to T2R14-induced apoptosis. Lidocaine may have therapeutic potential in HNSCCs as a topical gel or intratumor injection. In addition, we find that HPV-associated (HPV+) HNSCCs are associated with increased TAS2R14 expression. Lidocaine treatment may benefit these patients, warranting future clinical studies.

Keywords: CP: Cancer; G-protein-coupled receptor; HPV+; anesthetic; apoptosis; bitter agonist; calcium; chemosensory receptor; cyclic-AMP; ubiquitin-proteasome system.


Conflict of interest statement

Declaration of interests The authors declare no competing interests.

Figures

Figure 1.
Figure 1.. Lidocaine induces Ca2+ responses in HNSCC cells
HNSSC cell lines SCC47, FaDu, RPMI2650, SCC4, and SCC90 were imaged for Ca2+ responses with bitter agonists. (A and B) SCC47 Ca2+ response over time (A) and peak Ca2+ responses (B) with lidocaine; mean ± SEM with >3 experiments using separate cultures. Significance by one-way ANOVA with Bonferroni post-test comparing HBSS with each concentration of lidocaine. (C and D) SCC47 Ca2+ response over time (C) and peak Ca2+ responses (D) with denatonium benzoate; mean ± SEM with >3 experiments using separate cultures. Significance by one-way ANOVA with Bonferroni post-test comparing HBSS to each concentration of denatonium. (E) Ca2+ dose response of lidocaine in SCC47 cells. (F–H) SCC47 (F), FaDu (G), and RPMI2650 (H) peak Ca2+ responses with HBSS, lidocaine, denatonium benzoate, thujone, flufenamic acid (FFA), or ATP. Mean ± SEM with >3 experiments using separate cultures. Significance by one-way ANOVA with Bonferroni post-test comparing HBSS to each agonist. (I–K) SCC4 (I), SCC90 (J), and FaDu (K) peak fluorescent Ca2+ responses with lidocaine; mean ± SEM with >3 experiments using separate cultures. Significance by one-way ANOVA with Bonferroni post-test comparing HBSS to each concentration of lidocaine. (L) SCC47 peak Ca2+ response with lidocaine or procaine; mean ± SEM with >3 experiments using separate cultures. Significance by unpaired t test. *p < 0.05, **p < 0.01, ***p < 0.001; ns, no statistical significance.
Figure 2.
Figure 2.. Ca2+ response with lidocaine is due to intracellular Ca2+ release
SCC47 cells were loaded with Fluo-4 and imaged for subsequent Ca2+ responses with bitter agonists. (A and B) SCC47 Ca2+ trace (A) and peak Ca2+ (B) responses with lidocaine in HBSS ± extracellular Ca2+. Peak fluorescence mean ± SEM with >3 experiments using separate cultures. No significant difference by t test. (C) SCC47 peak Ca2+ response with nigericin stimulation in the presence or absence of extracellular Ca2+ and following stimulation with 10 mM lidocaine in the absence of extracellular Ca2+. Significance by one-way ANOVA with Bonferroni post-test comparing nigericin response to nigericin responses in Ca2+-free (–Ca2+) and post-lidocaine stimulation. (D–G) SCC47 cells were transfected with pcDNA-4mt3cpv (D and E) or pcDNA-D1ER (F and G) 24–48 h before Ca2+ imaging. (D and E) SCC47 mitochondrial (pcDNA-4mt3cpv) peak (mean ± SEM) (D) and representative trace (E) CFP/CFP-YFP fluorescence Ca2+ responses with HBSS, lidocaine or denatonium benzoate; >3 experiments using independent cultures. Significance by one-way ANOVA with Bonferroni post-test comparing HBSS to each agonist. (F and G) SCC47 ER (pcDNA-D1ER) change (F) and trace (G) of CFP/CFP-YFP fluorescence Ca2+ responses with lidocaine or denatonium benzoate. Peak fluorescence mean ± SEM with >3 experiments using separate cultures. Significance by one-way ANOVA with Bonferroni post-test comparing lidocaine to each concentration of denatonium. (H and I) SCC47 representative image of pcDNA-4mt3cpv (H) and pcDNA-D1ER CFP/YFP (I) baseline localization. Scale bar, 30 μm. (J) mRNA expression of ER Ca2+ channels in SCC47 relative to UBC. (K) SCC47 peak Ca2+ responses with 0–30 mM RyR agonist caffeine; mean ± SEM with >3 experiments using separate cultures. Significance by one-way ANOVA with Bonferroni post-test comparing HBSS to each concentration of caffeine. (L) SCC47 peak lidocaine Ca2+ responses ±1 h before ryanodine inhibition. Fluorescence means ± SEM with >3 separate cultures. No significant difference by unpaired t test. *p < 0.05, **p < 0.01, ***p < 0.001; ns, no statistical significance (or no indication).
Figure 3.
Figure 3.. Lidocaine increases intracellular Ca2+ through activation of T2R14
(A) SCC47 peak Ca2+ (left; mean ± SEM) and representative trace with 10 mM lidocaine ±1 h before incubation with 100 mM suramin; n > 3 experiments using separate cultures. Significance by t test. (B) SCC47 peak Ca2+ (left; mean ± SEM) and representative trace of lidocaine ±18 h before incubation with pertussis toxin or medium only; n > 3 experiments using separate cultures. Significance by t test. (C) SCC47 cells were transduced with fluorescent DAG biosensor and imaged for subsequent DAG responses with lidocaine. SCC47 peak DAG (left; mean ± SEM) and representative DAG trace (right) with HBSS or lidocaine; n ≥ 3 experiments using independent cultures. Significance by t test. (D) SCC47 cells were transfected with cAMP biosensor Flamindo2 and imaged for subsequent cAMP responses with HBSS, 10 mM lidocaine, or 100 μM isoproterenol. SCC47 peak cAMP response (left; mean ± SEM) and representative cAMP traces (right) with HBSS, 100 μM isoproterenol, or 10 mM lidocaine; n > 3 experiments using separate cultures. Significance by one-way ANOVA with Bonferroni’s post-test comparing each agonist to HBSS. (E) SCC47 peak Ca2+ responses with bitter agonists ±1 h before incubation with 6-methoxyflavanone (6-MF); mean ± SEM with >3 experiments using separate cultures. Significance by one-way ANOVA with Bonferroni’s post-test comparing each agonist ± 6-MF. (F) Representative images of SCC47 peak Ca2+ responses with lidocaine ± 6-MF. Scale bar, 30 μm. (G and H) SCC47 peak Ca2+ responses with lidocaine (G) or flufenamic acid (H) ±1 h before incubation with LF1. (I and J) SCC47 peak Ca2+ responses with lidocaine (I) or flufenamic acid (J) ±1 h before incubation with LF22; mean ± SEM with >3 separate independent cultures. Significance by unpaired t test. (K) T2R14 protein expression in SCC47 and SCC 4 cells via western blot (1:500 primary antibody). (L) T2R14 expression in SCC47 and FaDu cells via immunofluorescence stain with DAPI (nucleus) and phalloidin (actin) (1:100 primary antibody). *p < 0.05, **p < 0.01, ***p < 0.001l ns, no statistical significance (or no indication).
Figure 4.
Figure 4.. Lidocaine decreases cell viability and depolarizes the mitochondrial membrane
(A and B) SCC47 and FaDu cells were incubated with bitter agonists with XTT dye, an indicator of NADH production. A decrease in the difference of absorbance (475–660 nm) indicates reduced NADH production. (A) SCC47 and (B) FaDu XTT absorbance values (bar graphs, left) at 120 min of incubation with lidocaine or denatonium. Absorbance measured over 6 h as in representative traces on right. (C) SCC47 cells were loaded with fluorescent JC-1 dye 15 min before incubation with bitter agonists. An increase in FITC (dye monomers)/TRITC (dye aggregates) represents depolarized mitochondrial membrane potential. FaDu fluorescence green/red (FITC/TRITC channel emission ratio) ratio at 100 min of incubation with lidocaine (mean ± SEM on left, representative trace on right); >3 separate cultures. Significance by one-way ANOVA with Bonferroni post-test comparing media to each concentration of lidocaine. (D) FaDu representative images of change in red dye aggregates (indicative of loss of mitochondrial membrane potential) with lidocaine. (E) SCC47 cells were treated with lidocaine for 3 h and then loaded with MitoSox superoxide indicator dye. SCC47 MitoSox fluorescence values at 3 h post stimulation, mean ± SEM with >3 separate cultures. Significance by one-way ANOVA with Bonferroni post-test comparing medium to each concentration of lidocaine. (F) SCC47 representative images of MitoSox fluorescence post-lidocaine. Scale bars, 30 μm. *p < 0.05, **p < 0.01, ***p < 0.001; ns, no statistical significance (or no indication).
Figure 5.
Figure 5.. Lidocaine induces apoptosis via T2R14
(A) SCC47 CellEvent (caspase-3 and -7 indicator) fluorescence at 4 h (mean ± SEM) with lidocaine (left) and representative trace of CellEvent fluorescence over 12 h with 10 mM lidocaine; n > 3 separate cultures on independent days. Significance determined by one-way ANOVA with Bonferroni post-test between control and lidocaine-treated cells. (B) SCC47 representative images of CellEvent caspase cleavage at 0 and 12 h with lidocaine. (C) SCC47 cells were treated with 10 mM lidocaine for 0–6 h. Caspase-3, caspase-7, and β-actin primary antibody (1:1,000) were used with goat anti-rabbit or anti-mouse IgG-horseradish peroxidase secondary antibodies (1:1,000). Immunoblots representative of 3 independent experiments using cells at different passage number on different days. (D) SCC47 CellEvent fluorescence (peak mean ± SEM on left and representative trace on right) at 10 h with 10 mM lidocaine ± 100 μM 6-MF. Significance was determined by unpaired t test. (E) SCC47 cells were treated with 10 mM lidocaine for 6 h. Bax and β-actin primary antibody (1:1,000) were used with goat anti-rabbit or anti-mouse IgG-horseradish peroxidase secondary antibodies (1:1,000). Immunoblots representative of 3 independent experiments using cells at different passage numbers on different days. (F) FaDu CellEvent fluorescence (peak mean ± SEM on left and representative trace on right) at 10 h with lidocaine ± 6-MF. Significance determined by unpaired t test. (G) Representative SCC47 images of DIC cell morphology with lidocaine. Scale bars, 30 μm. Representative of 3 independent experiments using cells at different passage number on different days. (H) Representative DIC and CellEvent (green FITC fluorescence channel) images in SCC47 cells with lidocaine ± 100 μM 6-MF. Scale bars, 30 μm. Representative of 3 independent experiments using cells at different passage number on different days. *p < 0.05, **p < 0.01, ***p < 0.001; ns, no statistical significance (or no indication).
Figure 6.
Figure 6.. Lidocaine inhibits the proteasome via T2R14
(A) SCC47 caspase-3 (CASP3) and caspase-7 (CASP7) mRNA expression ± lidocaine. Expression shown relative to 0 h control. Mean ± SEM with >3 separate cultures. No significance difference by paired t test. (B and C) SCC47 cells were treated with (B) denatonium benzoate or (C) lidocaine for 6 h with or without 15 μg/mL cycloheximide (CHX). Caspase-3, caspase-7, cyclin D (cycloheximide protein synthesis control), and β-actin primary antibody (1:1,000) were used with goat anti-rabbit or anti-mouse IgG-horseradish peroxidase secondary antibodies (1:1,000). (D and E) SCC47 cells (D) and FaDu cells (E) were treated with 10 mM lidocaine for 6 h. Ubiquitin and β-actin primary antibody (1:1,000) were used with anti-rabbit or anti-mouse IgG-horseradish peroxidase secondary antibodies (1:1,000). (F) SCC47 cells were treated with 10 mM lidocaine for 6 h. Nrf2 and β-actin primary antibody (1:1,000) were used with anti-rabbit or anti-mouse IgG-horseradish peroxidase secondary antibodies (1:1,000). (G) mRNA expression of FOXM1 in SCC47 cells after treatment with lidocaine for 6 h. Expression is relative to control/untreated. Mean ± SEM with >3 separate cultures. Significance determined by paired t test. (H and I) SCC47 cells were treated with lidocaine ± 6-MF (H) or LF1 (I) for 6 h. Ubiquitin and β-actin primary antibody (1:1,000) were used with anti-rabbit or anti-mouse IgG-horseradish peroxidase secondary antibodies (1:1,000). Immunoblots shown are representative of 3 independent experiments using cells at different passage number on different days. (J) SCC47 cells were treated with lidocaine ± Trolox or n-acetyl-L-cysteine for 6 h. Ubiquitin and β-actin primary antibody (1:1,000) were used with anti-rabbit or anti-mouse IgG-horseradish peroxidase secondary antibodies (1:1,000). All immunoblots shown are representative of ≥3 independent experiments using cells at different passage number on different days. *p < 0.05, **p < 0.01, ***p < 0.001; ns, no statistical significance (or no indication).
Figure 7.
Figure 7.. TAS2R14 expression is associated with HPV+ status
The Cancer Genome Atlas was used to compare TAS2R14 expression between tumor and adjacent normal tissue in 383 cases of squamous cell carcinoma of the oral cavity (n = 308) and oropharynx (n = 75 including 52 HPV+ and 23 HPV−). (A) High expression was more prevalent in oropharynx tumors, representing 36% overall, 46% in HPV+, and 13% in HPV−. High TAS2R14 expression was associated with HPV+ status (OR = 5.6, p = 0.008 by Fisher’s exact test). (B–F) Kaplan Meier analyses of overall survival were performed with log rank tests for comparisons between patients with high TAS2R14 expression and those without high TAS2R14 expression (labeled “not high”). (B) For all oral cavity and oropharyngeal tumors, high TAS2R14 expression was associated with improved OS compared with those without high expression (p = 0.036). Separate OS analyses of high and not high expression groups in (C) oral cavity, (D) oropharyngeal, (E) HPV+ oropharyngeal, and (F) HPV− oropharyngeal were not statistically significant. (G and H) Mutational analysis was performed to identify the most frequently mutated genes in (G) all oral cavity and oropharynx tumors and specifically for (H) HPV+ oropharyngeal tumors (columns represent individual patients, n = 52). Significantly mutated genes (rows, ordered by significance) were identified using the MutSig2CV algorithm with a q value < 0.1. Color coding indicates mutation type. HPV+ tumors showed no differences in the number of samples with mutations in the identified genes between the high and not high TAS2R14 expression groups by Fisher’s exact test.

Similar articles

Cited by

References

    1. Johnson DE, Burtness B, Leemans CR, Lui VWY, Bauman JE, and Grandis JR (2020). Head and neck squamous cell carcinoma. Nat. Rev. Dis. Primers 6, 92. - PMC - PubMed
    1. Solomon B, Young RJ, and Rischin D (2018). Head and neck squamous cell carcinoma: Genomics and emerging biomarkers for immunomodulatory cancer treatments. Semin. Cancer Biol 52, 228–240. - PubMed
    1. Jethwa AR, and Khariwala SS (2017). Tobacco-related carcinogenesis in head and neck cancer. Cancer Metastasis Rev. 36, 411–423. - PMC - PubMed
    1. Kawakita D, and Matsuo K (2017). Alcohol and head and neck cancer. Cancer Metastasis Rev. 36, 425–434. - PubMed
    1. Hannen EJM, and Riediger D (2004). The quantification of angiogenesis in relation to metastasis in oral cancer: a review. Int. J. Oral Maxillofac. Surg 33, 2–7. - PubMed

Publication types