. 2023 Dec 18;58(24):3028-3047.e12.
doi: 10.1016/j.devcel.2023.11.001. Epub 2023 Nov 22.

Single-cell analysis of shared signatures and transcriptional diversity during zebrafish development

Affiliations

Single-cell analysis of shared signatures and transcriptional diversity during zebrafish development

Abhinav Sur et al. Dev Cell. .

Abstract

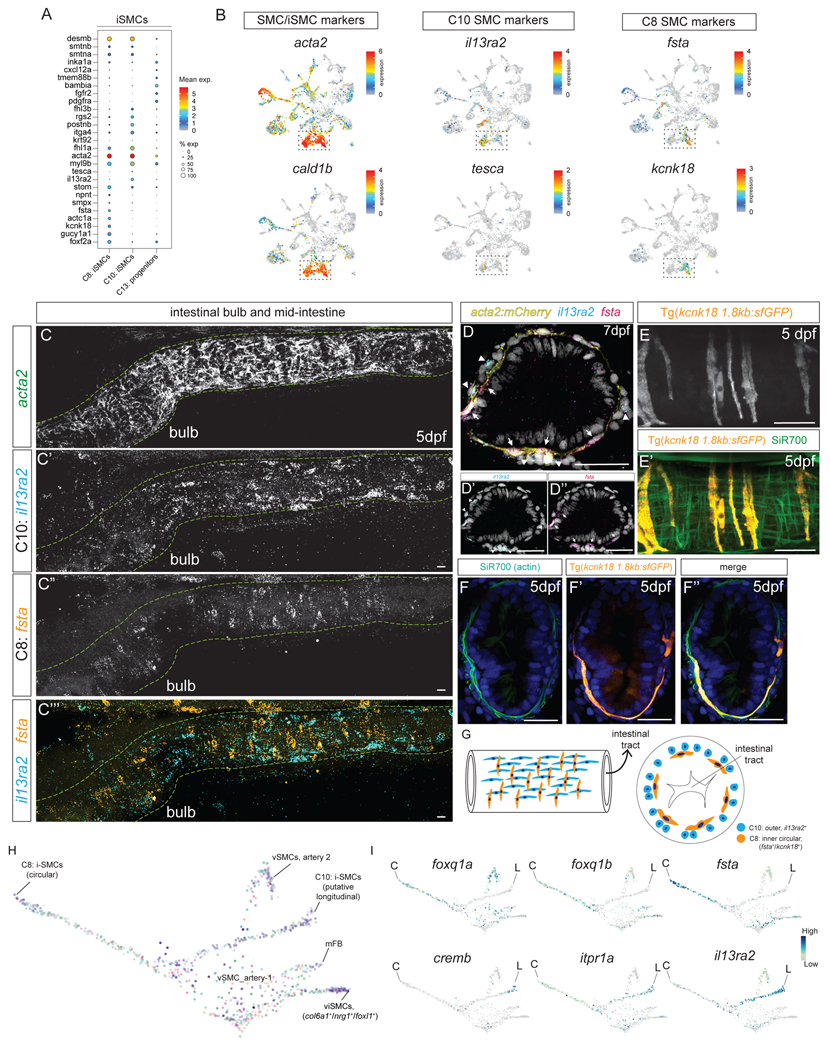
During development, animals generate distinct cell populations with specific identities, functions, and morphologies. We mapped transcriptionally distinct populations across 489,686 cells from 62 stages during wild-type zebrafish embryogenesis and early larval development (3-120 h post-fertilization). Using these data, we identified the limited catalog of gene expression programs reused across multiple tissues and their cell-type-specific adaptations. We also determined the duration each transcriptional state is present during development and identify unexpected long-term cycling populations. Focused clustering and transcriptional trajectory analyses of non-skeletal muscle and endoderm identified transcriptional profiles and candidate transcriptional regulators of understudied cell types and subpopulations, including the pneumatic duct, individual intestinal smooth muscle layers, spatially distinct pericyte subpopulations, and recently discovered best4+ cells. To enable additional discoveries, we make this comprehensive transcriptional atlas of early zebrafish development available through our website, Daniocell.

Keywords: best4; developmental biology; gene module; intestinal smooth muscle; pericyte; pneumatic duct; single-cell RNA-seq; zebrafish.


Conflict of interest statement

Declaration of interests The authors declare no competing interests.

Figures

Figure 1:
Figure 1:. A high temporal resolution single-cell RNAseq timecourse encompassing embryogenesis and early larval development.
(A) Developmental stages (colored dots) from which single-cell transcriptomes were collected. (B–C) UMAP projection of single-cell transcriptomes, colored by (B) developmental stage (as in Figure 1A) and (C) curated major tissues. (D) Expression pattern specificity for each gene. Genes were categorized by thresholding (dotted lines) based on their coefficient of variation (CV) of cluster mean expression (log-transformed) and number of cell types expressing each gene. (E) Example gene expression patterns for different expression specificity categories. (F) Comparison of temporal (X-axis) and cell-type (Y-axis) expression variation for each gene. See also Figure S1, Tables S1–S3.
Figure 2:
Figure 2:. Duration of transcriptional states during development.
(A) Schematic of approach to identify transcriptionally similar cells by epsilon (ε) neighborhood, determine similarity of developmental stage to transcriptionally similar cells, and categorize into ‘short-term’ or ‘long-term’ states. (B) UMAP projection colored by categorization as cycling or non-cycling and ‘short-term’ or ‘long-term’. Populations of transcriptionally similar proliferating cells found for ≥24 hours are labeled. (C–E) Cells, colored by stage (left) or gene expression (right) indicate how different developmental stages and transcriptional states align with cycling, non-cycling, ‘short-term’, and ‘long-term’ categorizations in transcriptionally stable, terminally differentiating (C, fast muscle), transcriptionally changing but non-cycling (D, intestine), and classical long-term progenitor populations (E, radial glia). (F) Timeline bar plots showing the duration of ‘long-term’ cycling cell states. Each bar represents a cell population and the length of bar represents the minimum timespan that encompasses 80% of its ε-neighbors. (G–I) Cells represented as in panels C–E for uncharacterized, putative long-term cycling populations. In panels C–E, and G–I, dashed lines mark thresholds for cycling (blue) and ‘long-term’ (red). See also Figure S2, Table S4.
Figure 3:
Figure 3:. Identification of reused gene expression programs.
(A) Binary heatmap showing expression domains of gene expression programs (“GEPs”, x-axis with select annotations) shared by cell types in multiple tissues (y-axis). Table S5 contains full GEP annotations. (B) Gene expression dot plot of megalin-associated and SLC transporter genes shared between intestinal lysosome-rich enterocytes (“LREs”) and pronephros proximal convoluted and straight tubules (“PCT” and “PST”). SLC transporter genes are colored according to the family/category they belong to. (C) Dot plot of top-loaded genes from five epithelial GEPs: one shared across all epithelia, two comprising classical epithelial genes, and two tissue-specific. X-axis: cell types with epithelial characteristics and muscle as a non-epithelial comparison. (D) Dot plot of shared and tissue-specific members of module GEP-94, associated with mucin O-glycosylation. RPE: retinal pigmented epithelium; EVL: enveloping layer. See also Figure S3, Table S5.
Figure 4:
Figure 4:. Subclustering of non-skeletal muscle identifies distinct pericyte subtypes.
(A) UMAP projection of 3,866 non-skeletal muscle cells, numbered and color-coded by cluster. Populations further analyzed are highlighted with dotted circles (pericytes, Figure 4) and boxes (smooth muscle, Figure 5). (B) Selected differentially expressed pericyte-specific markers (x-axis) compared to vascular (vaSMCs) and visceral SMCs (viSMCs). (C) Selected differentially expressed genes (y-axis) between the three pericyte clusters (x-axis, P0–P2) and myofibroblasts compared to vascular SMCs (x-axis, vaSMCs). See Figure S4C for additional markers. (D) Expression of pericyte marker genes. (E–E’) Proportion of adma+ (E) and epas1a+ (E’) cells across the three pericyte clusters (C9, C20 and C4) (n = 172, 79, and 27 cells respectively). (F–H”) RNA in situ hybridization for ndufa4l2a (general pericyte marker) and epas1a (pericyte-2 specific marker) with immunofluorescent vascular co-stain (flk:mCherry-CAAX). Panels F–F’’: lateral view of the whole zebrafish head, G–H’’ higher magnification of hindbrain posterior cerebral vein (PCeV) with 3 (G–G”) or 1 (H–H”) epas1a+ pericyte(s). Arrows: ndufa4l2a+/epas1a+ pericytes near PCeV, arrowheads: ndufa4l2a+/epas1a pericytes near other hindbrain vessels, asterisks: autofluorescent red blood cells. (I) Number of ndufa4l2a+/epas1a+ pericytes per animal visible near the PCeV in a similar-sized field of view (n = 35). (J–L) RNA in situ hybridization does not identify ndufa4l2a+/epas1a+ cells near other blood vessels in the forebrain (J), eye (K), and pharyngeal arches (L). Arrowheads mark ndufa4l2a+ cells; no ndufa4l2a+/epas1a+ cells were observed in these regions. (M) Proportion of ndufa4l2a+ pericytes that were also epas1a+ in different regions of the zebrafish head (n = 17). Error bars indicate standard error of mean (S.E.M). Scale bar: 25 μm. See also Figures S4–S5.
Figure 5:
Figure 5:. Distinct gene expression within intestinal smooth muscle cell (SMC) subtypes.
(A) Top differentially expressed genes (y-axis) between intestinal SMC clusters (x-axis). (B–D) Expression of common (acta2, cald1b) and differentially expressed (il13ra2, tesca, fsta, kcnk18) intestinal SMC markers. (C–D) RNA in situ hybridization for intestinal SMC cluster-specific markers (il13ra2 and fsta) with general smooth muscle co-stain (C: acta2 in situ, D: acta2:mCherry immunofluorescence) in lateral (C) or transverse (D) view. Arrows indicate fsta+ cells (pink) and arrowheads indicate il13ra2+ cells (cyan). (E–F) Mosaic F0 transgenic labeling of C8 iSMCs with injected Tg(kcnk18 1.8kb:sfGFP) construct and SiR700 actin co-stain in lateral (E) and transverse (F) orientations (images representative of 15 fluorescence-positive larvae chosen at random). (G) Diagram of proposed longitudinal and circular intestinal SMC identities for C8 and C10. (H–I) Force-directed layout of URD-inferred transcriptional trajectory calculated on foxc1a/b and prrx1a/b (putatively non-neural crest derived) SMCs and myofibroblasts, colored by stage (H, as in Figure 1A) or gene expression (I). C: circular SMCs; L: putative longitudinal SMCs. Scale bar: 25 μm. See also Figures S6–S7.
Figure 6:
Figure 6:. Subclustering of endodermal derivatives enables molecular characterization of pneumatic duct and best4+ cells.
(A) UMAP projection of 12,592 endodermal cells, color coded and numbered by cluster. (B) Expression of specific (sftpba, sim1b) and strongly expressed (mnx1, ihha) pneumatic duct markers. (C) Top differentially expressed pneumatic duct markers (y-axis), compared to other endodermal derivatives (x-axis). (D–E”) RNA in situ hybridization for two specific pneumatic duct (pd) markers (sftpba and sim1b, D) and a swim bladder (sb) marker (slc16a3b, E). Yellow arrowhead: pneumatic duct, white arrow: anterior swim bladder bud primordium that inflates at 21 dpf. (F) Top differentially expressed markers (y-axis) in best4+ cells compared to other intestinal cell types. (G) Expression of general intestinal marker (cdx1b) and two best4+ cell markers (best4 and otop2). White arrowhead: otop2 expression in LREs, yellow arrowhead: expression within the best4+ cells. (H) RNA in situ hybridization for best4 and otop2. Arrowheads as in G. Scale bar: 50 μm. EC: enterocyte; prog: progenitors; LREs: lysosome-rich enterocytes; EECs: enteroendocrine cells. See also Figure S8.
Figure 7:
Figure 7:. Transcriptional trajectory analysis of zebrafish best4+ cells and comparison to human counterparts.
(A) Transcriptome correlation between adult human colon (x-axis) and larval zebrafish intestinal cell types, based on markers of all intestinal cell types. (B) Average log-fold enrichment of genes in best4+ cells compared to other intestinal cells in adult human colon and small intestine (x-axis, highest enrichment in either tissue) and larval zebrafish intestines (y-axis). Genes colored black are shared, blue are human-specific, and red are zebrafish-specific best4+ cell markers. Figures S9 contains comparisons to colon and small intestine individually. (C) Number of genes shared between the whole transcriptome of best4+ cells in human colon, human small intestine, and zebrafish larval intestine. (D–E) Force-directed layout of an URD-inferred transcriptional trajectory of zebrafish intestinal cells colored by developmental stage (D) and gene expression (E). (F) Temporal dynamics of selected genes along the best4+ cell cascade. (G–H’’) RNA in situ hybridization of best4 and candidate transcriptional regulator pbx3a in a 5 dpf zebrafish intestine. Scale bar – 100 μm. (I) Temporal dynamics of selected genes along the posterior LRE cascade. In panels F and I, X-axis: pseudotime, Y-axis: scaled expression. See also Figures S9–S10, Table S6.

Update of

References

    1. Briggs JA, Weinreb C, Wagner DE, Megason S, Peshkin L, Kirschner MW, and Klein AM (2018). The dynamics of gene expression in vertebrate embryogenesis at single-cell resolution. Science 360. 10.1126/science.aar5780. - DOI - PMC - PubMed
    1. Farrell JA, Wang Y, Riesenfeld SJ, Shekhar K, Regev A, and Schier AF (2018). Single-cell reconstruction of developmental trajectories during zebrafish embryogenesis. Science 360. 10.1126/science.aar3131. - DOI - PMC - PubMed
    1. Siebert S, Farrell JA, Cazet JF, Abeykoon Y, Primack AS, Schnitzler CE, and Juliano CE (2019). Stem cell differentiation trajectories in Hydra resolved at single-cell resolution. Science 365. 10.1126/science.aav9314. - DOI - PMC - PubMed
    1. Cao C, Lemaire LA, Wang W, Yoon PH, Choi YA, Parsons LR, Matese JC, Wang W, Levine M, and Chen K. (2019). Comprehensive single-cell transcriptome lineages of a proto-vertebrate. Nature 571, 349–354. 10.1038/s41586-019-1385-y. - DOI - PMC - PubMed
    1. Fincher CT, Wurtzel O, de Hoog T, Kravarik KM, and Reddien PW (2018). Cell type transcriptome atlas for the planarian Schmidtea mediterranea. Science 360. 10.1126/science.aaq1736. - DOI - PMC - PubMed

Publication types

LinkOut - more resources