. 2024 Feb 7;112(3):384-403.e8.
doi: 10.1016/j.neuron.2023.10.023. Epub 2023 Nov 22.

Amelioration of Tau and ApoE4-linked glial lipid accumulation and neurodegeneration with an LXR agonist

Affiliations

Amelioration of Tau and ApoE4-linked glial lipid accumulation and neurodegeneration with an LXR agonist

Alexandra Litvinchuk et al. Neuron. .

Erratum in

Abstract

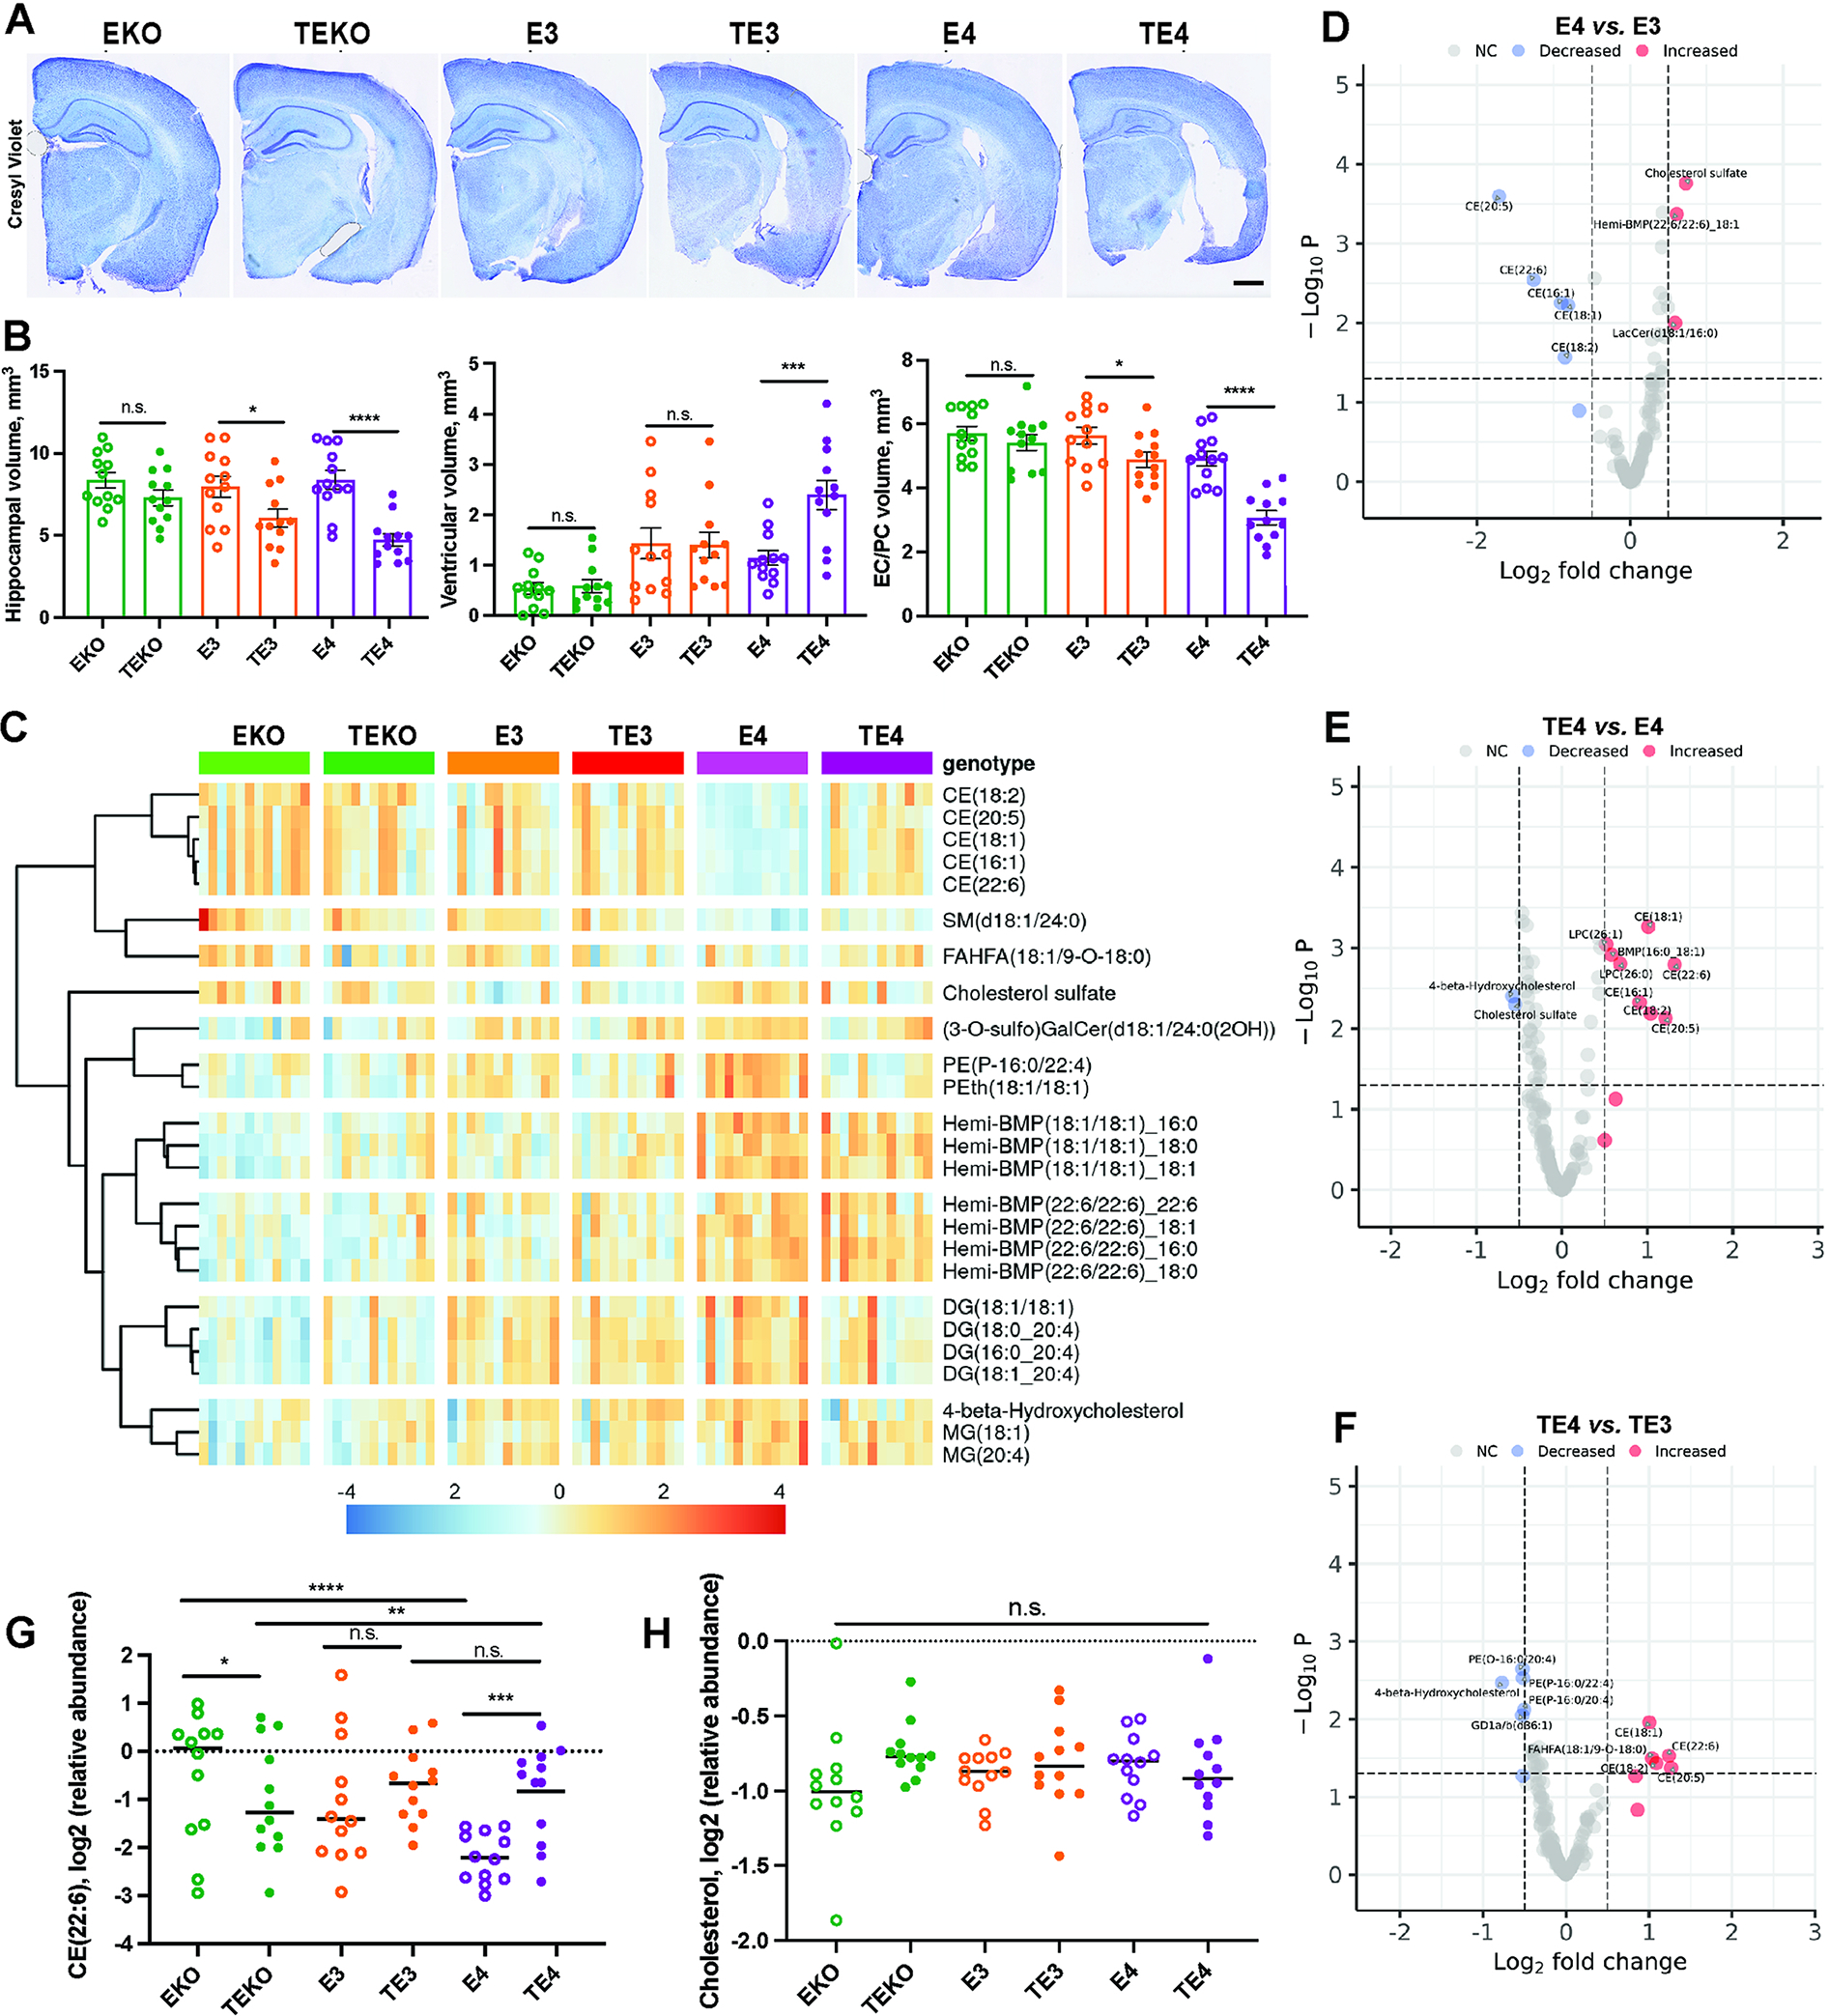
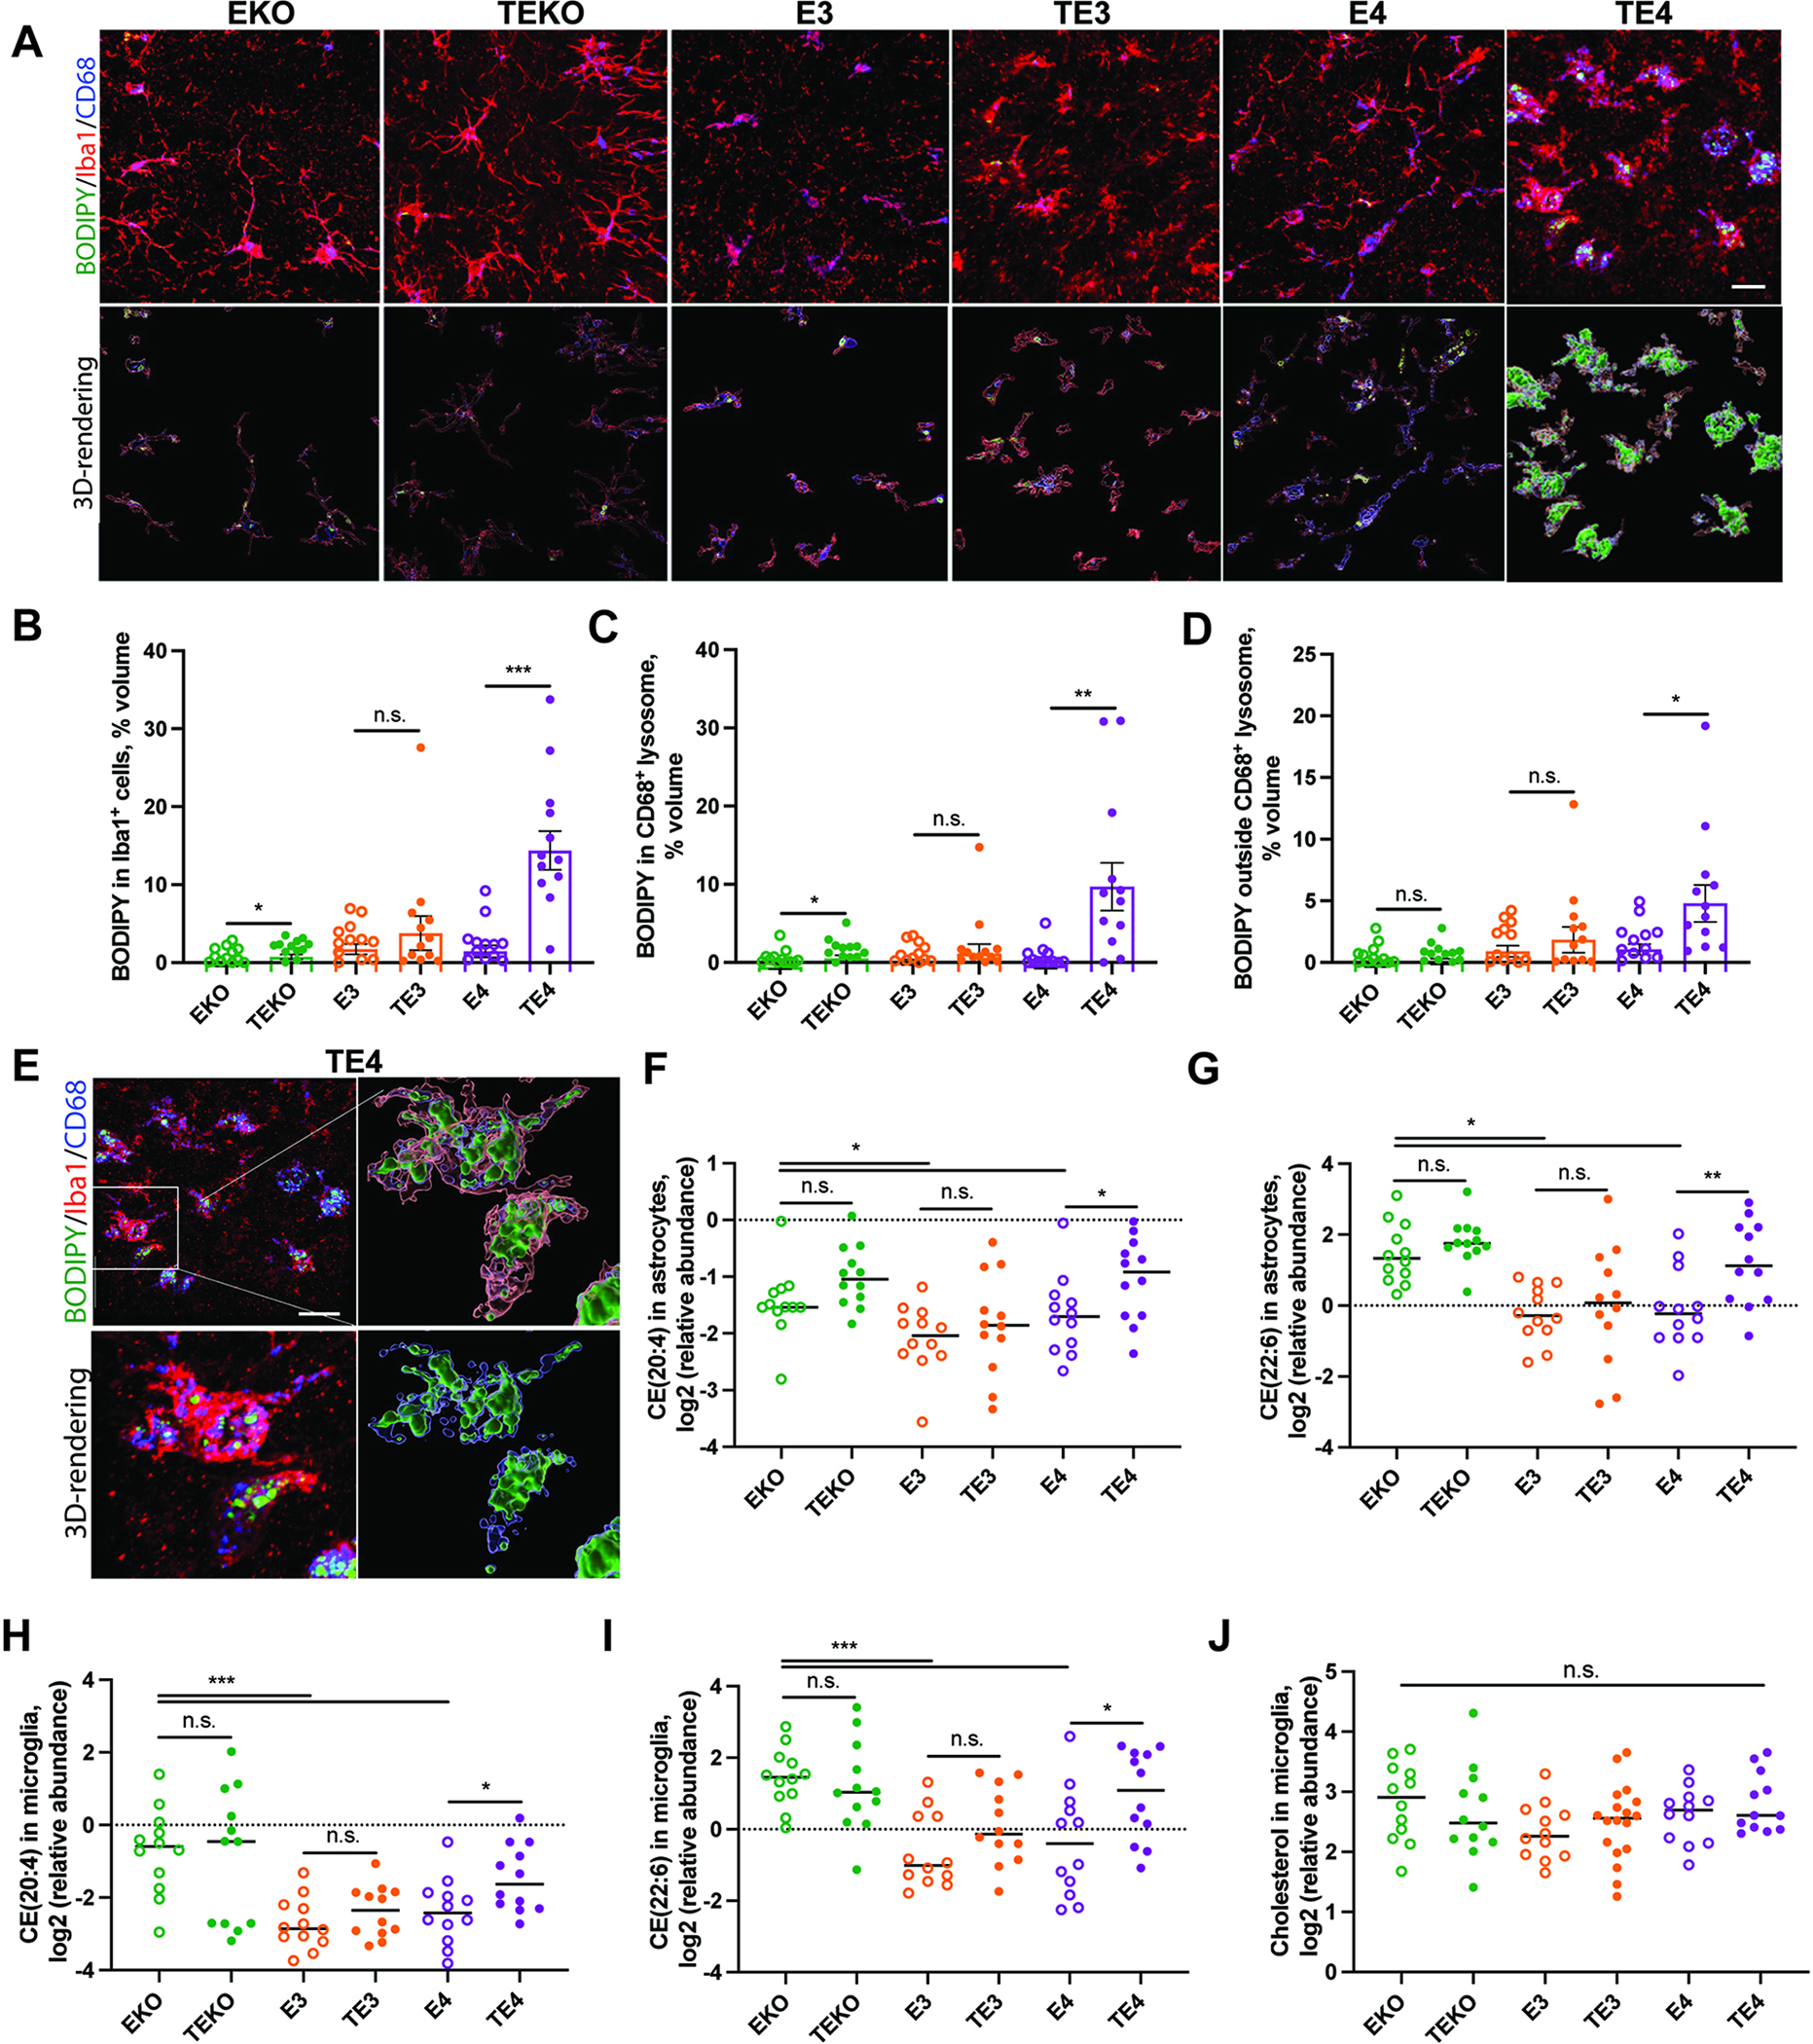
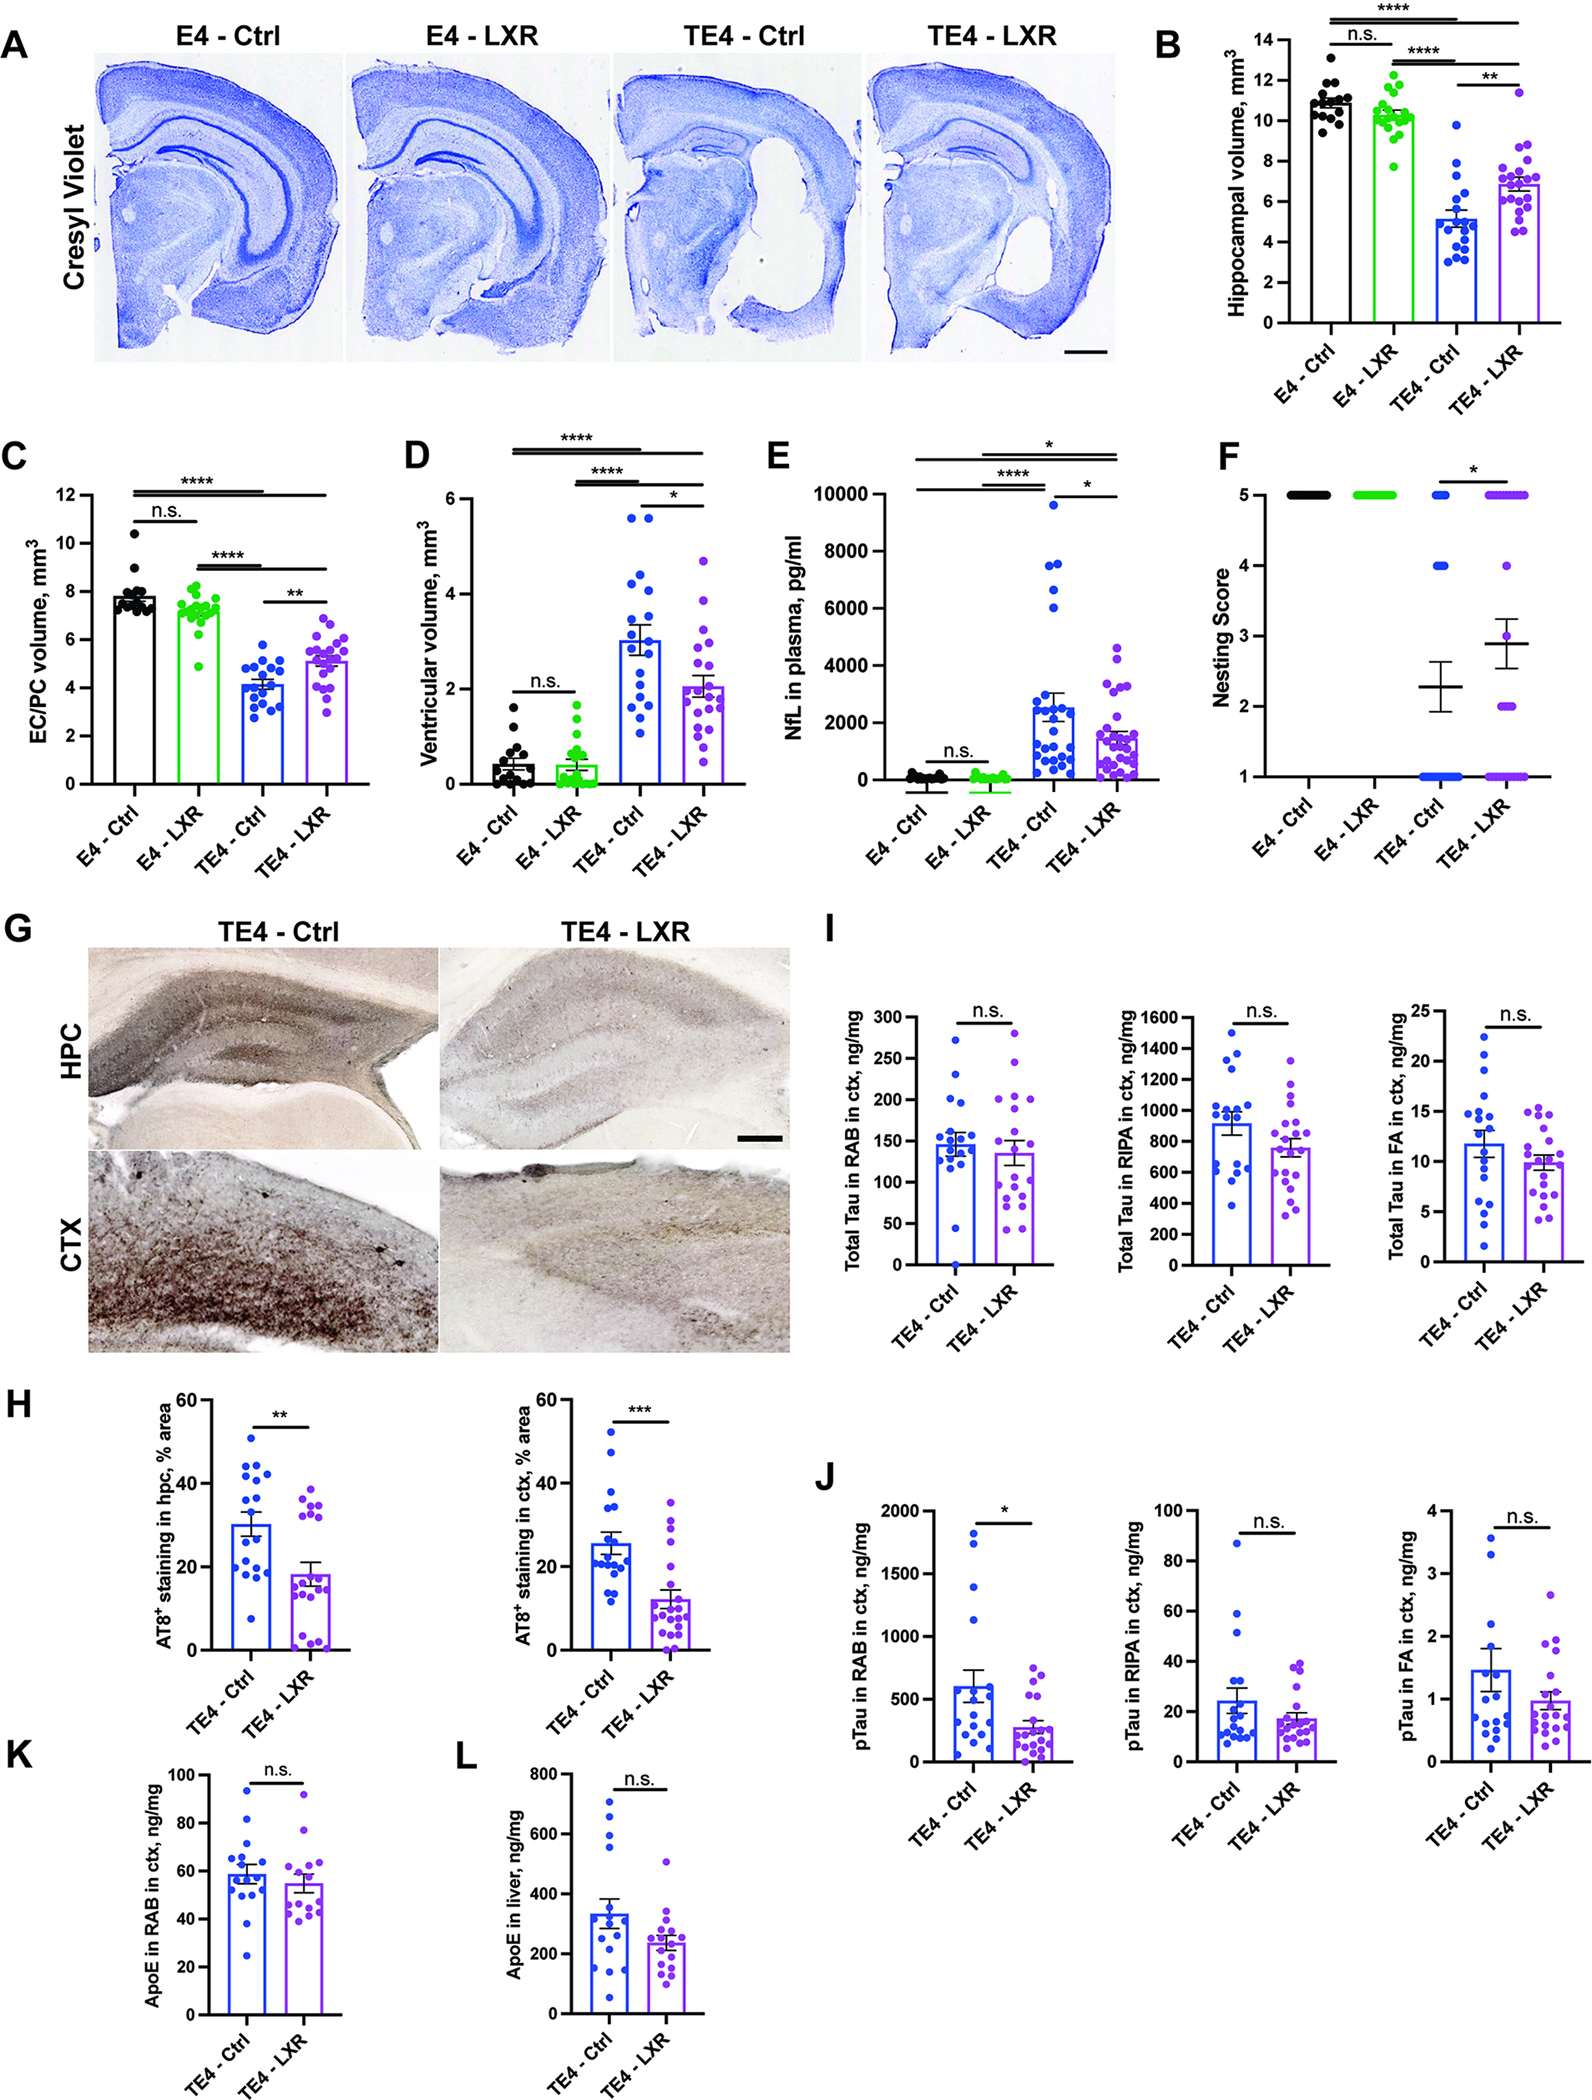
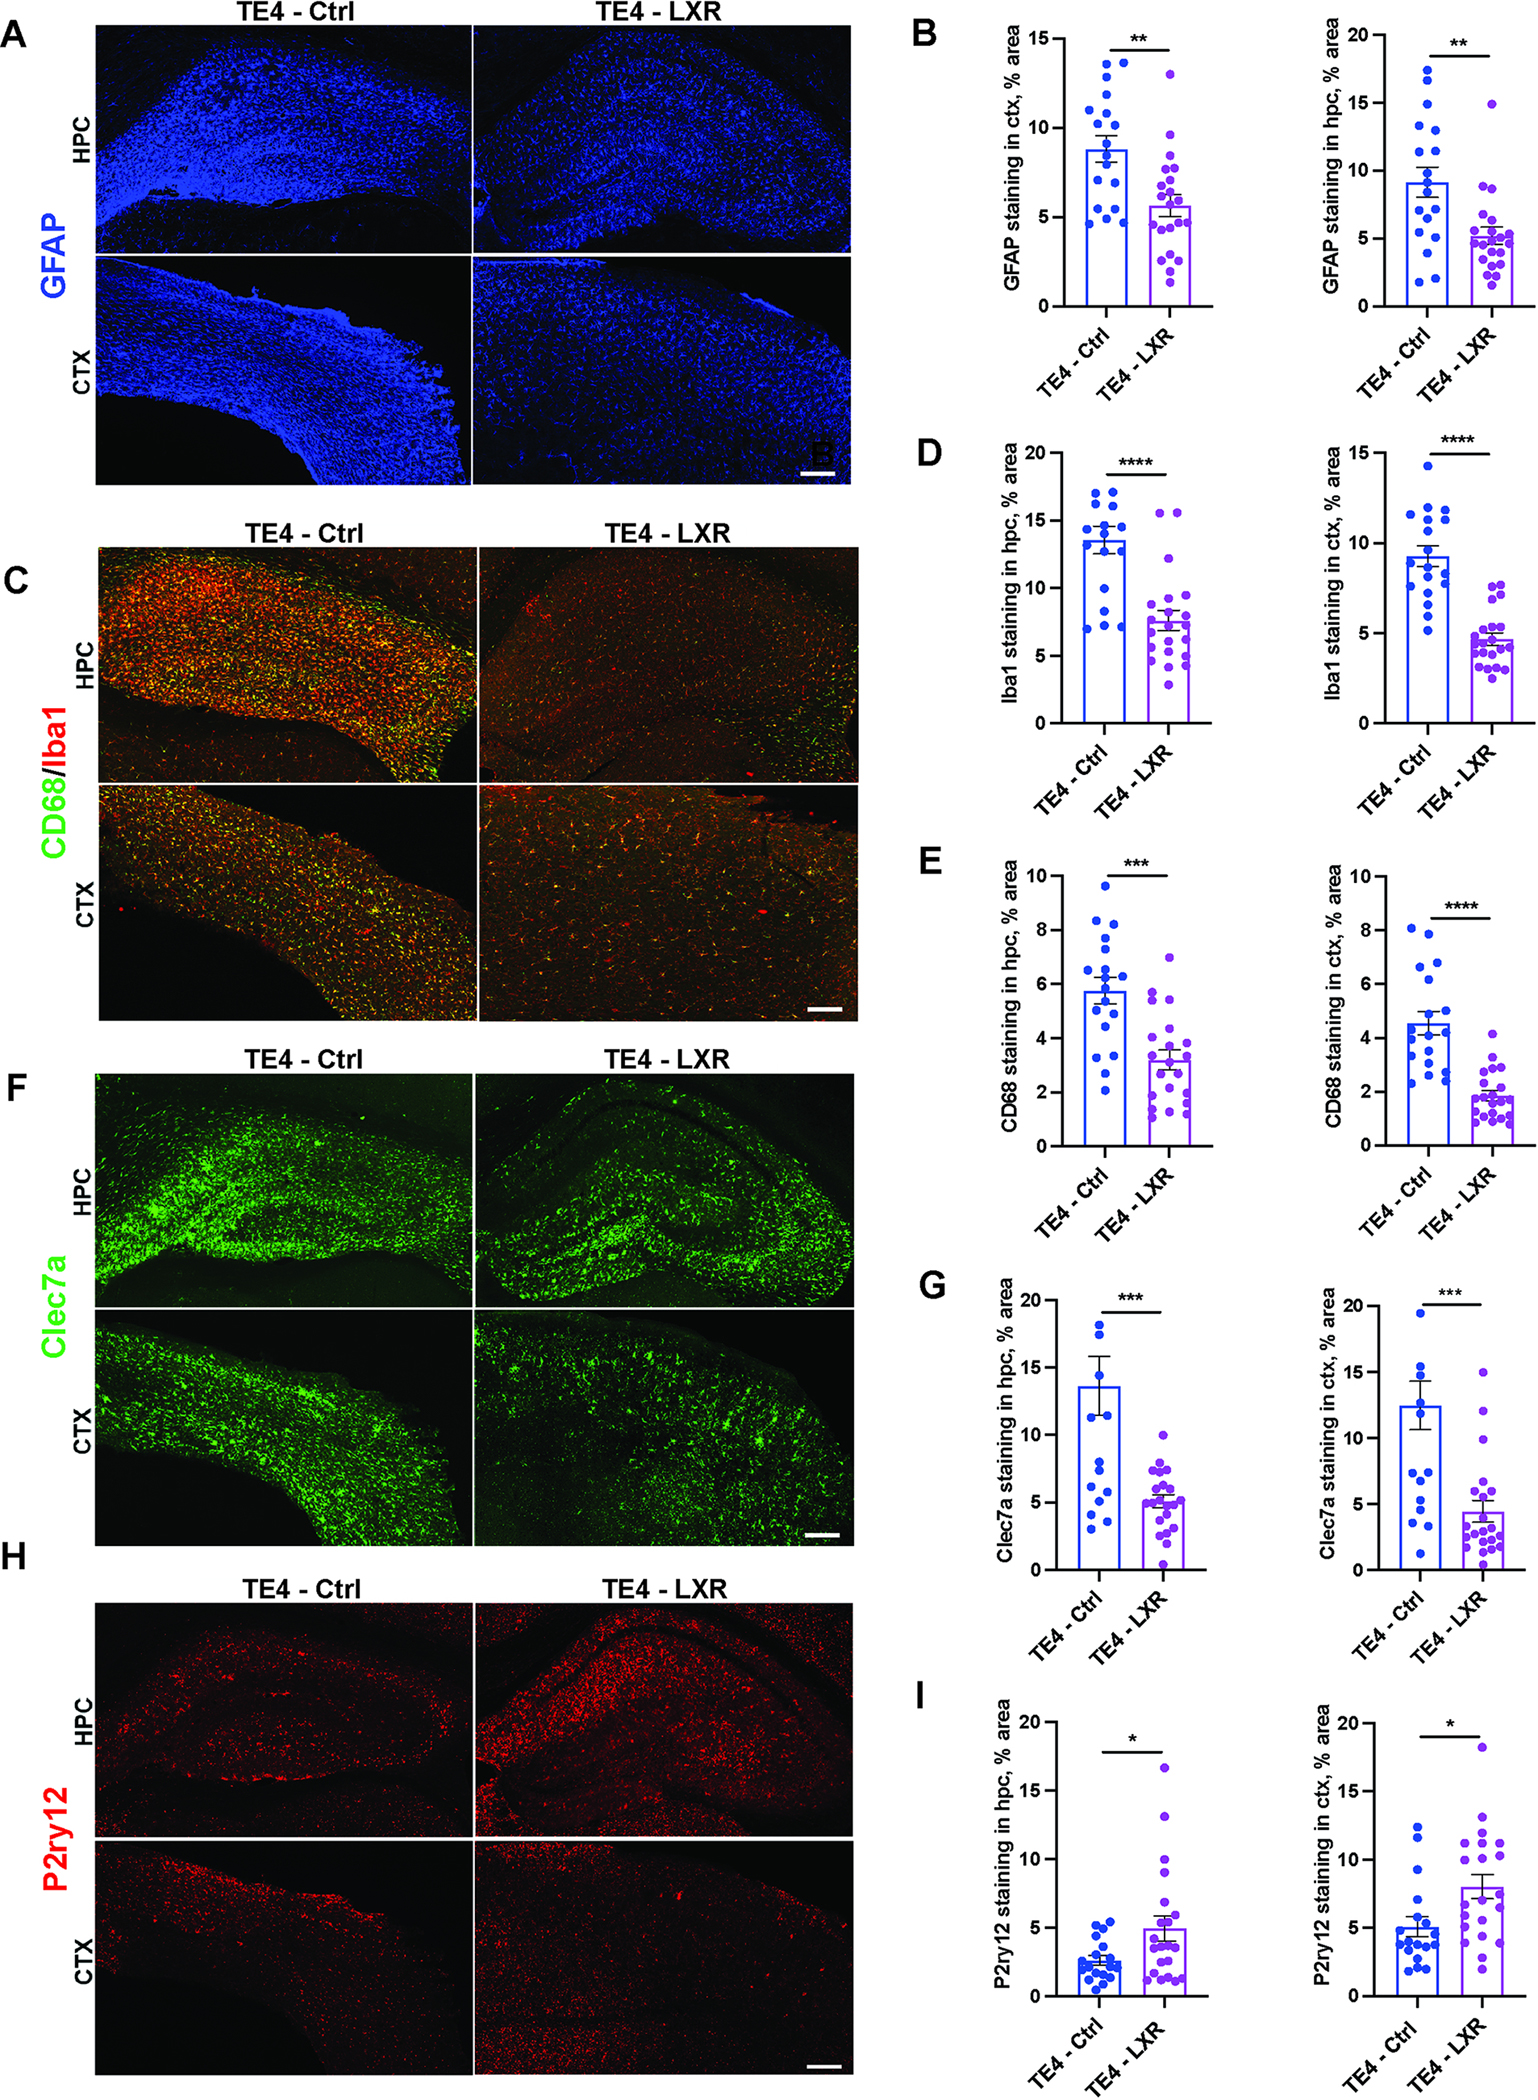
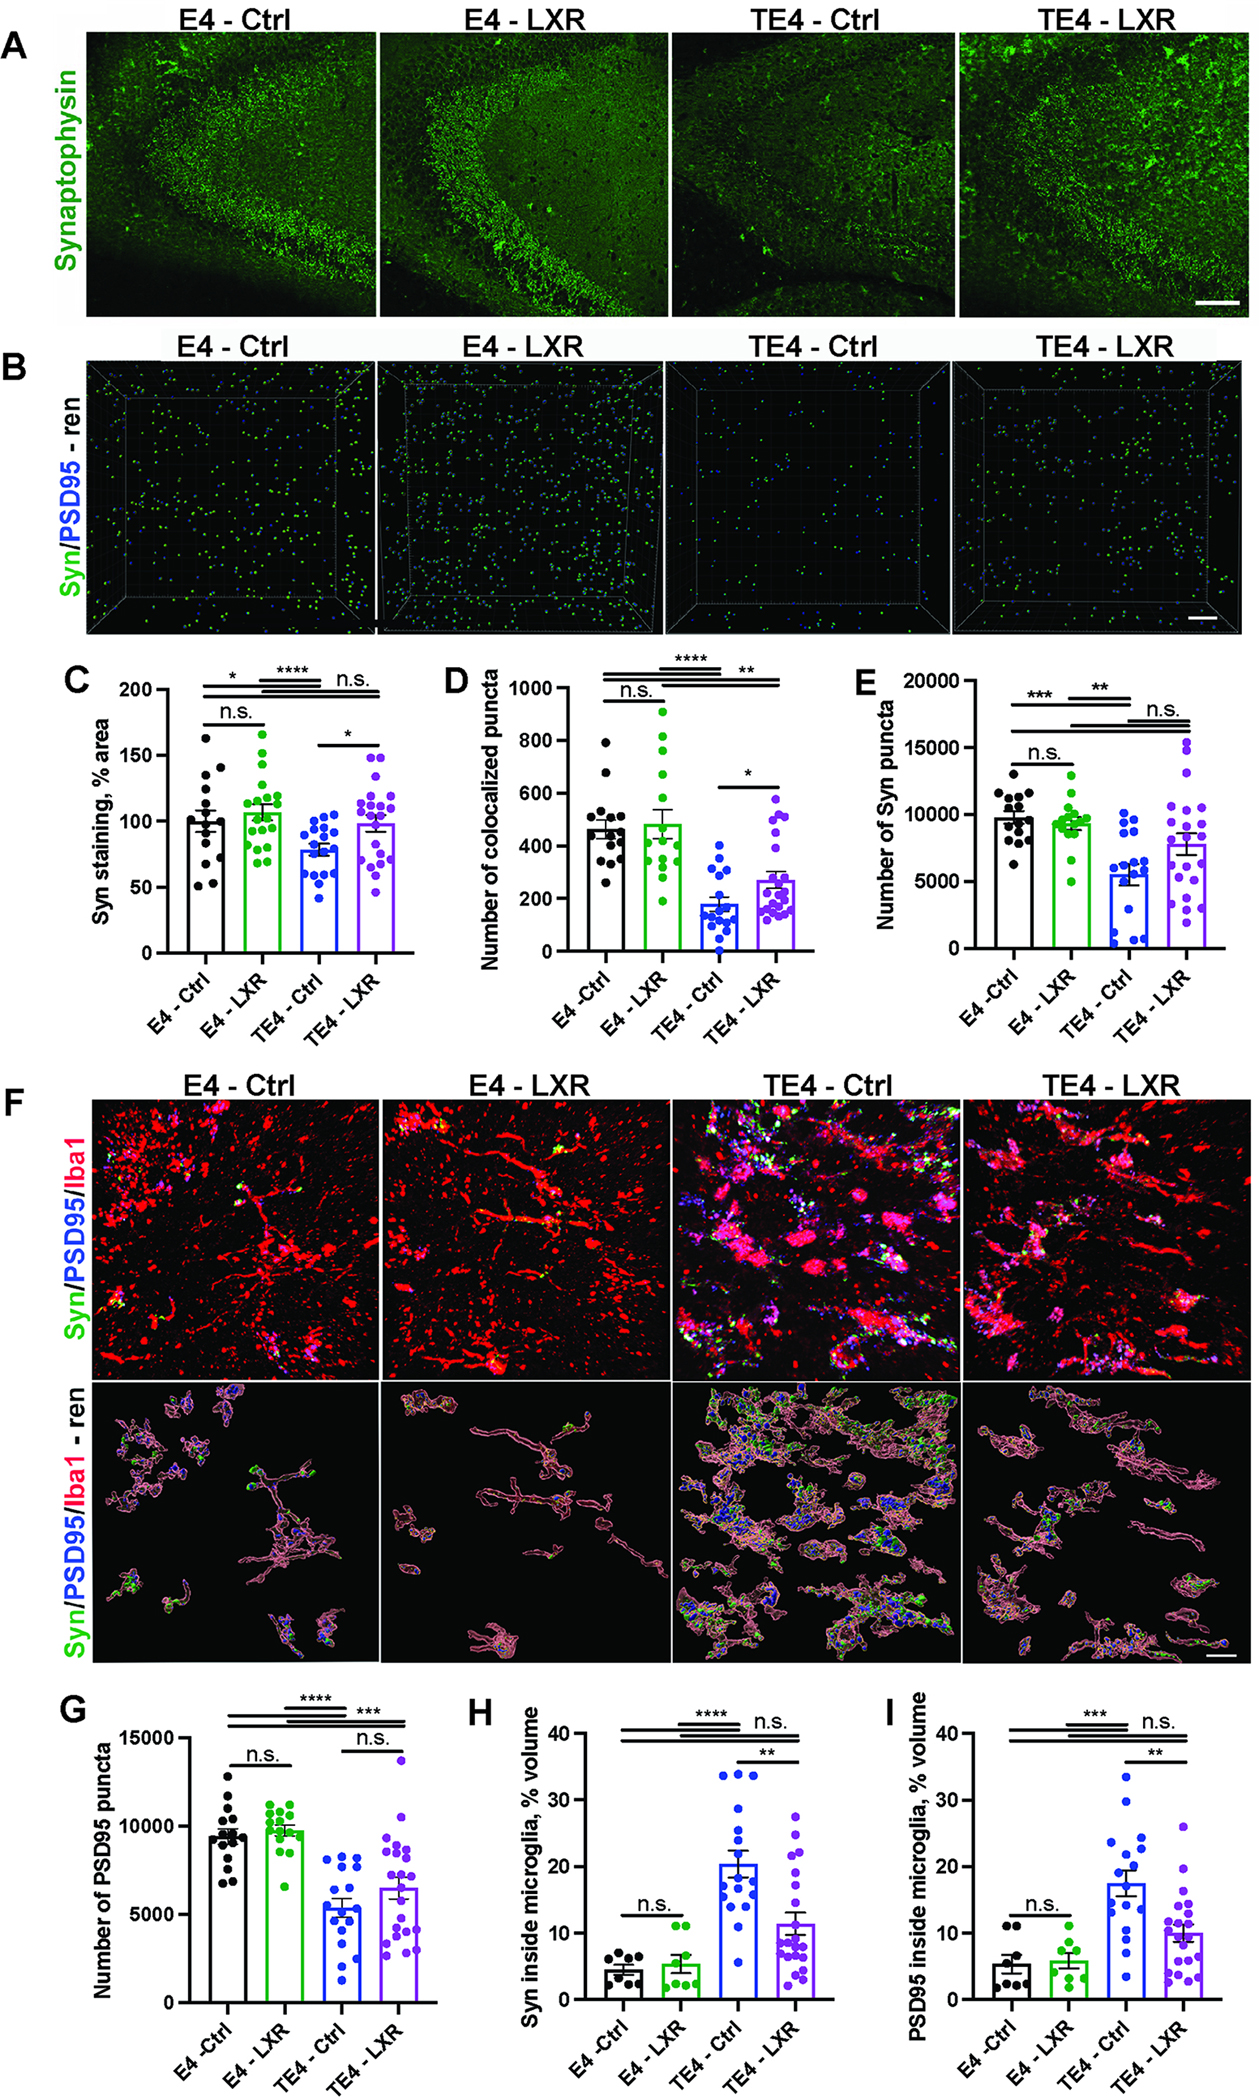
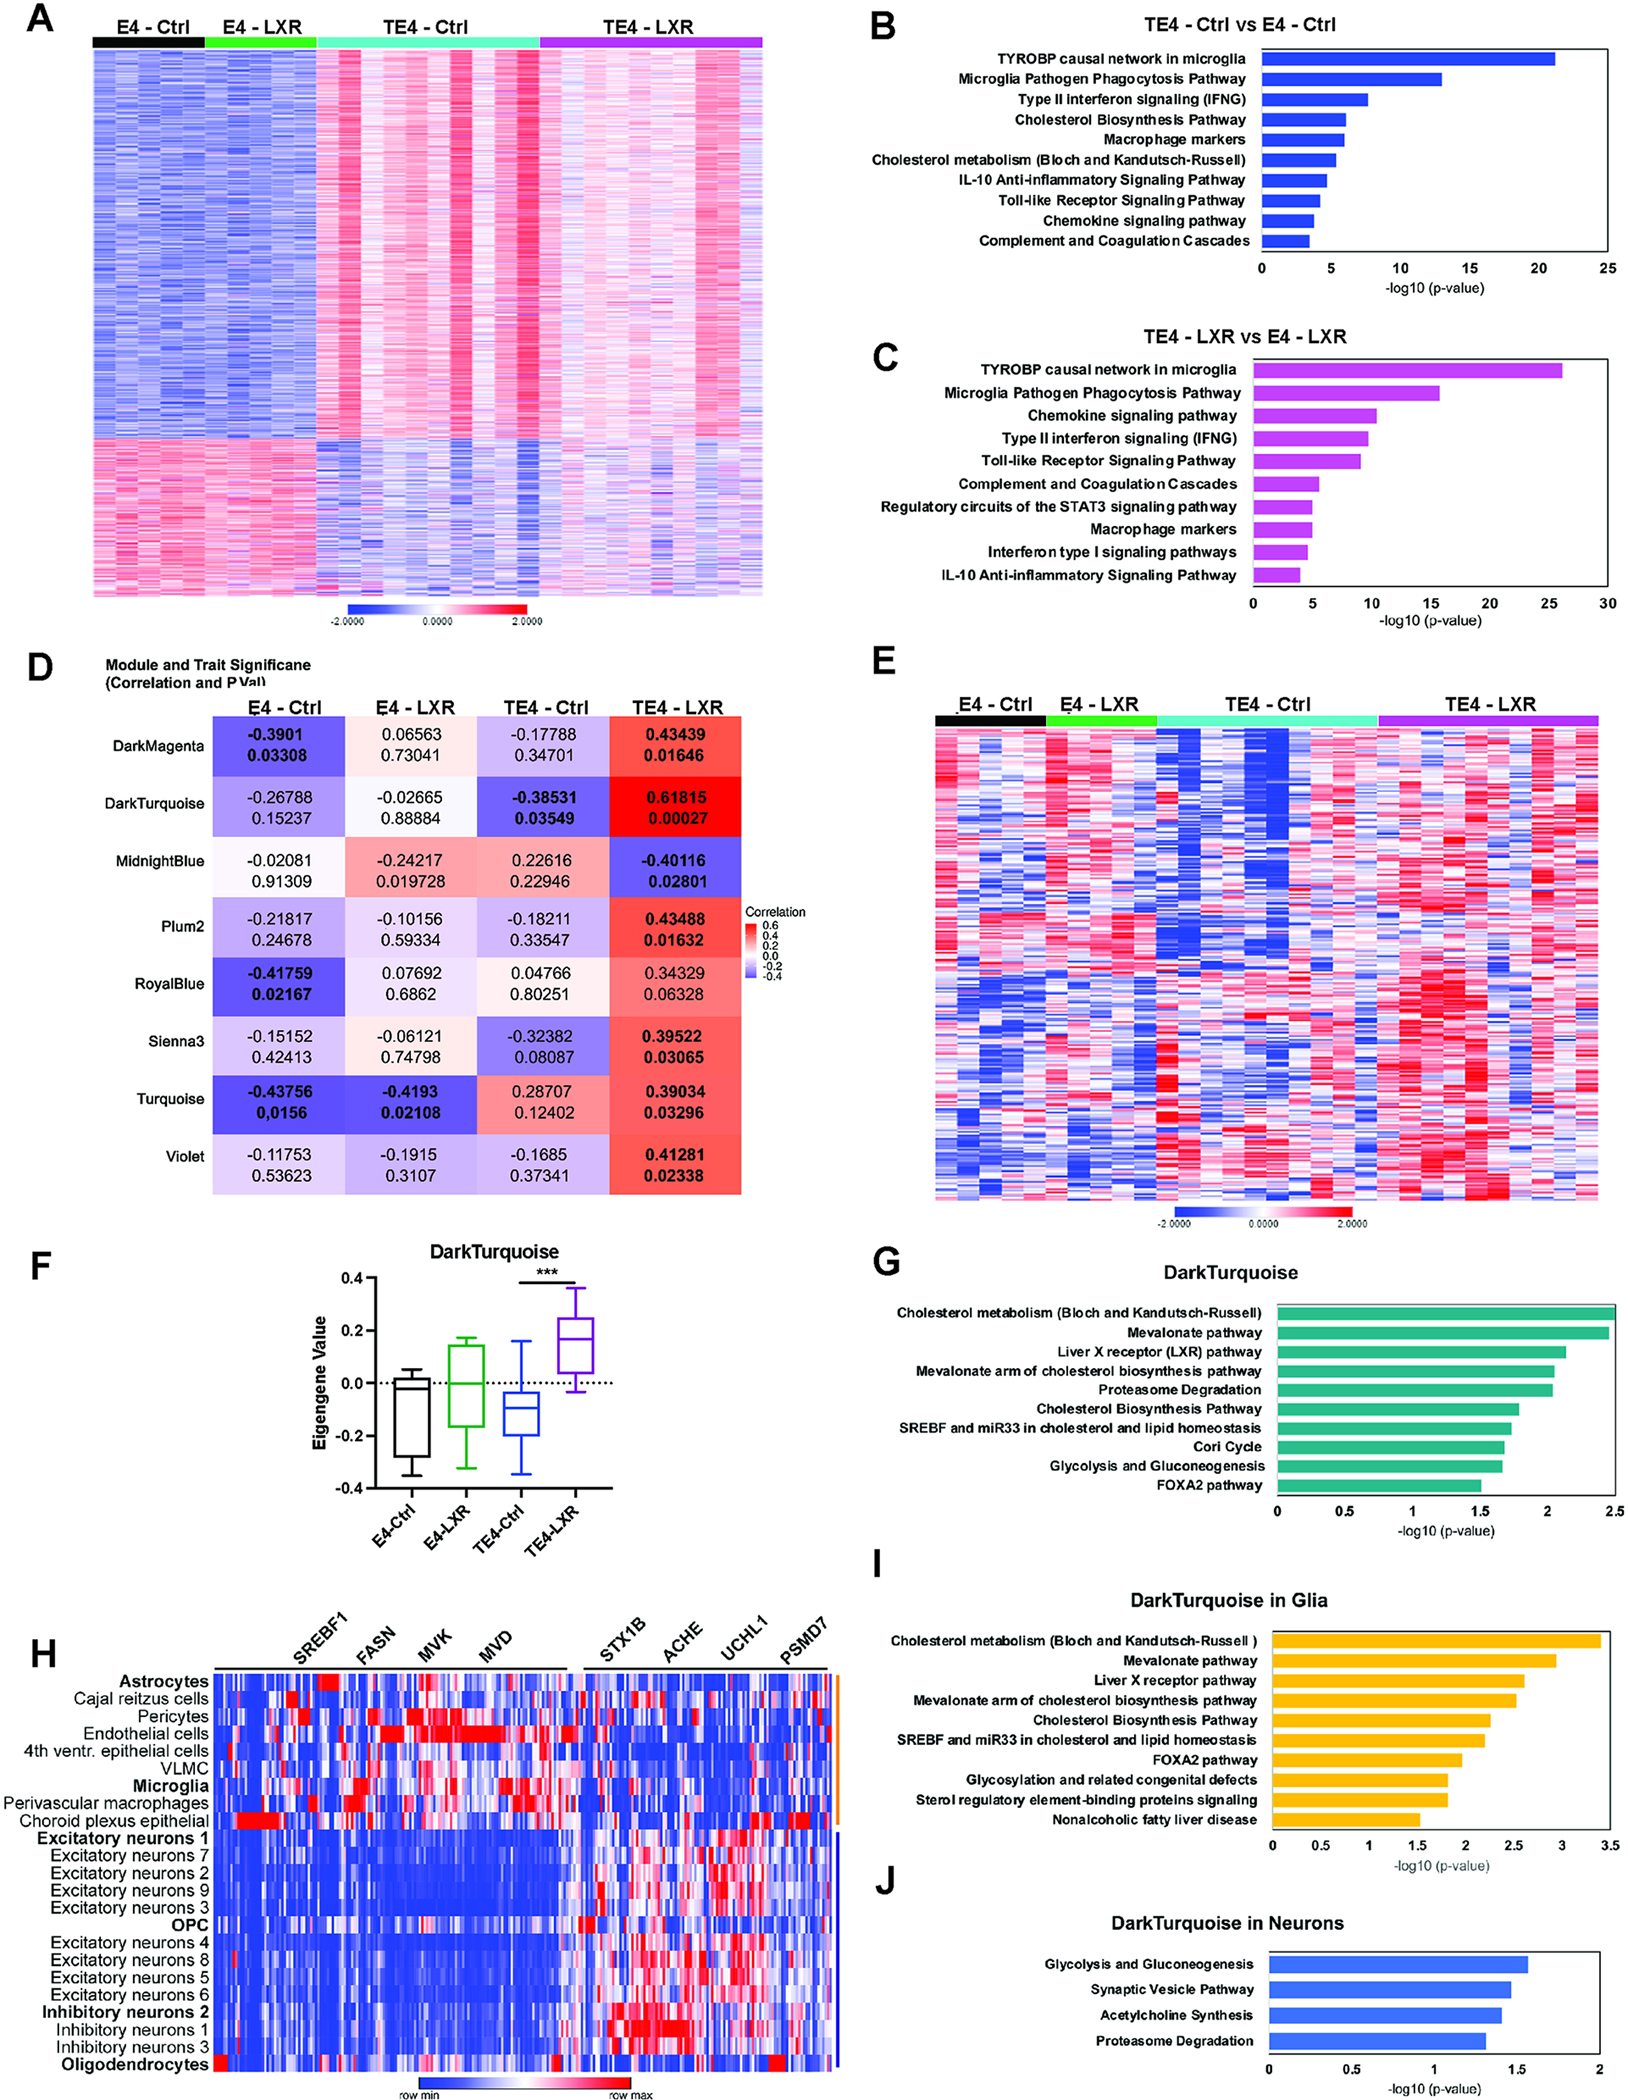
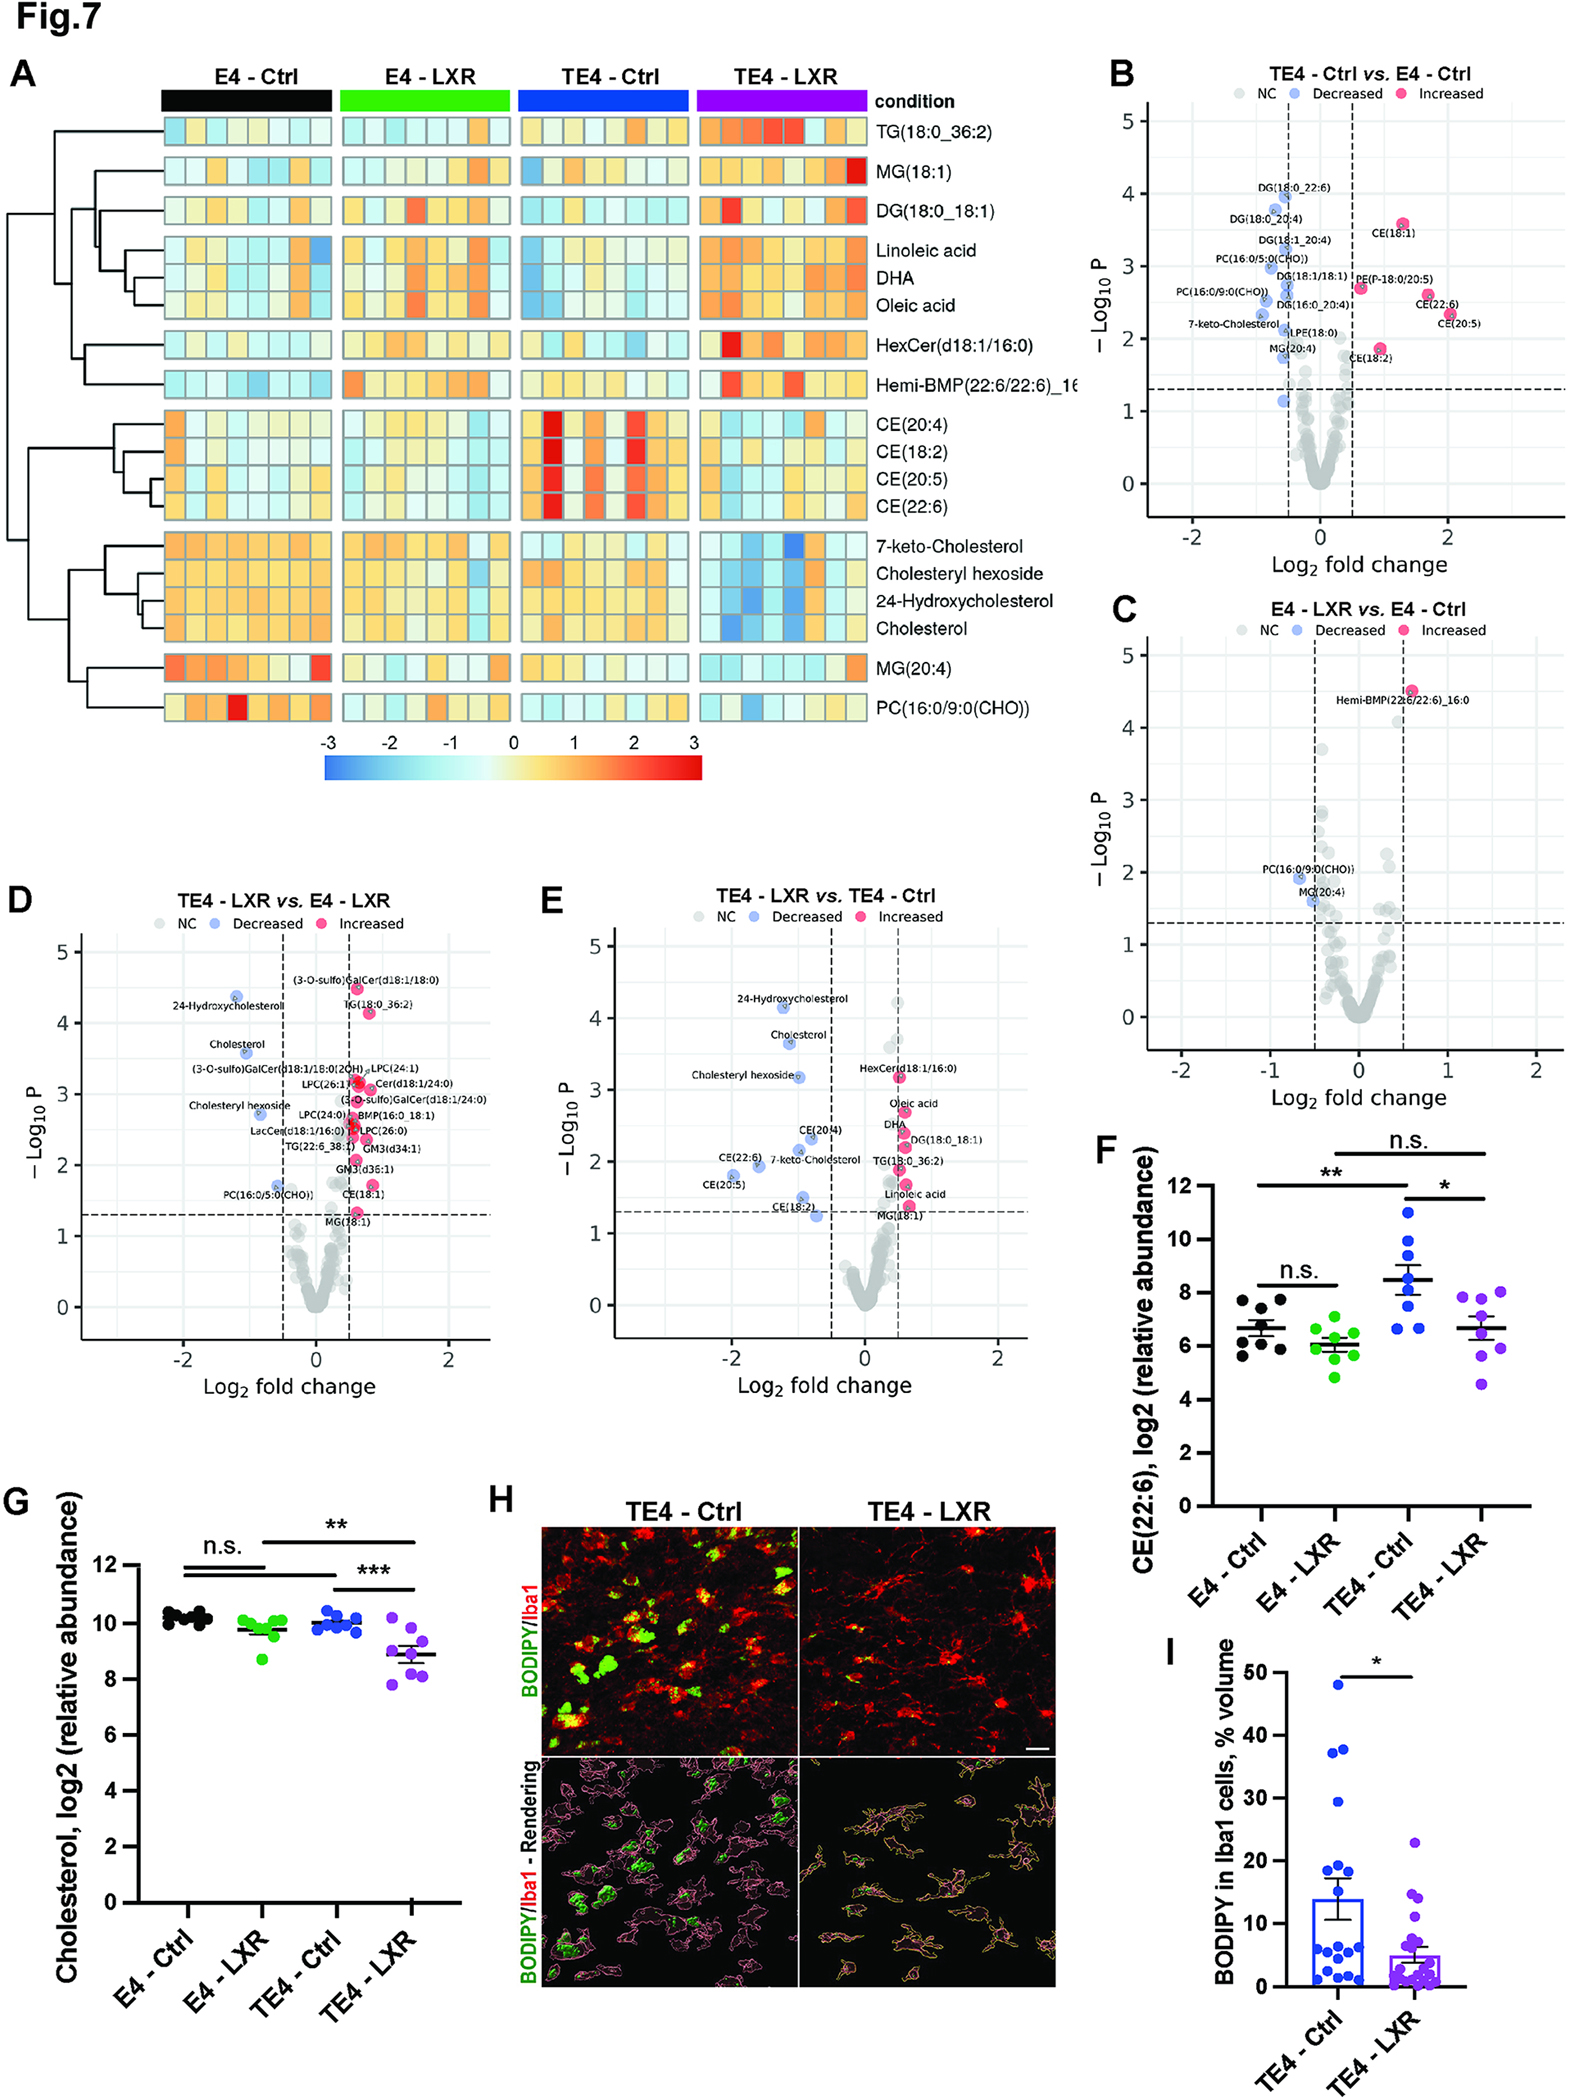
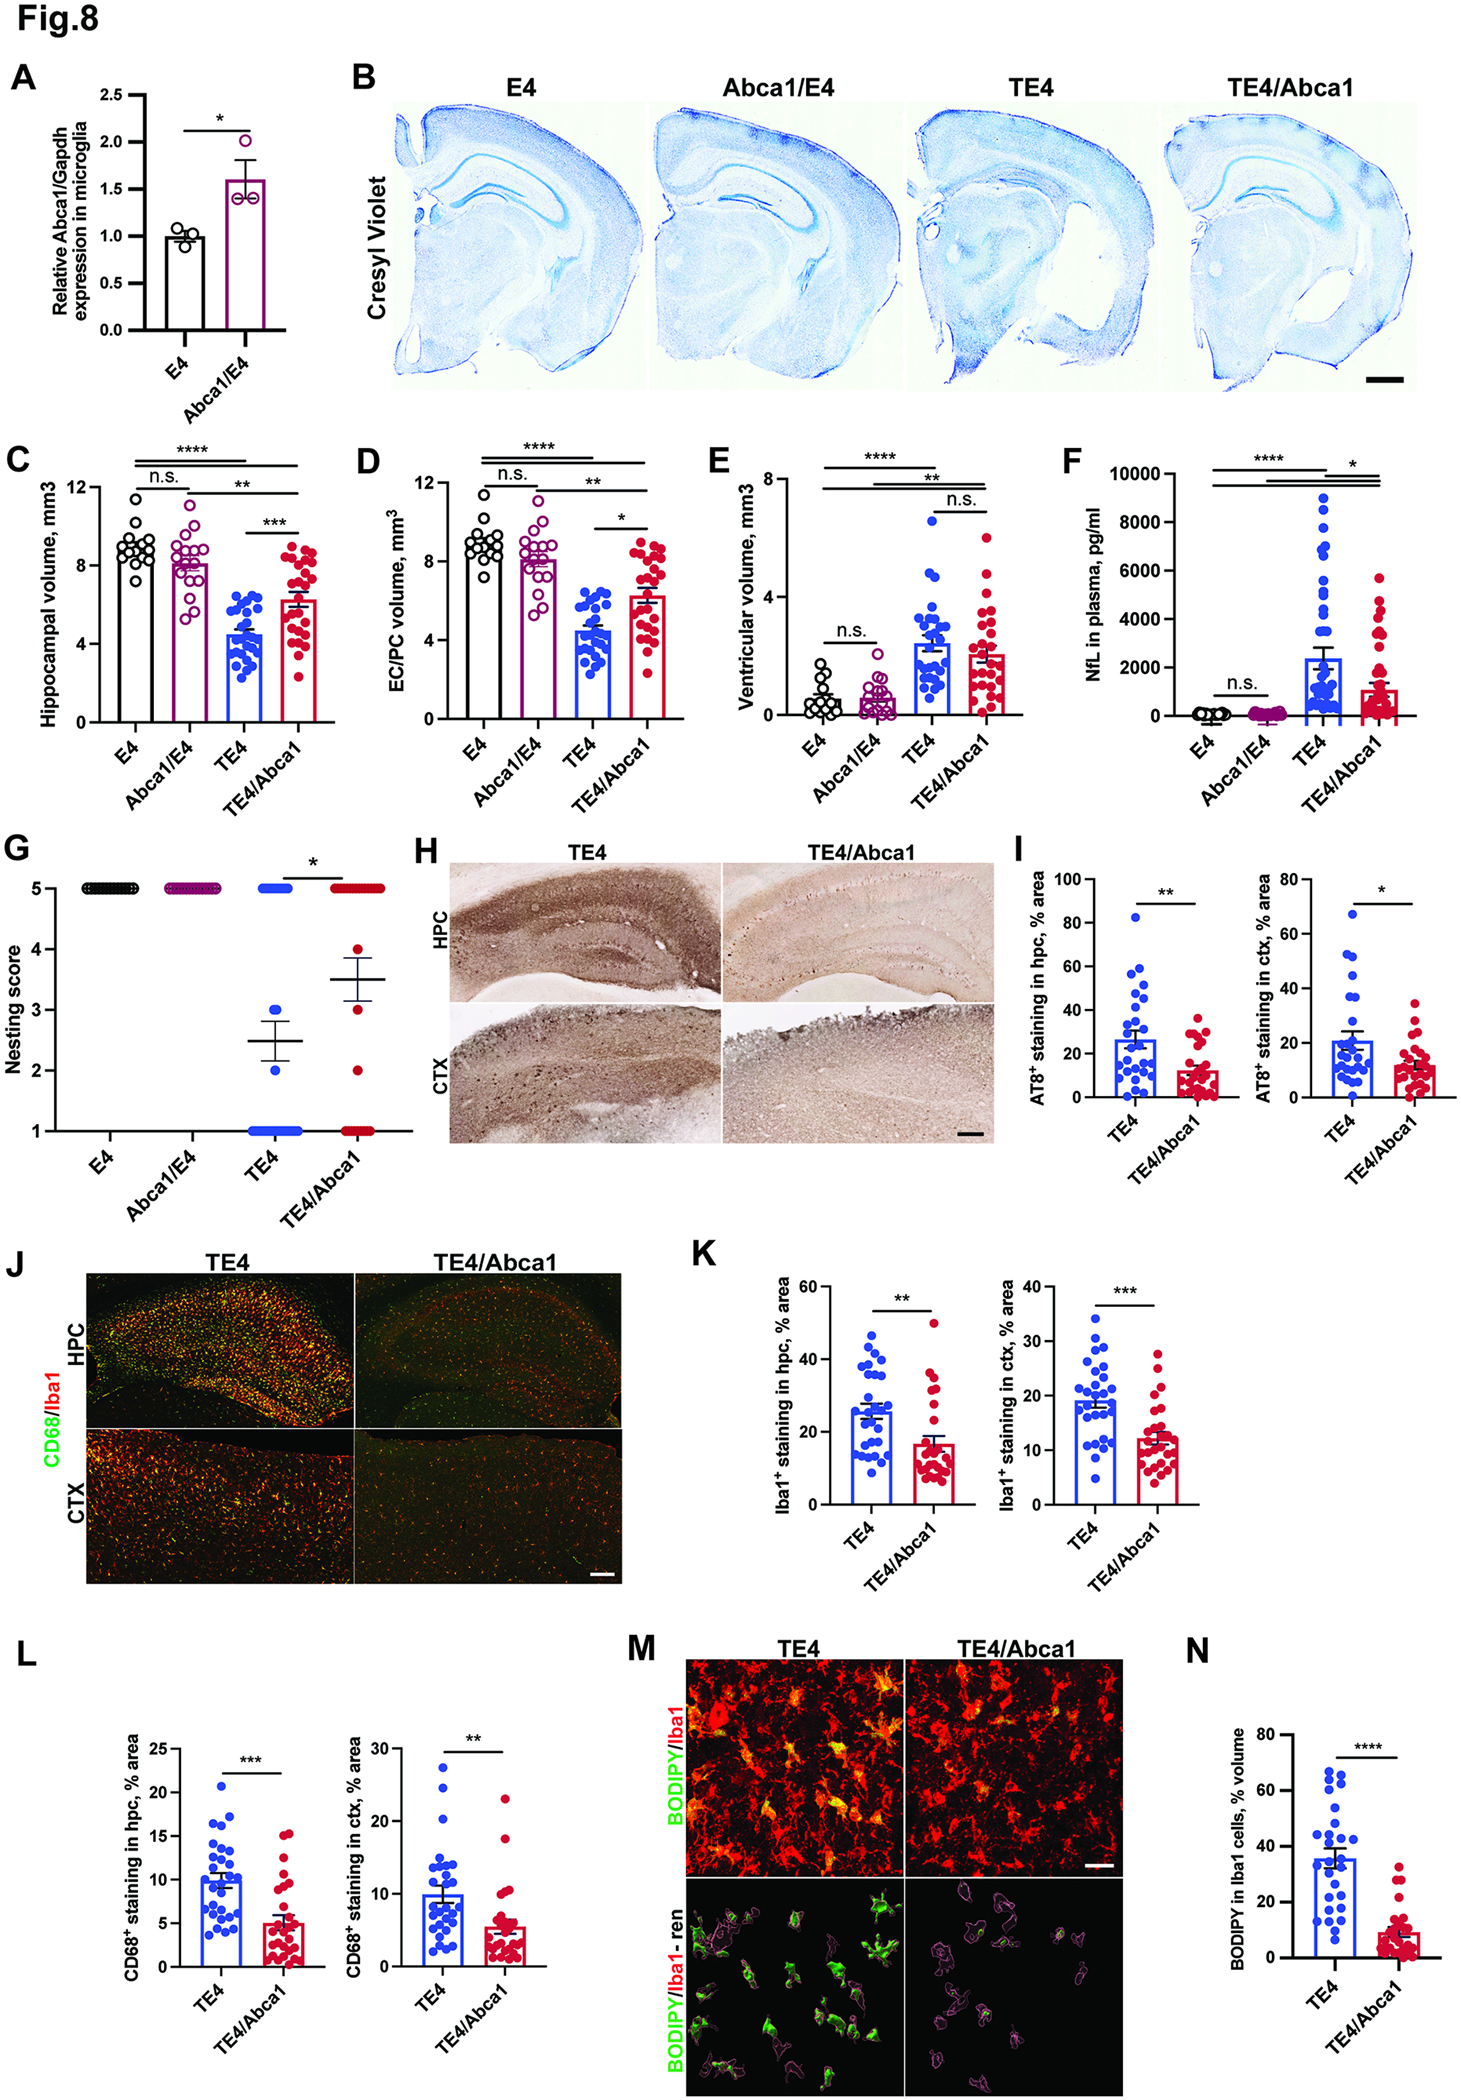
Apolipoprotein E (APOE) is a strong genetic risk factor for late-onset Alzheimer's disease (LOAD). APOE4 increases and APOE2 decreases risk relative to APOE3. In the P301S mouse model of tauopathy, ApoE4 increases tau pathology and neurodegeneration when compared with ApoE3 or the absence of ApoE. However, the role of ApoE isoforms and lipid metabolism in contributing to tau-mediated degeneration is unknown. We demonstrate that in P301S tau mice, ApoE4 strongly promotes glial lipid accumulation and perturbations in cholesterol metabolism and lysosomal function. Increasing lipid efflux in glia via an LXR agonist or Abca1 overexpression strongly attenuates tau pathology and neurodegeneration in P301S/ApoE4 mice. We also demonstrate reductions in reactive astrocytes and microglia, as well as changes in cholesterol biosynthesis and metabolism in glia of tauopathy mice in response to LXR activation. These data suggest that promoting efflux of glial lipids may serve as a therapeutic approach to ameliorate tau and ApoE4-linked neurodegeneration.

Keywords: Abca1; ApoE4; LXR agonist; Tau; cholesterol metabolism; lipid; microglia.


Conflict of interest statement

Declaration of interests D.M.H. is on the scientific advisory board of C2N diagnostics and has equity. D.M.H. is on the scientific advisory board of Denali Therapeutics, Genentech, and Cajal Therapeutics and consults for Asteroid Therapeutics. J.H.S., J.L.G., H.P.B., S.S.D., and G.D.P. are full-time employees and shareholders of Denali Therapeutics Inc. K.L. and N.B.-L. are former employees of Denali Therapeutics Inc.

Figures

Fig. 1.
Fig. 1.. ApoE4 induces changes in cholesterol metabolism in forebrains of 9.5-month-old P301S/ApoEKI mice.
(A) Representative Cresyl Violet staining of brain sections from 9.5-month-old ApoE KO (EKO) and P301S/ApoE KO (TEKO), ApoE3 (E3) and P301S/ApoE3 (TE3), ApoE4 (E4) and P301S/ApoE4 (TE4) mice. (B) Quantification of hippocampal (left), entorhinal/piriform (EC/PC) cortex (middle), and ventricular volumes (right) from 9.5-months-old mice. (C) Heatmap of significantly changed lipids in forebrains of 9.5-months-old EKO and TEKO, E3 and TE3, E4 and TE4 mice. (D) Volcano plot of differentially abundant lipids in E4 vs. E3 mice. (E) Volcano plot of differentially abundant lipids in TE4 vs. E4 mice. (F) Volcano plot of differentially abundant lipids in TE4 vs. TE3 mice. (G-H) Relative levels of CE (22:6) (G) and free cholesterol (H) in forebrains of 9.5-month-old mice. (A-I) N=12 (6M and 6F)/genotype. p<0.05. Log2FC>0.5. 181 variables detected. Scale bar in (A): 100um. *p<0.05; ** p<0.01; *** p<0.001; **** p<0.0001. N.S. – non-significant. One-way ANOVA in B. P.adj. generated by R Statistical package for all lipids detected in lipidomic profiling analysis in G and H. See also Fig. S1–2.
Fig. 2.
Fig. 2.. ApoE4 induces glial lipid accumulation in P301S mice.
(A) Representative BODIPY (green), Iba1 (red) and CD68 (blue) co-immunostaining in hippocampus of 9.5-month-old EKO and TEKO, E3 and TE3, E4 and TE4 mice. (B-D) Quantification of BODIPY signal within Iba1 cells (B), within CD68-positive lysosomes (C) and outside CD68-positive lysosomes (D). (E) Representative BODIPY (green) staining and 3D-rendering of BODIPY signal within Iba1-positive microglial lysosomes (CD68-positive) of 9.5-month-old TE4 mice. (F-G) Relative levels of cholesteryl esters (CE) (20:4) (F) and CE (22:6) (G) in astrocytes from 9.5-month-old mice. (H-I) Relative levels of CE (20:4) (H) and CE (22:6) (I) in microglia from 9.5-month-old mice. (J) Relative levels of cholesterol in microglia from 9.5-month old mice. N=12 (6M and 6F)/genotype. Scale bar in (A): 100 um. Scale bar in (E): 5um. *p<0.05; ** p<0.01; *** p<0.001. N.S. – non-significant. One-way ANOVA in B-D. P.adj. generated by R Statistical package for all lipids detected in lipidomic profiling analysis in F and J. See also Fig. S3.
Fig. 3.
Fig. 3.. LXR agonist GW3965 reduces neurodegeneration, improves nesting behavior score and reduces phospho-Tau levels in 9.5-month-old TE4 mice.
(A) Representative Cresyl Violet staining of brain sections from 9.5-month-old E4 and TE4 mice treated with either control (Ctrl) or 10mg/kg GW3965 LXR agonist diet (LXR) from 6 to 9.5 months. (B-D) Quantification of hippocampal (B), entorhinal/piriform (EC/PC) cortical (C) and ventricular brain volumes (D). (E) Neurofilament light chain (NfL) levels in plasma of 9.5-month-old mice. (F) Nesting behavior score in 9.5-month-old mice. 0 – no nestlets used; 1 - <10%, 2 – 20–50%, 3 – 50–90% nestlets used; 4 - <10% nestlets unused; 5 – 100% nestlets used. (G) Representative staining of AT8 phospho-tau in hippocampus (hpc) and cortex (ctx) of 9.5-month-old TE4 mice. (H) Quantification of AT8 signal in hippocampus and cortex. (I) Total tau levels in cortical RAB, RIPA and FA fractions. (J) Phospho-tau (AT8) levels in cortical RAB, RIPA and FA fractions. (K) hApoE levels in cortical RAB fraction. (L) hApoE levels in liver. Each dot represents one animal: N (E4 – Ctrl) = 15; N (E4 – LXR) = 15; N (TE4 - Ctrl) = 18; N (TE4-LXR) =21. Male mice. Scale Bar in A: 1 mm; G: 100 um. *p<0.05; ** p<0.01; *** p<0.001; **** p<0.0001. N.S. – non-significant. One-way ANOVA in B-E. Fisher’s exact test in F. Student’s T-Test in I-L. See also Fig. S4.
Fig. 4.
Fig. 4.. LXR agonist GW3965 reduces microglial and astrocytic activation in 9.5-month-old TE4.
(A) Representative GFAP immunostaining in hippocampus (hpc) and cortex (ctx) of 9.5-month-old E4 and TE4 mice treated with either control (Ctrl) or 10mg/kg GW3965 LXR agonist diet (LXR) from 6 to 9.5 months. (B) Quantification of (A). (C) Representative CD68 (green) and Iba1 (red) co-immunostaining in hippocampus (hpc) and cortex (ctx). (D-E) Quantification of Iba1 (D) and CD68 stainings in (C). (F-G) Representative Clec7a immunostaining with quantification in (G). (H-I) Representative P2ry12 (red) immunostaining with quantification in (I). Each dot represents one animal: N (TE4 - Ctrl) = 18; N (TE4-LXR) =21. Male mice. Scale bar: 100 um. *p<0.05; ** p<0.01; *** p<0.001. N.S. – non-significant. Student’s T-Test.
Fig. 5.
Fig. 5.. LXR agonist GW3965 reduces synaptic loss in 9.5-month-old TE4 mice.
(A and C) Representative synaptophysin immunostaining in in CA3 area of hippocampus from 9.5-month-old E4 and TE4 mice treated with either control (Ctrl) or 10mg/kg GW3965 LXR agonist (LXR) and its quantification (C). (B) Representative 3D-rendering of co-localized synaptophysin (Syn) and PSD95 puncta in hippocampal CA3 area. (D-E and G) Quantification of co-localized puncta (D), synaptophysin (Syn) (E) or PSD95 (G) in CA3 area of hippocampus. (F) Representative synaptophysin (Syn, green) and PSD95 (blue) inside Iba1-postive microglia (red) from 9.5-month-old mice with 3D-rendering. (H-I) Quantification of synaptophysin (Syn) (H) and PSD95 (I) volumes within Iba1-positive microglia. Each dot represents one animal: N (E4 – Ctrl) = 15; N (E4 – LXR) = 15; N (TE4 - Ctrl) = 18; N (TE4-LXR) =21. Male mice. Scale bar in A: 100 um; B: 5 um; F: 50um. *p<0.05; ** p<0.01; *** p<0.001. N.S. – non-significant. One-way ANOVA in C-E, G-I.
Fig. 6.
Fig. 6.. LXR agonist in 9.5-month-old TE4 mice induces changes in inflammatory response and cholesterol metabolism at a gene expression level.
(A) Representative heatmap of 1738 DEGs between TE4 vs. E4 mice treated with control (Ctrl) or GW3965 (LXR) diet from 6 to 9.5 months. P.adj. <0.05. N(E4/treatment) =5; N(TE4/treatment) =10. Male mice. (B) Top 10 biological pathways (WikiPathway) enriched in TE4-Ctrl vs. E4-Ctrl with P.adj. <0.05. (C) Top 10 biological pathways (WikiPathway) enriched in TE4-LXR vs. E4-LXR with P.adj. <0.05. (D) Representative table of 8 WGCNA modules enriched in E4 and TE4 mice on control or LXR diets. (E) Representative heatmap of 266 genes from Dark Turquoise module identified by WGCNA analysis. (F) Average eigengene values from Dark Turquoise cluster. (G). Top 10 biological pathways (WikiPathway) from Dark Turquoise module upregulated in TE4-LXR mice but downregulated in TE4-Ctrl animals with P.adj. <0.05. (H) Heatmap, illustrating expression of 266 genes from Dark Turquoise module in TE4-LXR mice at single-cell level. Cells are clustered in two separate groups (yellow and blue) by gene expression. (I) Top 10 biological pathways (WikiPathway) enriched in TE4-LXR non-neuronal cells (including astrocytes and microglia, yellow cluster) with P.adj. <0.05. (J) Top 4 biological pathways (WikiPathway) enriched in TE4-LXR neuronal cells and OPC/oligodendrocytes (blue cluster) with P.adj. <0.05. See also Fig. S5–7.
Fig. 7.
Fig. 7.. LXR agonist GW3965 reduces lipid and CEs accumulation in forebrains of 9.5-month-old TE4 mice.
(A) Heatmap of significantly changed lipids in forebrains of 9.5-month-old E4 or TE4 mice treated with either control (Ctrl) or GW3965 (LXR) diets from 6 to 9.5 months. N=8/genotype/treatment. Male mice. (B) Volcano plot of differentially abundant lipids in TE4-Ctrl vs. E4-Ctrl mice. (C) Volcano plot of differentially abundant lipids in E4-LXR vs. E4-Ctrl mice. (D) Volcano plot of differentially abundant lipids in TE4-LXR vs. E4-LXR mice. (E) Volcano plot of differentially abundant lipids in TE4-LXR vs. TE4-Ctrl mice. (F-G) Relative levels of CE (22:6) (F) and free cholesterol (G) in forebrains of 9.5-month-old mice. (H-I) Representative BODIPY (green) and Iba1 (red) co-staining (upper panel) with 3D-IMARIS rendering (lower panel) and quantification (I) in hippocampus of 9.5-month-old mice. N=18–21/genotype/treatment. Male mice. Scale Bar: 100um; *p<0.05. ** p<0.01. N.S. – non-significant. P.adj. generated by R Statistical package for all lipids detected in lipidomic profiling analysis in F and G. Student’s T-Test in I. See also Fig. S8.
Fig. 8.
Fig. 8.. Abca1 overexpression ameliorates neurodegeneration and tau pathology and reduces microglial/myeloid cells reactivity and lipid accumulation in 9.5-month-old TE4 mice.
(A) Relative Abca1 mRNA expression in primary microglia isolated from of Abca1/E4 mice. (B) Representative Cresyl Violet staining of brain sections from 9.5-month-old E4, Abca1/E4, TE4 and TE4/Abca1 mice. (C-E) Quantification of hippocampal (C), entorhinal/piriform (EC/PC) cortical (D) and ventricular brain volumes in 9.5-month-old mice (E). (F) Neurofilament light chain (NfL) levels in plasma of 9.5-month-old mice. (G) Nesting behavior score in 9.5-month-old mice. (H) Representative immunohistochemical staining of AT8 phospho-tau in hippocampus (hpc) and cortex (ctx) of 9.5-month-old TE4 mice. (I) Quantification of AT8 signal in hippocampus and cortex. (J) Representative CD68 (green) and Iba1 (red) co-immunostaining in hippocampus (hpc) and cortex (ctx). (K-L) Quantification of Iba1 (K) and CD68 stainings in (L). (M-N) Representative BODIPY (green) and Iba1 (red) co-staining (upper panel) with 3D-IMARIS rendering (lower panel) (M) and quantification (N) in hippocampus of 9.5-month-old mice. Each dot represents one animal: N (E4) = 15; N (Abca1/E4) = 16; N (TE4) = 25; N (TE4/Abca1) =26. Male mice. Scale Bar in A: 1 mm; G and I: 100 um; L; 50um. *p<0.05; ** p<0.01; *** p<0.001; **** p<0.0001. N.S. – non-significant. One-way ANOVA in C-F. Fisher’s exact test in G. Student’s T-Test in A, I, K, L, N.

Comment in

References

    1. Holtzman DM, Herz J, and Bu G (2012). Apolipoprotein E and apolipoprotein E receptors: Normal biology and roles in Alzheimer disease. Cold Spring Harb. Perspect. Med. 2, a006312. 10.1101/cshperspect.a006312. - DOI - PMC - PubMed
    1. Shi Y, and Holtzman DM (2018). Interplay between innate immunity and Alzheimer disease: APOE and TREM2 in the spotlight. Nat. Rev. Immunol. 18, 759–772. 10.1038/s41577-018-0051-1. - DOI - PMC - PubMed
    1. Marschallinger J, Iram T, Zardeneta M, Lee SE, Lehallier B, Haney MS, Pluvinage JV, Mathur V, Hahn O, David W, et al. (2020). Nature Neurosceince. Nat. Neurosci. 23, 194–208. 10.1038/s41593-019-0566-1.Lipid. - DOI - PMC - PubMed
    1. Nugent AA, Lin K, van Lengerich B, Lianoglou S, Przybyla L, Davis SS, Llapashtica C, Wang J, Kim DJ, Xia D, et al. (2020). TREM2 Regulates Microglial Cholesterol Metabolism upon Chronic Phagocytic Challenge. Neuron 105, 837–854.e9. 10.1016/j.neuron.2019.12.007. - DOI - PubMed
    1. Logan T, Simon MJ, Rana A, Cherf GM, Srivastava A, Davis SS, Low RLY, Chiu CL, Fang M, Huang F, et al. (2021). Rescue of a lysosomal storage disorder caused by Grn loss of function with a brain penetrant progranulin biologic. Cell 184, 4651–4668.e25. 10.1016/j.cell.2021.08.002. - DOI - PMC - PubMed