. 2023 Dec 21;83(24):4445-4460.e7.
doi: 10.1016/j.molcel.2023.10.035. Epub 2023 Nov 22.

IntS6 and the Integrator phosphatase module tune the efficiency of select premature transcription termination events

Affiliations

IntS6 and the Integrator phosphatase module tune the efficiency of select premature transcription termination events

Rina Fujiwara et al. Mol Cell. .

Abstract

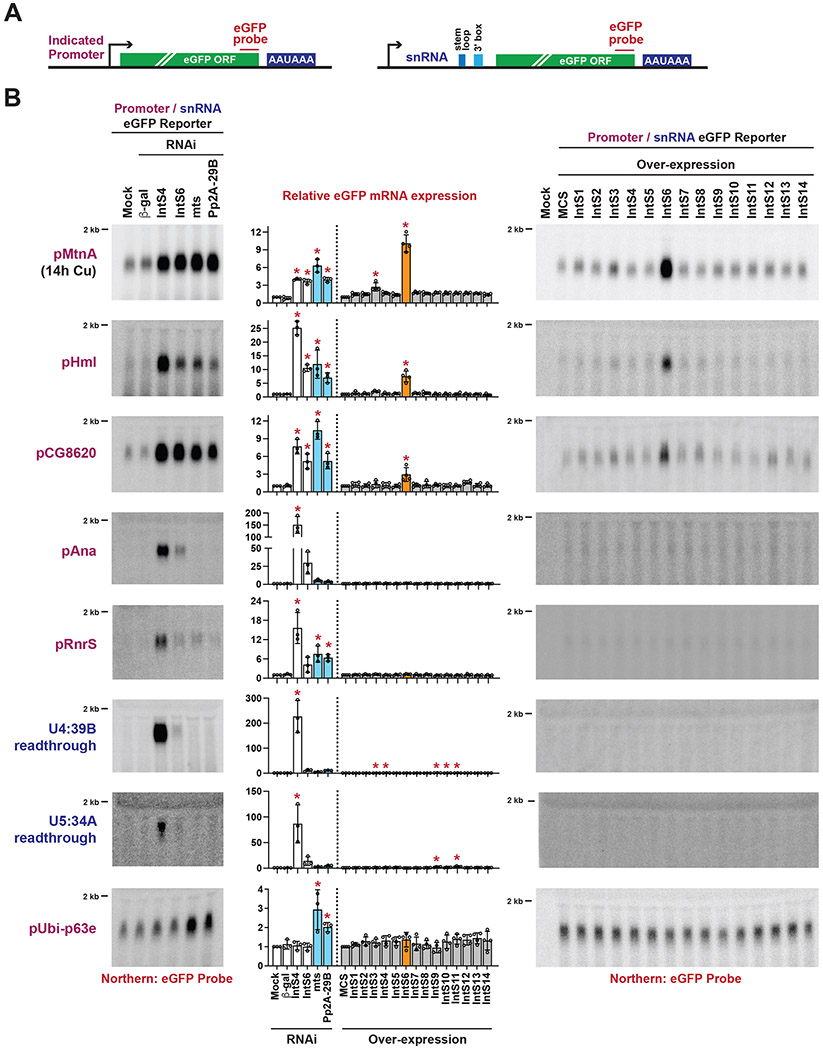
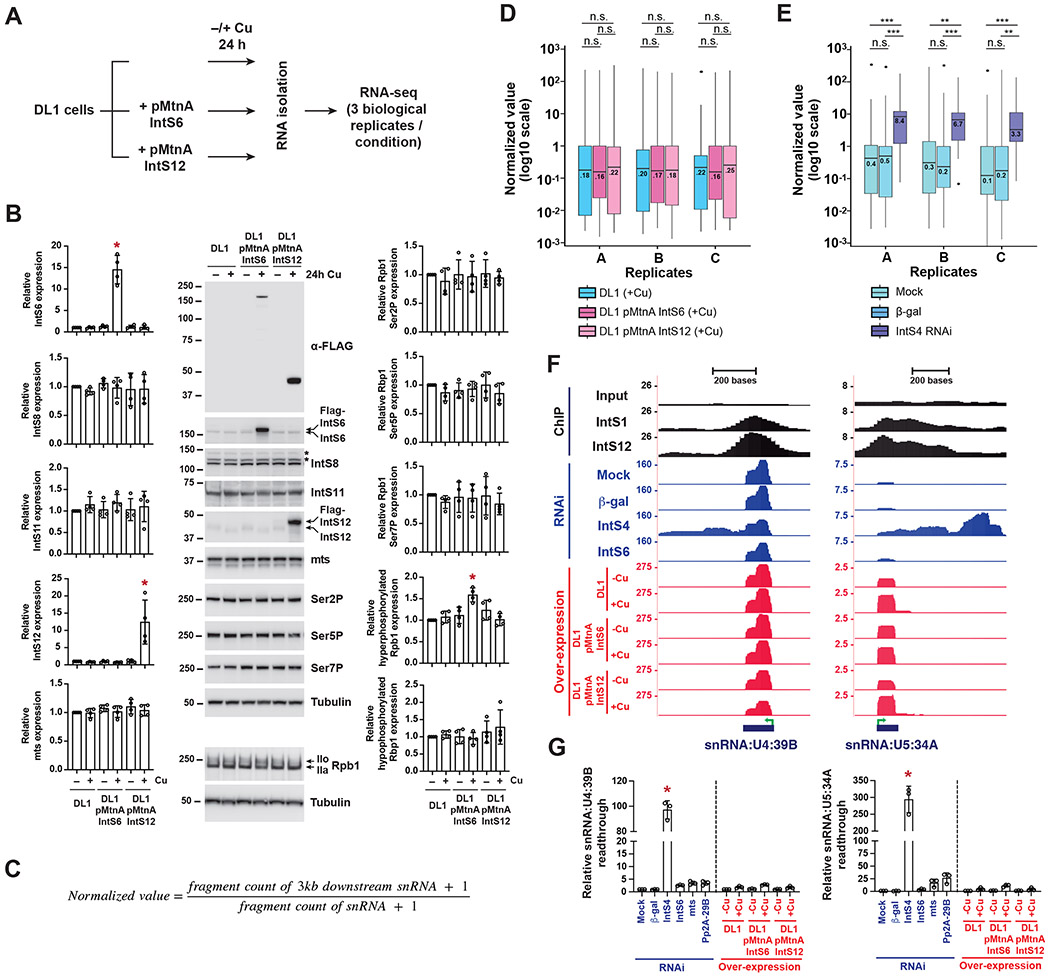
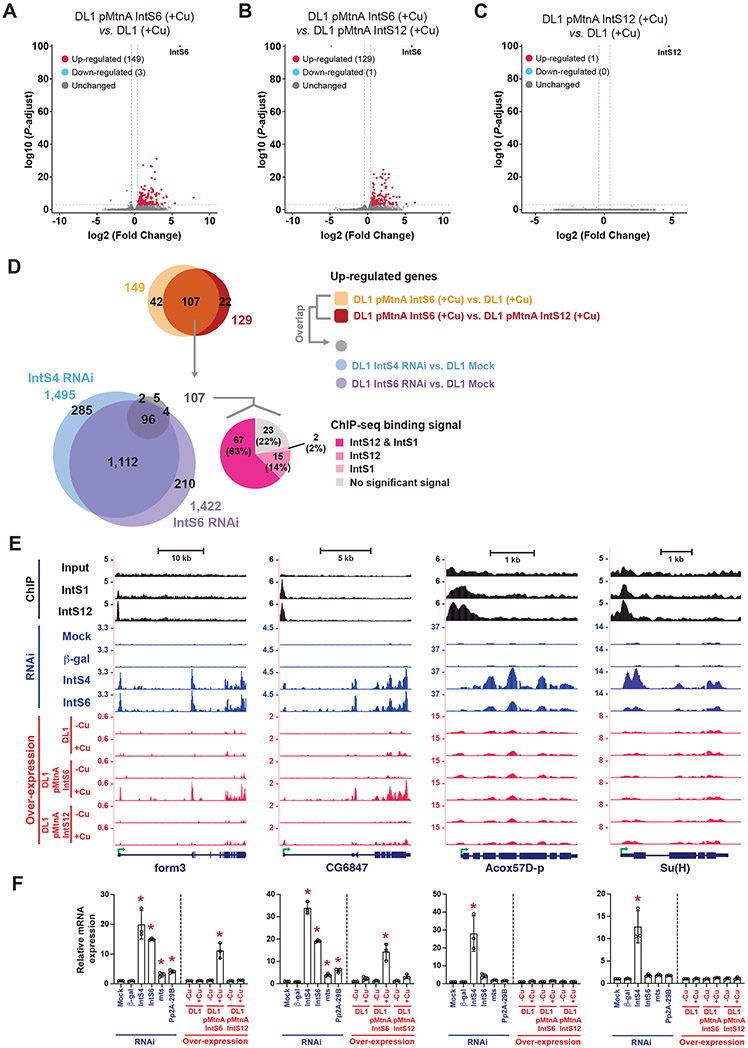
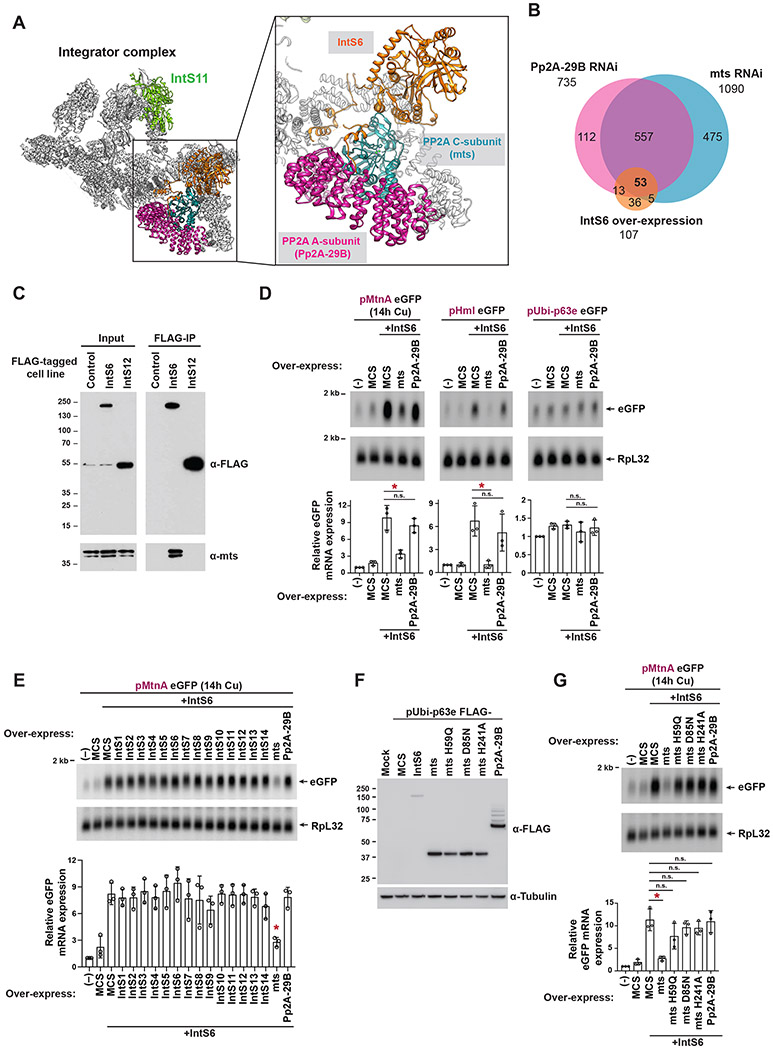
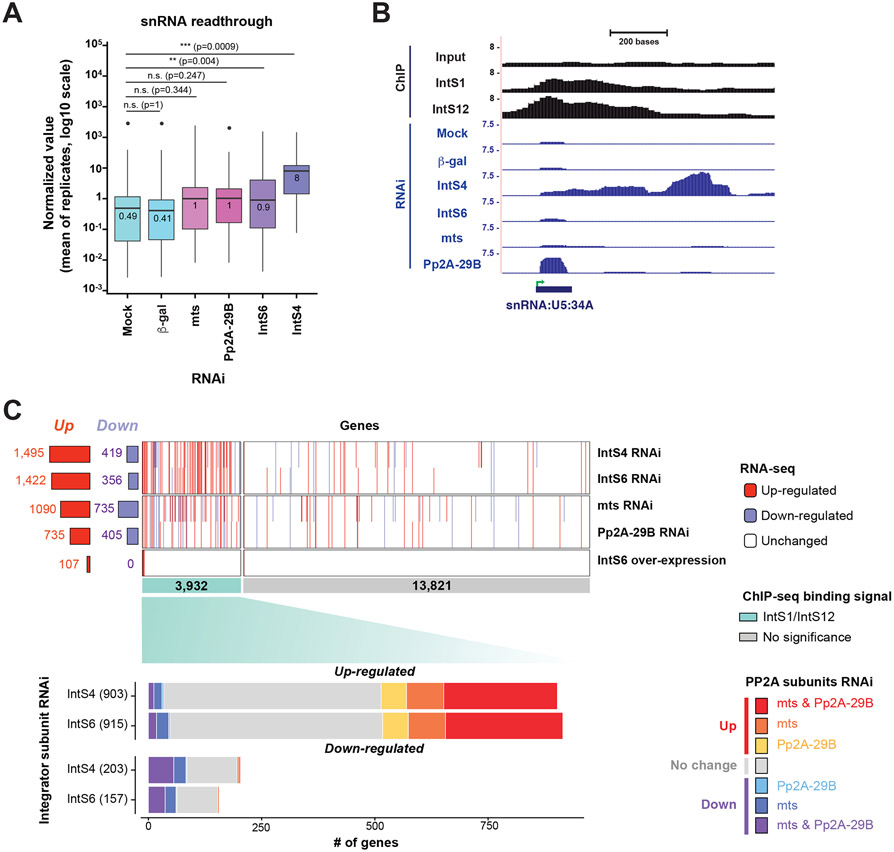
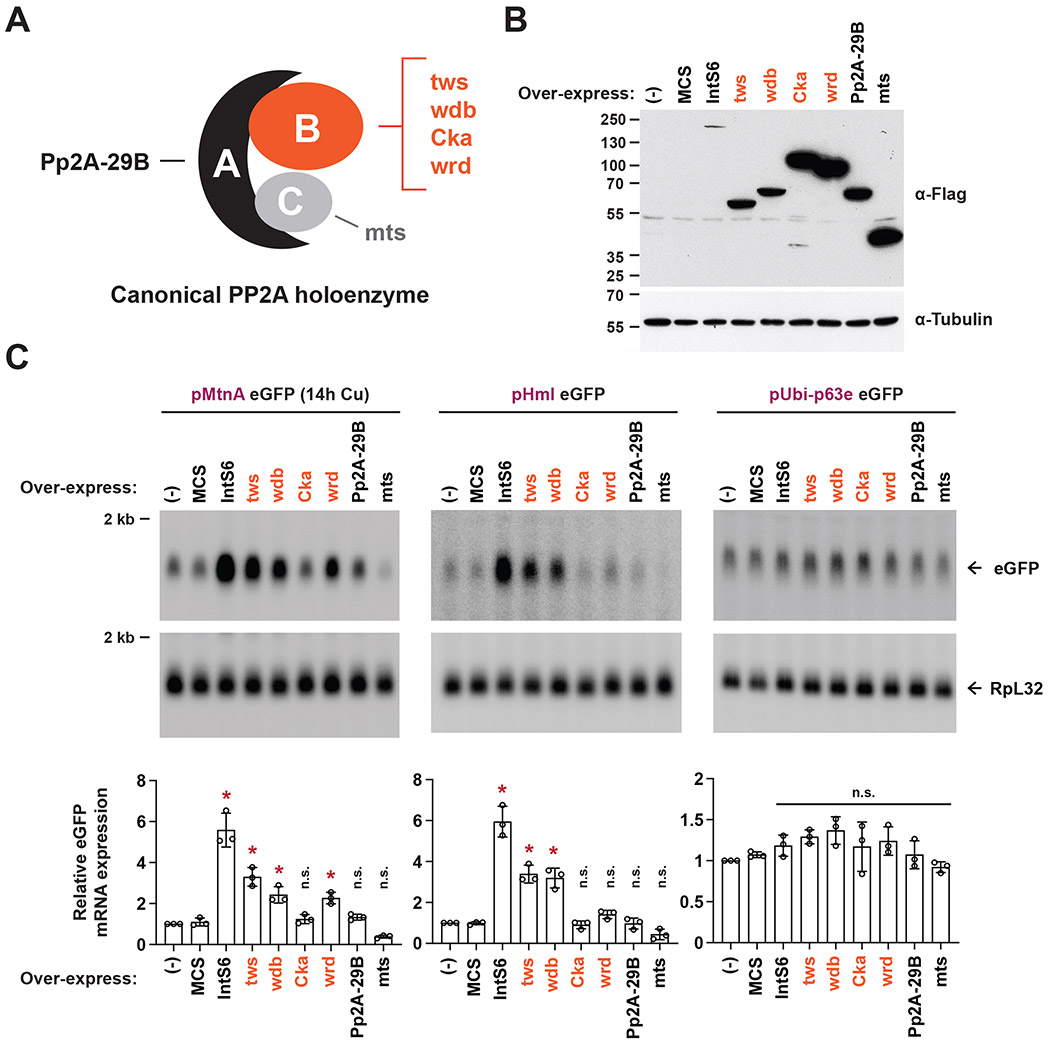
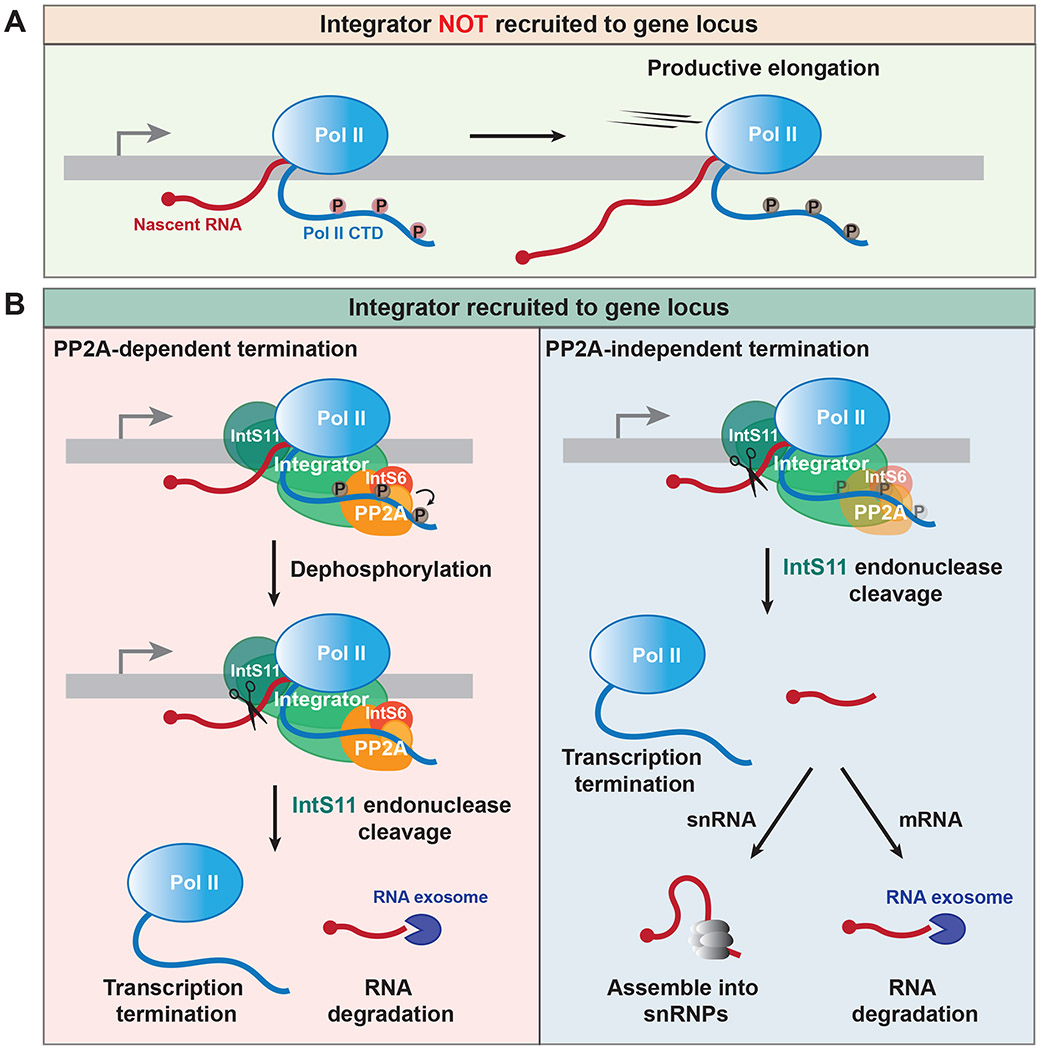
The metazoan-specific Integrator complex catalyzes 3' end processing of small nuclear RNAs (snRNAs) and premature termination that attenuates the transcription of many protein-coding genes. Integrator has RNA endonuclease and protein phosphatase activities, but it remains unclear if both are required for complex function. Here, we show IntS6 (Integrator subunit 6) over-expression blocks Integrator function at a subset of Drosophila protein-coding genes, although having no effect on snRNAs or attenuation of other loci. Over-expressed IntS6 titrates protein phosphatase 2A (PP2A) subunits, thereby only affecting gene loci where phosphatase activity is necessary for Integrator function. IntS6 functions analogous to a PP2A regulatory B subunit as over-expression of canonical B subunits, which do not bind Integrator, is also sufficient to inhibit Integrator activity. These results show that the phosphatase module is critical at only a subset of Integrator-regulated genes and point to PP2A recruitment as a tunable step that modulates transcription termination efficiency.

Keywords: 3′ end processing; INTAC; Integrator complex; Integrator subunit 6; PP2A; RNA polymerase II; promoter-proximal termination; protein phosphatase 2A; snRNA; transcription.


Conflict of interest statement

Declaration of interests J.E.W. serves as a consultant for Laronde.

Figures

Figure 1.
Figure 1.. Integrator activity at a subset of reporter genes is lost upon over-expression of IntS6.
(A) eGFP-based reporters to examine Integrator activity at protein-coding genes (left) and snRNAs (right). The promoter and 5’ UTR of each indicated protein-coding gene was cloned upstream of eGFP (left). The snRNA promoter, coding sequence, and downstream region were cloned upstream of eGFP, thereby enabling eGFP production when Integrator fails to process the snRNA 3' end between the stem loop and 3' box sequences (right). (B) Each individual reporter plasmid was transfected into DL1 cells that had been treated with the indicated dsRNAs (left) or was co-transfected with 100 ng of a plasmid that over-expresses a FLAG-tagged Integrator subunit from the Ubi-p63e promoter (right). A plasmid containing a multi-cloning site (MCS) driven by the Ubi-p63e promoter was used as a control for the over-expression experiments. CuSO4 was added for the last 14 h only when measuring eGFP production from the MtnA promoter. Total RNA was isolated and Northern blots (20 μg/lane) were used to measure expression of each eGFP reporter mRNA. Representative blots are shown and loading controls are provided in Figure S1C. RT-qPCR was used to quantify eGFP mRNA expression levels (middle). RNAi data were normalized to the mock samples and over-expression data were normalized to the MCS samples. Data are shown as mean ± SD, N ≥ 3. (*) P < 0.05. See also Figures S1, S2, and Table S5.
Figure 2.
Figure 2.. Over-expression of IntS6 does not affect Integrator activity at endogenous Drosophila snRNA loci.
(A) Parental DL1 cells or DL1 cells stably maintaining IntS6 or IntS12 transgenes driven by the copper inducible MtnA promoter were grown for 3 d. 500 μM CuSO4 was added for the last 24 h prior to total RNA isolation from three independent biological replicates. rRNA depleted RNA-seq libraries were then generated, sequenced, and analyzed. (B) Cell lines were seeded in 12-well plates (5 x 10⁵ cells per well) and grown for 3 d. As indicated, a final concentration of 500 μM CuSO4 was added to cells for the last 24 h prior to harvesting total protein. Western blot analysis was then performed using antibodies that recognize FLAG, IntS6, IntS8, IntS11, IntS12, mts, Rbp1 phosphorylated at Ser2, Ser5, or Ser7, and Rbp1 (C-terminal domain). * denotes non-specific band. IIo denotes hyperphosphorylated Rbp1, while IIa denotes hypophosphorylated Rbp1. α-tubulin was used as a loading control. Subunit expression data were normalized to the parental DL1 cells without CuSO4 treatment and are shown as mean ± SD, N = 3. (*) P < 0.05. (C) To quantify readthrough transcription downstream of endogenous snRNAs, the levels of RNA-seq fragments that map to the 3 kb downstream of mature snRNA 3' ends were normalized to the levels of fragments that map to mature snRNA sequences. (D-E) Normalized values of endogenous snRNA readthrough among (D) CuSO4 treated parental DL1 cells and DL1 cells stably maintaining IntS6 or IntS12 transgenes, and (E) DL1 cells subjected to mock, control (β-gal) dsRNA, or IntS4 dsRNA treatments. Center lines represent medians, boxes represent interquartile ranges (IQRs), and whiskers represent extreme data points within 1.5× IQRs. Black points were outliners exceeding 1.5× IQRs. P values were calculated by Wilcoxon signed-rank test. (**) P < 0.01; (***) P < 0.001; n.s., not significant. (F) UCSC genome browser tracks depicting exemplar snRNA loci. IntS1 and IntS12 ChIP-seq profiles in DL1 cells (GSE114467) are shown in black. RNA-seq data generated from DL1 cells treated for 3 d with control (β-gal), IntS4, or IntS6 dsRNAs are shown in blue. RNA-seq data generated from parental DL1 cells or DL1 cells stably maintaining copper-inducible IntS6 or IntS12 transgenes are shown in red. 500 μM CuSO4 was added for 24 h as indicated. Green arrow, transcription start site (TSS). (G) Readthrough downstream from snRNA transcripts was quantified using RT-qPCR. Data are shown as mean ± SD, N = 3. (*) P < 0.05. See also Figure S3 and Tables S1, S2, S4, S5, S6.
Figure 3.
Figure 3.. Over-expression of IntS6 blocks Integrator activity at a subset of endogenous Drosophila protein-coding genes.
(A-C) The magnitude of change in mRNA expression compared with statistical significance (adjusted P-value) is shown as volcano plots. Endogenous mRNA expression levels upon IntS6 over-expression were compared to that in parental DL1 cells (A) or upon IntS12 over-expression (B). mRNA expression levels upon IntS12 over-expression were compared to parental DL1 cells (C). Threshold used to define differentially expressed mRNAs was ∣log2(fold change)∣ > 0.585 and adjusted P < 0.001. (D) The overlapping set of 107 protein-coding genes that were up-regulated upon IntS6 over-expression were compared to the sets of genes up-regulated upon RNAi depletion of IntS4 or IntS6 (left) and the sets of genes bound by IntS12 and/or IntS1 in DL1 cells in previously published (GSE114467) ChIP-seq experiments (right). (E) UCSC genome browser tracks depicting example protein-coding loci that are (form3, CG6847) or are not (Acox57D-p, Su(H)) affected by IntS6 over-expression. IntS1 and IntS12 ChIP-seq profiles in DL1 cells (GSE114467) are shown in black. RNA-seq data generated from DL1 cells treated for 3 d with control (β-gal), IntS4, or IntS6 dsRNAs are shown in blue. RNA-seq data generated from parental DL1 cells or DL1 cells stably maintaining copper-inducible IntS6 or IntS12 transgenes are shown in red. 500 μM CuSO4 was added for 24 h as indicated. Green arrow, transcription start site (TSS). (F) Expression of the indicated mRNAs (order as in E) was quantified using RT-qPCR. Data are shown as mean ± SD, N = 3. (*) P < 0.05. See also Figures S3, S4, S5, S6 and Table S1, S3, S4, S5.
Figure 4.
Figure 4.. IntS6 over-expression titrates the catalytic subunit of PP2A and causes it to be limiting for Integrator activity.
(A) Cryo-EM structure (PDB: 7PKS) of the human Integrator complex, highlighting the positions of the RNA endonuclease IntS11 (green), IntS6 (orange), and PP2A subunits (teal and pink). There are direct contacts between IntS6 and the PP2A subunits. (B) DL1 cells were treated for 3 d with control (β-gal), Pp2A-29B, or mts dsRNAs and RNA-seq data generated. The sets of endogenous genes up-regulated upon Pp2A-29B or mts depletion (fold change > 1.5 and adjusted P value < 0.001) were compared to the set of 107 genes that were up-regulated upon over-expression of IntS6. (C) Parental DL1 cells (Control) and DL1 cells stably maintaining inducible FLAG-tagged IntS6 or IntS12 transgenes were treated with 500 μM CuSO4 for 24 h to induce transgene expression. Immunoprecipitation (IP) using anti-FLAG resin was then performed. Western blots of input nuclear extracts (left, 0.16% input for FLAG and 0.25% for mts) and IP (right, 0.2% eluate for FLAG and 25% for mts) are shown. (D, E) DL1 cells were co-transfected with 300 ng of eGFP reporter plasmid, 100 ng of IntS6 over-expression plasmid (driven by the Ubi-p63e promoter), and 100 ng of the indicated PP2A subunit (D) or Integrator subunit (E) over-expression plasmid (driven by the Ubi-p63e promoter). Empty vector (pUb 3xFLAG MCS) was added as needed so that 500 ng DNA was transfected in all samples. CuSO4 was added for the last 14 h only when measuring eGFP production from the MtnA promoter. Northern blots (20 μg/lane) were used to quantify expression of each eGFP reporter mRNA. Representative blots are shown and RpL32 mRNA was used as a loading control. Data are shown as mean ± SD, N = 3. (*) P < 0.05; n.s., not significant. (F) DL1 cells were transfected with 500 ng of the indicated FLAG-tagged expression plasmids and total protein was harvested after 48 h. A plasmid containing a multi-cloning site (MCS) was used as a control. Western blot analysis using an antibody that recognizes FLAG was used to confirm expression of individual Integrator/PP2A subunits. α-tubulin was used as a loading control. (G) DL1 cells were co-transfected with 300 ng of eGFP reporter plasmid, 100 ng of IntS6 over-expression plasmid (driven by the Ubi-p63e promoter), and 100 ng of the indicated PP2A subunit over-expression plasmid (driven by the Ubi-p63e promoter). CuSO4 was added for the last 14 h and Northern blots (20 μg/lane) were used to quantify expression of the eGFP reporter mRNA. Representative blots are shown and RpL32 mRNA was used as a loading control. Data are shown as mean ± SD, N = 3. (*) P < 0.05; n.s., not significant. See also Figure S7 and Table S5, S6.
Figure 5.
Figure 5.. The phosphatase module is differentially required for Integrator activity across the genome.
(A) Means of normalized values of endogenous snRNA readthrough. Readthrough values (see Figure 2C) were calculated from RNA-seq data of DL1 cells subjected to a mock treatment or treatment with β-gal, mts, Pp2A-29B, IntS6, or IntS4 dsRNAs (3 independent biological replicates). Center lines represent medians, boxes represent interquartile ranges (IQRs), and whiskers represent extreme data points within 1.5× IQRs. Black points were outliners exceeding 1.5× IQRs. P values were calculated by Wilcoxon signed-rank test. (**) P < 0.01; (***) P < 0.001; n.s., not significant. (B) ChIP-seq and RNA-seq tracks at the U5:34A snRNA locus. IntS1 and IntS12 ChIP-seq profiles in DL1 cells (GSE114467) are shown in black. RNA-seq data generated from DL1 cells treated for 3 d with control (β-gal), IntS4, IntS6, mts, or Pp2A-29B dsRNAs are shown in blue. Green arrow, transcription start site (TSS). (C) RNA-seq was used to define genes that were up- or down-regulated (∣log2(fold change)∣ > 0.585 and adjusted P < 0.001) upon IntS4, IntS6, mts, or Pp2A-29B depletion using RNAi or upon IntS6 over-expression (top). These gene lists were then stratified by ChIP-seq data that identified 3,932 protein-coding genes with peaks of IntS1 and/or IntS12 binding located ±1 kb of gene bodies in DL1 cells (green, middle). For genes bound by Integrator subunits and differentially regulated upon IntS4 or IntS6 depletion, the effect of depleting PP2A subunits on their expression is graphed (bottom). Also see Tables S1, S2, S3, S4.
Figure 6.
Figure 6.. Over-expression of canonical PP2A B subunits can inhibit Integrator activity.
(A) Schematic of the canonical Drosophila PP2A holoenzyme that consists of a scaffolding A subunit (Pp2A-29B), a catalytic subunit (mts), and a variable regulatory B subunit (tws, wdb, Cka, or wrd). (B) DL1 cells were transfected with 500 ng of the indicated FLAG-tagged expression plasmid and total protein was harvested after 48 h. A plasmid containing a multi-cloning site (MCS) was used as a control. Western blot analysis using an antibody that recognizes FLAG was used to confirm expression of each subunit. α-tubulin was used as a loading control. (C) DL1 cells were co-transfected with 400 ng of eGFP reporter plasmid and 100 ng of the indicated PP2A subunit over-expression plasmid (driven by the Ubi-p63e promoter). CuSO4 was added for the last 14 h only when measuring eGFP production from the MtnA promoter. Northern blots (20 μg/lane) were used to quantify expression of each eGFP reporter mRNA. Representative blots are shown and RpL32 mRNA was used as a loading control. Data are shown as mean ± SD, N = 3. (*) P < 0.05; n.s., not significant. Also see Table S5, S6.
Figure 7.
Figure 7.. Integrator can catalyze transcription termination via PP2A-dependent and - independent mechanisms.
(A) In the absence of Integrator, Pol II is able to productively elongate. (B) Integrator recruitment facilitates transcription termination. (Left) At some protein-coding genes, the Integrator phosphatase module must act prior to or, at minimum, simultaneously with the IntS11 endonuclease to enable cleavage of the nascent RNA, which is subsequently degraded by the RNA exosome. (Right) In contrast, the phosphatase module is dispensable for Integrator function at snRNA and many other protein-coding gene loci. Cleavage by IntS11 enables stable snRNAs to be produced and prematurely terminated mRNAs to be rapidly degraded. The exact CTD phosphorylation status at these genes when Integrator is acting remains to be determined.

Similar articles

Cited by

References

    1. Schier AC, and Taatjes DJ (2020). Structure and mechanism of the RNA polymerase II transcription machinery. Genes Dev 34, 465–488. 10.1101/gad.335679.119. - DOI - PMC - PubMed
    1. Proudfoot NJ (2016). Transcriptional termination in mammals: Stopping the RNA polymerase II juggernaut. Science 352, aad9926. 10.1126/science.aad9926. - DOI - PMC - PubMed
    1. Cramer P. (2019). Organization and regulation of gene transcription. Nature 573, 45–54. 10.1038/S41586-019-1517-4. - DOI - PubMed
    1. Mendoza-Figueroa MS, Tatomer DC, and Wilusz JE (2020). The Integrator Complex in Transcription and Development. Trends Biochem Sci 45, 923–934. 10.1016/j.tibs.2020.07.004. - DOI - PMC - PubMed
    1. Welsh SA, and Gardini A (2022). Genomic regulation of transcription and RNA processing by the multitasking Integrator complex. Nat Rev Mol Cell Biol 24, 204–220. 10.1038/S41580-022-00534-2. - DOI - PMC - PubMed