. 2023 Dec 7;83(23):4205-4221.e9.
doi: 10.1016/j.molcel.2023.10.037. Epub 2023 Nov 22.

Locus-specific proteome decoding reveals Fpt1 as a chromatin-associated negative regulator of RNA polymerase III assembly

Affiliations

Locus-specific proteome decoding reveals Fpt1 as a chromatin-associated negative regulator of RNA polymerase III assembly

Maria Elize van Breugel et al. Mol Cell. .

Abstract

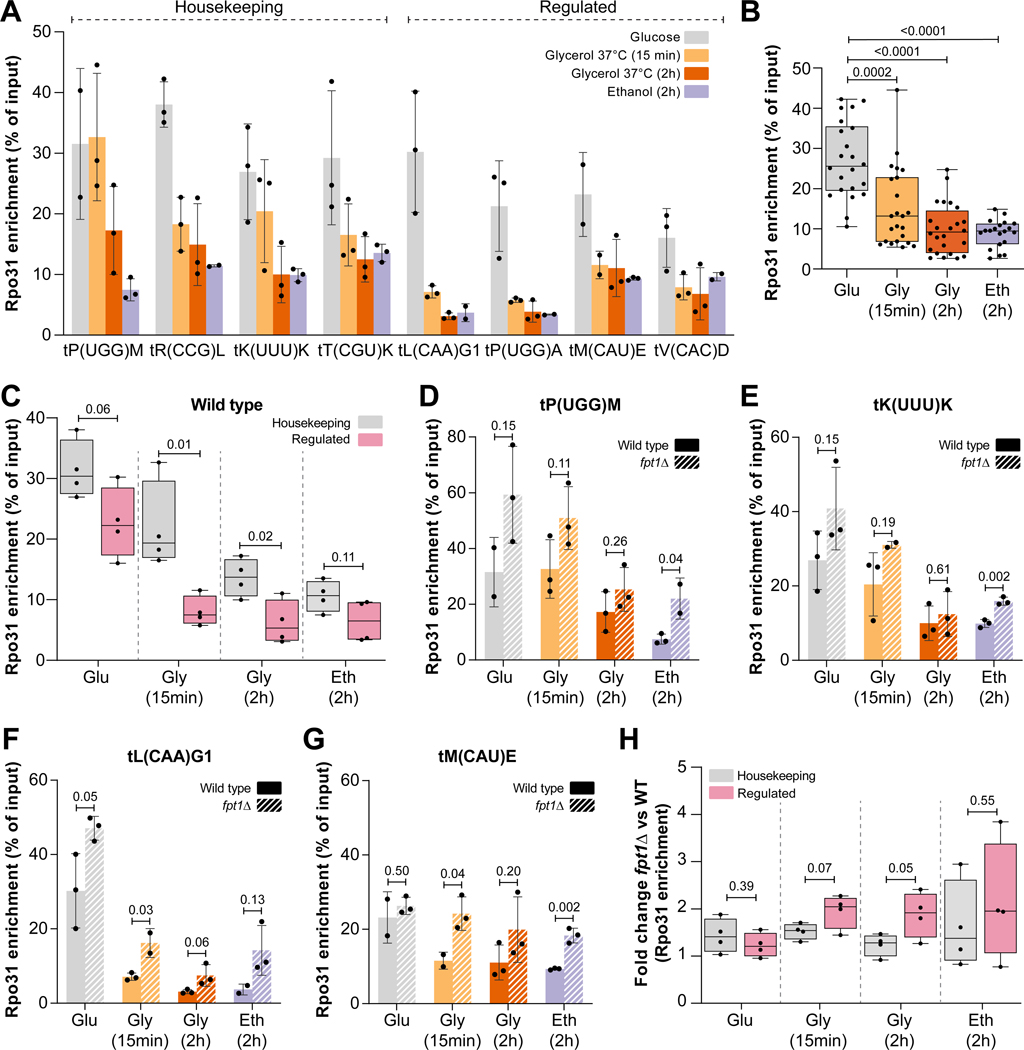
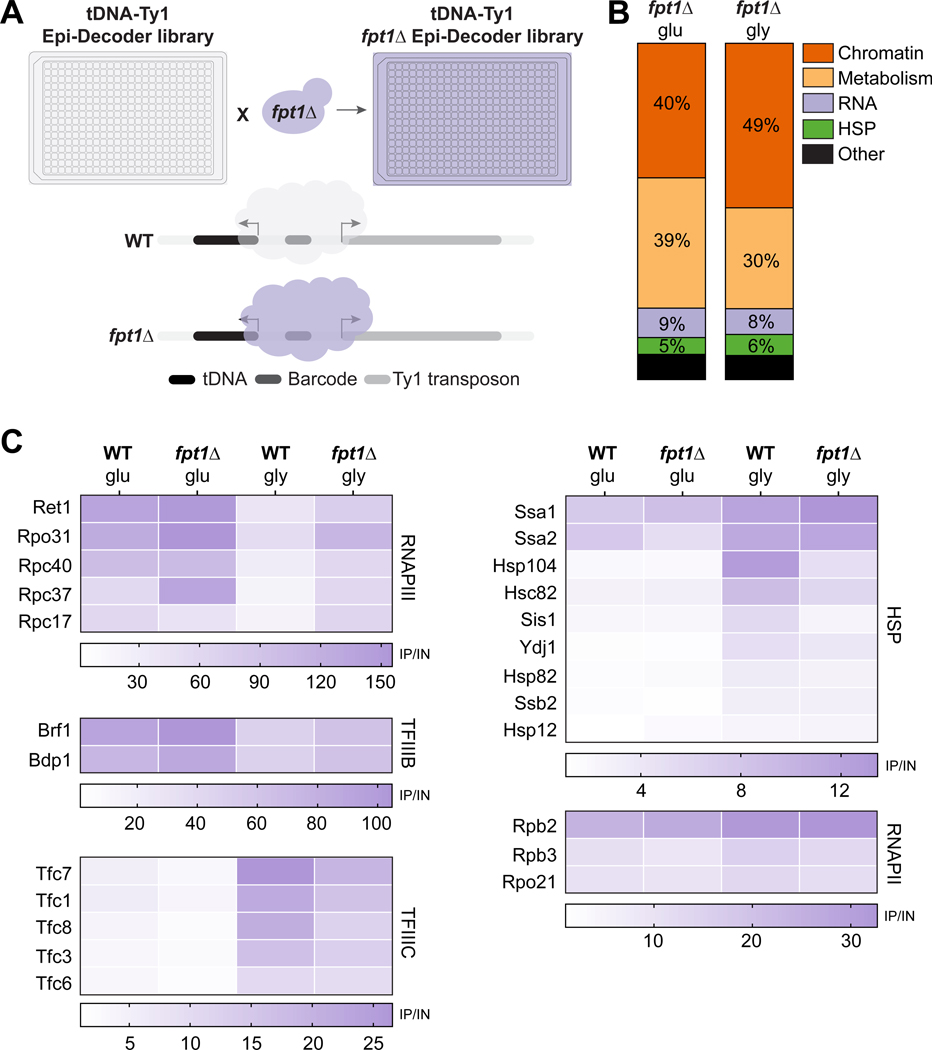
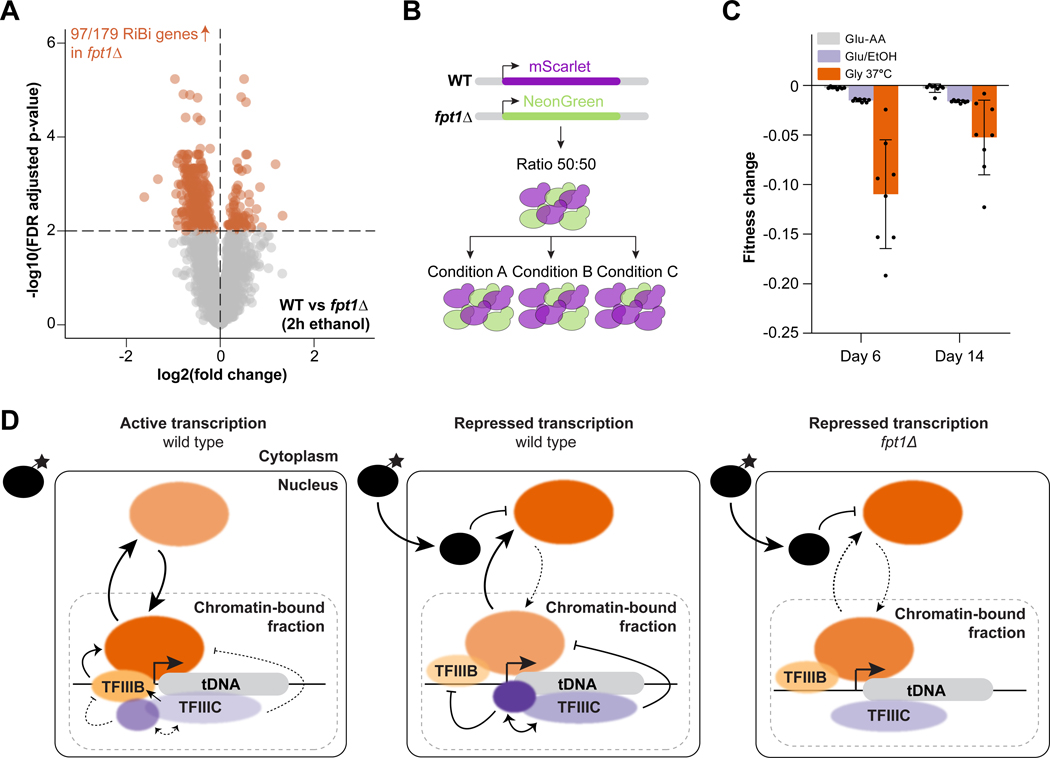
Transcription of tRNA genes by RNA polymerase III (RNAPIII) is tuned by signaling cascades. The emerging notion of differential tRNA gene regulation implies the existence of additional regulatory mechanisms. However, tRNA gene-specific regulators have not been described. Decoding the local chromatin proteome of a native tRNA gene in yeast revealed reprogramming of the RNAPIII transcription machinery upon nutrient perturbation. Among the dynamic proteins, we identified Fpt1, a protein of unknown function that uniquely occupied RNAPIII-regulated genes. Fpt1 binding at tRNA genes correlated with the efficiency of RNAPIII eviction upon nutrient perturbation and required the transcription factors TFIIIB and TFIIIC but not RNAPIII. In the absence of Fpt1, eviction of RNAPIII was reduced, and the shutdown of ribosome biogenesis genes was impaired upon nutrient perturbation. Our findings provide support for a chromatin-associated mechanism required for RNAPIII eviction from tRNA genes and tuning the physiological response to changing metabolic demands.

Keywords: RNA polymerase III; chromatin; chromatin proteome; nutrient signaling; tDNA; tRNA; transcription.


Conflict of interest statement

Declaration of interests B.F.P. is an owner of and has a financial interest in Peconic, which uses the ChIP-exo technology (U.S. Patent 20100323361A1) implemented in this study and could potentially benefit from the outcomes of this research.

Figures

Figure 1.
Figure 1.. Epi-Decoder reveals rewiring of the proteome of a tDNA locus in response to nutrient availability.
(A) Schematic overview of Epi-Decoder. Using a DNA-barcode repair template library and CRISPR-Cas9 construct, a random DNA-barcode is inserted at the locus of interest. The library of barcoded transformants is arrayed, decoded, and crossed with an arrayed TAP-tag protein library. In the resulting Epi-Decoder library, each clone contains a unique barcode and a different protein tagged. After pooling the library, ChIP is performed and DNA barcodes from ChIP and input are amplified, sequenced, and counted to provide a binding score (ChIP/input) at the locus for all proteins in the library. (B) Epi-Decoder scores for 3707 proteins at the tDNA-Ty1 locus in glucose; arcsinh (fold change ChIP vs input) and FDR (p-value). Subunits that belong to RNAPIII, TFIIIB or TFIIIC are color-coded. Data describes three biological replicates (different DNA-barcode protein-TAG combinations) measured as three technical replicates (same DNA-barcode). Proteins classified as ‘binder’ are indicated with colored dots and significance thresholds with dashed lines (basemean ≥ 400, FDR ≤ 0.01 and log2 fold change ≥ 1). (C) Binding scores for the tDNA-Ty1 locus compared to the HO locus: log2 (fold change ChIPHO vs ChIPtDNA-Ty1) and FDR (p-value) for 154 factors that are ‘binder’ at either of the loci (also described in the Euler diagram). Data describes three biological replicates as described in (B). Colored dots show significant proteins and dashed lines show significance thresholds (FDR ≤ 0.25). (D) As in (C), fold change (log2 ChIPglucose vs ChIPglycerol) between glucose and glycerol 2h (37°C) and FDR (p-value) for 154 ‘binders’ at the tDNA-Ty1 locus in either growth condition (as described in the Euler diagram). (E) Heat maps with average fold change values (ChIP vs input, n = 3) for different protein complexes or families at the tDNA-Ty1 locus, each with a different color scale. Protein names are color-coded based on the Euler diagram in (D).
Figure 2.
Figure 2.. Fpt1 binds uniquely to RNAPIII transcribed genes and is enriched at regulated tDNAs.
(A) Genome tracks with pooled ChIP-seq data (n = 3) for TAP-tagged Fpt1, Rpo31, Rpb2 and Rpl13a at the Epi-Decoder locus: tP(UGG)M tRNA gene and YMLWTy1–2 retrotransposon. (B) As in (A), tRNA genes tL(CAA)G1, tK(UUU)K and tT(CGU)K. (C) ChIP-exo metagene profile of Fpt1 (+/− 500 bp from tDNA midpoint) at 261 tRNA genes from a single representative ChIP-exo experiment. Plots of ChIP-exo tag 5’ ends (exonuclease stop sites) are inverted for tags mapping to the non-transcribed (anti-sense) strand. The y-axis shows linear arbitrary units (AU) which are not equal across plotted datasets. Black box at the top: average position of a representative tRNA gene, start and end are indicated with dashed lines. The insert in the lower right corner shows a schematic tRNA gene, containing the internal A- and B-box promoter elements. (D-H) As in (C), ChIP-exo metagene profiles of Rpo31, Brf1, TBP, Tfc4 and Tfc6 (from Rossi et al.) overlaid with Fpt1. (I) Fpt1 occupancy (ChIP-seq) at housekeeping (n = 30) and regulated (n = 158) tRNA genes. The used classification of tRNA genes is described in Turowski et al. and Star Methods. The average Fpt1 occupancy (13142) across 243 tRNA genes is indicated with a dotted horizontal line. Statistics: Welch-corrected unpaired two-tailed t-test.
Figure 3.
Figure 3.. Fpt1 responds to changing nutrient availability.
(A) Fpt1 enrichment (TAP-ChIP) in glucose, glycerol 2h and 15 min (37°C), and ethanol 2h (n = 4 ± SD). (B) Stacked Fpt1 enrichment from (A). Statistics: Welch-corrected unpaired two-tailed t-test. (C) Fpt1-TAP immunoblot (n = 3) in glucose, glycerol 2h and 15 min (37°C), and ethanol 2h. Pgk1 was used as a loading control. BY4741 is a no-tag control. (D) Quantification of (C), n = 3 ± SD. Statistics: unpaired two-tailed t-test. (E) Fpt1-TAP immunoblot (n = 3) in wild type (WT) and Fpt1 overexpression (OE) in glucose. (F) Fpt1 enrichment (TAP-ChIP) in glucose for WT and Fpt1 OE (n = 3 ± SD). (G) Stacked Fpt1 enrichment from (F). Statistics: Welch-corrected unpaired two-tailed t-test. (H) Left, representative images of Fpt1 localization in live yeast cells in glucose. From top to bottom: Fpt1-GFP (yellow), PP7-NLS-mScarlet-I as a nuclear marker (magenta) and the merged channel. Cellular masks to locate cells and nuclei are indicated with white lines. Scale bar: 3 μm. Right, quantification of Fpt1 nuclear enrichment (n = 3) in glucose (n = 1536 cells), glycerol 2h 37°C (n = 327 cells), and ethanol 2h (n = 771 cells). Circles show data for individual cells; box plots show the distribution of the data where the box indicates the quartiles and whiskers extend to show the distribution, except for outliers. Statistics: bootstrapping (MacKinnon et al.).
Figure 4.
Figure 4.. Deletion of Fpt1 compromises eviction of RNAPIII upon nutrient perturbation.
(A) Rpo31 enrichment (TAP-ChIP) in glucose, glycerol 2h or 15 min (37°C) and ethanol 2h (n = 3 ± SD). (B) Stacked Rpo31 enrichment from (A). Statistics: Welch-corrected unpaired two-tailed t-test. (C) Rpo31 enrichment (TAP-ChIP) in WT at housekeeping tRNA genes (grey, n = 4) and regulated tRNA genes (pink, n = 4) in glucose, glycerol 2h and 15 min (37°C), and ethanol 2h. For each tRNA gene, the average of three biological replicates is shown. Whiskers indicate the minimum and maximum. Statistics: unpaired two-tailed t-test. (D-G) Rpo31 enrichment (TAP-ChIP) in WT and fpt1Δ (n = 3 ± SD) in glucose, glycerol 2h and 15 min (37°C), and ethanol 2h. Statistics: unpaired two-tailed t-test. (H) Fold change between WT and fpt1Δ for Rpo31 enrichment at housekeeping tRNA genes (grey, n = 4) and regulated tRNA genes (pink, n = 4). For each tRNA gene, the average of three biological replicates is shown. Whiskers indicate the minimum and maximum. Statistics: unpaired two-tailed t-test.
Figure 5.
Figure 5.. Fpt1, embedded in the tDNA proteome, affects the RNAPIII transcription machinery.
(A) Schematic outline: an FPT1 knockout strain is crossed with the WT Epi-Decoder library using SGA, resulting in an fpt1Δ Epi-Decoder library. The tDNA chromatin proteome of both libraries can be compared. (B) Fraction of proteins classified as ‘binder’ in fpt1Δ glucose or glycerol 2h (37°C) for different functional classes indicated (HSP refers to heat shock proteins). (C) Heat maps with average fold change values (ChIP vs input, n = 3) at the tDNA-Ty1 locus for different protein complexes or families for WT or fpt1Δ in glucose and 2h glycerol (37°C).
Figure 6.
Figure 6.. Fpt1 occupancy does not depend on active RNAPIII, but requires TFIIIB and TFIIIC.
(A) Outline of phenanthroline (PH) treatment: cells were grown to mid-log phase and treated with 1,10-phenanthroline (100 μg/mL) or vehicle (0.1% ethanol) for 30 minutes before crosslinking. (B) Rpo31 enrichment (TAP-ChIP) in vehicle and PH-treated cells (n = 3 ± SD). Statistics: unpaired two-tailed t-test. (C-E) As in (B), TAP-ChIP of Brf1, Tfc3, Fpt1 respectively. (F) Schematic of the anchor away (AA) approach. A GFP- and FRB-tagged target protein is depleted from the nucleus after 1 h rapamycin (7.5 μM) treatment. (G) Fpt1 enrichment (TAP-ChIP) upon nuclear depletion of Rpo31 (rapamycin) and DMSO control (n = 3 ± SD). Statistics: unpaired two-tailed t-test. (H-K) As in (G), depletion of Tfc1, Tfc3, Brf1, Bdp1, respectively.
Figure 7.
Figure 7.. Fpt1 affects tuning of ribosome biogenesis genes and cellular fitness in repressive conditions.
(A) Differential gene expression in WT and fpt1Δ in ethanol 2h (n = 4): log2 fold change and FDR (p-value) for 4978 expressed genes. Colored dots represent significant differentially expressed genes (FDR ≤ 0.01). Upregulated genes in fpt1Δ compared to WT are depicted on the left (n = 313 genes), downregulated genes on the right (n = 92 genes). (B) Competitive growth assay: the fluorescent markers mScarlet and NeonGreen were inserted at a neutral intergenic locus in WT and fpt1Δ in both combinations. Red and green cells were mixed in a 50:50 ratio and subjected to different growth conditions to study the effect on the ratio WT and fpt1Δ cells. (C) Relative fitness defect, expressed with the Malthusian coefficient, of fpt1Δ compared to WT in glucose but with alternating levels of non-auxotrophic amino acids (Glu-AA), alternating carbon source (Glu/EtOH), and glycerol 37°C (Gly 37°C). Data of four biological replicates including a color-swap is shown (n = 8). (D) A model for chromatin-associated regulation of the tDNA transcription machinery. For details, see main text.

Similar articles

Cited by

References

    1. Turowski TW, and Tollervey D. (2016). Transcription by RNA polymerase III: insights into mechanism and regulation. Biochem. Soc. Trans 44, 1367–1375. 10.1042/BST20160062. - DOI - PMC - PubMed
    1. Girbig M, Misiaszek AD, and Müller CW (2022). Structural insights into nuclear transcription by eukaryotic DNA-dependent RNA polymerases. Nat. Rev. Mol. Cell Biol 23, 603–622. 10.1038/s41580-022-00476-9. - DOI - PubMed
    1. Cramer P. (2019). Organization and regulation of gene transcription. Nature 573, 45–54. 10.1038/s41586-019-1517-4. - DOI - PubMed
    1. Vannini A, and Cramer P. (2012). Conservation between the RNA polymerase I, II, and III transcription initiation machineries. Mol. Cell 45, 439–446. 10.1016/j.molcel.2012.01.023. - DOI - PubMed
    1. Willis IM, and Moir RD (2018). Signaling to and from the RNA Polymerase III Transcription and Processing Machinery. Annu. Rev. Biochem 87, 75–100. 10.1146/annurev-biochem-062917-012624. - DOI - PMC - PubMed

MeSH terms

LinkOut - more resources