. 2023 Dec 12;18(12):2418-2433.
doi: 10.1016/j.stemcr.2023.10.019. Epub 2023 Nov 22.

Programming of neural progenitors of the adult subependymal zone towards a glutamatergic neuron lineage by neurogenin 2

Affiliations

Programming of neural progenitors of the adult subependymal zone towards a glutamatergic neuron lineage by neurogenin 2

Sophie Péron et al. Stem Cell Reports. .

Abstract

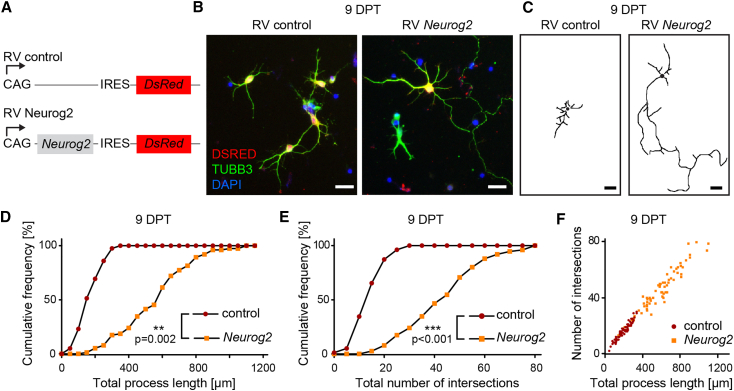
Although adult subependymal zone (SEZ) neural stem cells mostly generate GABAergic interneurons, a small progenitor population expresses the proneural gene Neurog2 and produces glutamatergic neurons. Here, we determined whether Neurog2 could respecify SEZ neural stem cells and their progeny toward a glutamatergic fate. Retrovirus-mediated expression of Neurog2 induced the glutamatergic lineage markers TBR2 and TBR1 in cultured SEZ progenitors, which differentiated into functional glutamatergic neurons. Likewise, Neurog2-transduced SEZ progenitors acquired glutamatergic neuron hallmarks in vivo. Intriguingly, they failed to migrate toward the olfactory bulb and instead differentiated within the SEZ or the adjacent striatum, where they received connections from local neurons, as indicated by rabies virus-mediated monosynaptic tracing. In contrast, lentivirus-mediated expression of Neurog2 failed to reprogram early SEZ neurons, which maintained GABAergic identity and migrated to the olfactory bulb. Our data show that NEUROG2 can program SEZ progenitors toward a glutamatergic identity but fails to reprogram their neuronal progeny.

Keywords: adult neurogenesis; adult subventricular zone; fate reprogramming; neural specification; neural stem cell; neurogenin 2; olfactory bulb; proneural gene.


Conflict of interest statement

Declaration of interests The authors declare no competing interests.

Figures

None
Graphical abstract
Figure 1
Figure 1
Neurons derived from SEZ progenitors transduced with a Neurog2-encoding retroviral vector develop more complex morphologies (A) Scheme of the retroviral vectors (RV) CAG-Neurog2-IRES-dsRed and control CAG-IRES-dsRed. (B) Micrographs depict TUBB3-positive neurons derived from SEZ progenitors that had been transduced 9 days earlier with the control or Neurog2-encoding retrovirus. (C) Pictures are examples of neuronal processes traced in neurons from (B). (D–F) Graphs show the total number of intersections and process length as determined by Sholl analysis in control- and Neurog2-transduced neurons. Note that the expression of Neurog2 increased the length and number of intersections. Error bars indicate mean ± SD, 75–78 neurons/group from 3 independent cultures, Kolmogorov-Smirnov test (D and E). Scale bars: 20 μm (B and C). See also Figure S1.
Figure 2
Figure 2
NEUROG2 induces glutamatergic neuron hallmarks when expressed in dividing progenitors but not in young postmitotic neurons (A) Cells from primary SEZ cultures transduced with the RV-CAG-Neurog2-IRES-dsRed differentiate into TUBB3-positive neurons expressing TBR2 (arrows, left panel) at 7 DPT and TBR1 at 9 DPT (arrows, middle panel). (B) Cells transduced with the lentiviral hSyn-Neurog2-IRES-eGfp vector fail to induce TBR2 (arrowheads, left panel) or TBR1 (arrowheads, right panel). Note the cluster of non-transduced progenitors expressing TBR2 occurring at low frequency in SEZ cultures. (C) Cells in primary cultures of the SEZ transduced with the lentiviral hSyn-Neurog2-IRES-eGfp vector retain GABA immunoreactivity (left panel, arrows) at 7 DPT, while those that had been transduced with the retroviral CAG-Neurog2-IRES-dsRed do not express GABA (right panel, arrowheads). (D) Histogram showing the proportion of transduced cells that were immunoreactive for TBR2, TBR1, or GABA following transduction with control or Neurog2-encoding retroviruses and lentiviruses. Error bars indicate mean ± SD, n = 3 independent experiments. One-way ANOVA followed by Tukey’s honestly significant difference (HSD) post hoc test. Scale bars: 60 μm (A and C). See also Figures S1 and S2. See also Figure S2.
Figure 3
Figure 3
Retrovirus-mediated Neurog2 expression alters the migration behavior of SEZ progenitors and induces their differentiation toward a glutamatergic fate in vivo (A–D) Sagittal view of an adult mouse brain depicts cells transduced with the control RV-CAG-IRES-dsRed (red) (B) within the SEZ, migrating throughout the RMS (C), and reaching the OB (D). (E–H) Micrographs show SEZ cells transduced with the RV-CAG-Neurog2-IRES-dsRed (red) in the areas corresponding to those in (A)–(D). Note that at 7 DPT, only few transduced neuroblasts entered the RMS (G). They failed to reach the core of the OB (H) and instead remained stationary in the anterior portion of the SEZ (F). (I) Histogram showing the number of DCX-positive/dsRed-positive transduced cells in the SEZ, RMS, and OB at 7 DPT. Error bars indicate mean ± SD, n = 3/mice group, one-way ANOVA followed by Tukey’s HSD post hoc test. (J and K) Higher magnification images show a cell from (E)–(H), transduced with the RV-CAG-Neurog2-IRES-dsRed, which had acquired a pyramidal neuron-like morphology (J) with well-developed dendritic spines (K). (L and M) Micrographs show expression of the transcription factors TBR2 (L) and TBR1 (M) (green) in SEZ cells transduced with retrovirus encoding Neurog2 but not in cells transduced with the control retrovirus. (N) Histogram showing the proportion of SEZ-derived neurons that express TBR2 and TBR1 following transduction with the control or the Neurog2-encoding retroviral vectors. Note that more than one-third of Neurog2-expressing cells up-regulated TBR2 and TBR1 at 7DPT. Error bars indicate mean ± SD, n = 3/mice group, t test. Scale bars: 1 mm (A and E), 100 μm (B–D and F–H), 20 μm (L and M), 10 μm (J), and 5 μm (K). See also Figures S4 and S5.
Figure 4
Figure 4
Neurons derived from Neurog2-programmed SEZ progenitors are locally connected (A) Experimental design of RABV-mediated connectivity tracing. CAG-Neurog2-IRES-dsRed retrovirus and pCAG-DsRedExpress2-T2A-G-IRES-TVA retrovirus were coninjected into the SEZ. Eight days later, an EnvA-pseudotyped and G gene-deleted eGfp-expressing RABV was injected in the vicinity of the injection site of the retroviruses, and analysis was performed 6 days later. (B) DSRED-only-positive cells were detected in the OB, likely corresponding to cells transduced only with the pCAG-DsRedExpress2-T2A-G-IRES-TVA that had migrated normally to the OB. (C and D) Upon NEUROG2 transduction, putative starter cells (yellow, expressing both dsRed and GFP) were found in the striatum, and first-order presynaptic partners (GFP only) could be traced locally. (E) High-magnification micrographs depicting traced neurons forming physical contacts onto Neurog2-programmed neurons. (F–H) Traced neurons exhibited various morphologies, many of which exhibited dendritic spines (inset in H). (I) Histogram showing the proportion of GFP+/GFP++dsRed+ neurons (connectivity index) found following control or Neurog2 retrovirus injection into the SEZ. Error bars indicate mean ± s.e.m., n = 3–5 mice/group, Mann-Whitney test. Scale bars: 100 μm (B), 50 μm (C), and 10 μm (D–H). See also Figure S6.
Figure 5
Figure 5
Expression of Neurog2 fails to induce a glutamatergic phenotype in early neurons derived from the SEZ in vivo (A) Micrograph shows early neurons (DCX, red) leaving the SEZ and expressing GFP (green), indicative of hSyn-promoter activity early during fate commitment. (B) Quantification of the number of DCX-positive/GFP-positive lentivirus-transduced cells in the SEZ, RMS, and OB at 10 DPT. Note that expression of Neurog2 in early neurons does not affect their migration to the OB. Error bars indicate mean ±SD, n = 3 mice/group, one-way ANOVA followed by Tukey’s HSD post hoc test. (C and D) Micrographs of the granule cell layer of the OB show lentivirus-transduced cells (green) migrating radially and integrating as granule and periglomerular neurons (PGN, insets, DCX red) at 10 DPT. (E–H) Transduction of SEZ cells with either hSyn-eGfp control (in green) or hSyn-Neurog2-IRES-eGfp (in green) lentiviruses does not lead to the expression of TBR2 (in red) in granule neurons (E, F) or periglomerular neurons (PGN, insets), nor does it induce TBR1 expression in granule neurons (G, H). Scale bars: 50 μm (B–F), 10 μm (insets in C–F), and 25 μm (G and H).
Figure 6
Figure 6
RMS-resident dividing neuroblasts are refractory to glutamatergic re-specification following in vivo retroviral expression of Neurog2 (A) The experimental design involved injecting the RV-CAG-Neurog2-IRES-dsRed retrovirus into the RMS elbow. (B) A sagittal view of the adult mouse olfactory bulb (OB) revealed transduced cells (red) following retrovirus injection into the RMS elbow when analyzed at 7 DPT. Transduced neurons could be observed across the OB. (C–G) Micrographs show that transduced cells lacked TBR1 expression (green) in both the dorsal (C) and ventral (D) areas of the granule cell layer (GCL) and also in the RMS (E), as opposed to preexisting non-transduced glutamatergic neurons in other areas (G). (H) Histogram showing the number of dsRed-positive transduced cells in the RMS and OB at 7 DPT. Error bars indicate mean ± SD, n = 3/mice group, t test. Scale bars: 100 μm (B) and 50 μm (C–E).

References

    1. Amamoto R., Arlotta P. Development-inspired reprogramming of the mammalian central nervous system. Science. 2014;343:1239882. doi: 10.1126/science.1239882. - DOI - PMC - PubMed
    1. Arlotta P., Berninger B. Brains in metamorphosis: reprogramming cell identity within the central nervous system. Curr. Opin. Neurobiol. 2014;27:208–214. doi: 10.1016/j.conb.2014.04.007. - DOI - PMC - PubMed
    1. Azim K., Hurtado-Chong A., Fischer B., Kumar N., Zweifel S., Taylor V., Raineteau O. Transcriptional Hallmarks of Heterogeneous Neural Stem Cell Niches of the Subventricular Zone. Stem Cell. 2015;33:2232–2242. doi: 10.1002/stem.2017. - DOI - PubMed
    1. Baser A., Skabkin M., Kleber S., Dang Y., Gülcüler Balta G.S., Kalamakis G., Göpferich M., Ibañez D.C., Schefzik R., Lopez A.S., et al. Onset of differentiation is post-transcriptionally controlled in adult neural stem cells. Nature. 2019;566:100–104. doi: 10.1038/s41586-019-0888-x. - DOI - PubMed
    1. Baumann V., Wiesbeck M., Breunig C.T., Braun J.M., Köferle A., Ninkovic J., Götz M., Stricker S.H. Targeted removal of epigenetic barriers during transcriptional reprogramming. Nat. Commun. 2019;10:2119. doi: 10.1038/s41467-019-10146-8. - DOI - PMC - PubMed

MeSH terms

Substances

LinkOut - more resources