. 2024 Feb;17(1):111-123.
doi: 10.1016/j.mucimm.2023.11.005. Epub 2023 Nov 22.

A pro-inflammatory gut mucosal cytokine response is associated with mild COVID-19 disease and superior induction of serum antibodies

Affiliations

A pro-inflammatory gut mucosal cytokine response is associated with mild COVID-19 disease and superior induction of serum antibodies

Dana Costigan et al. Mucosal Immunol. 2024 Feb.

Abstract

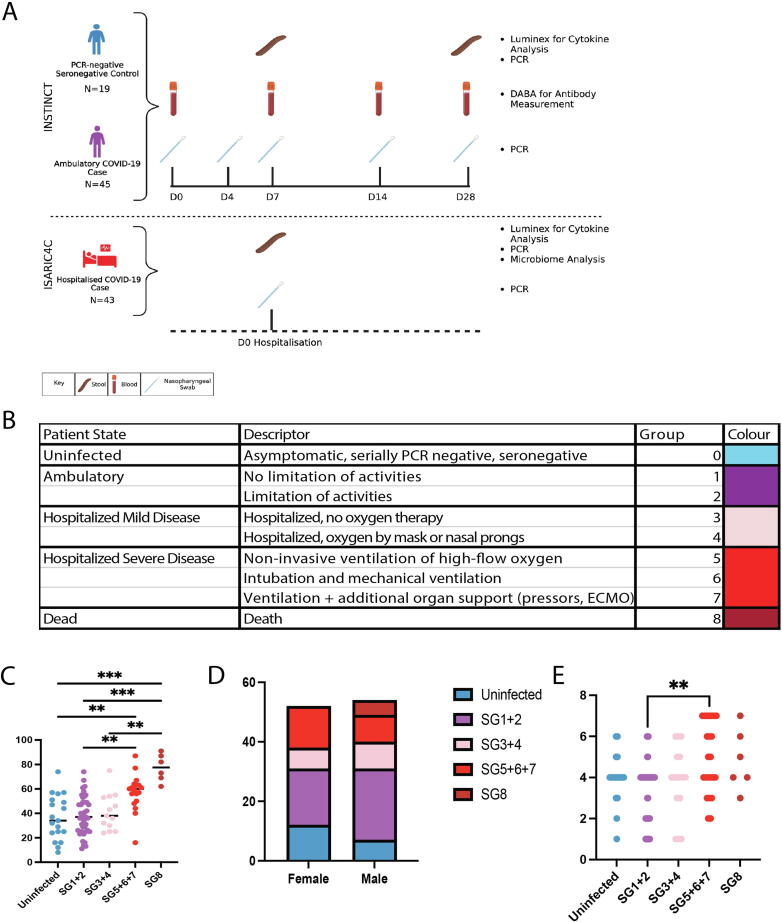
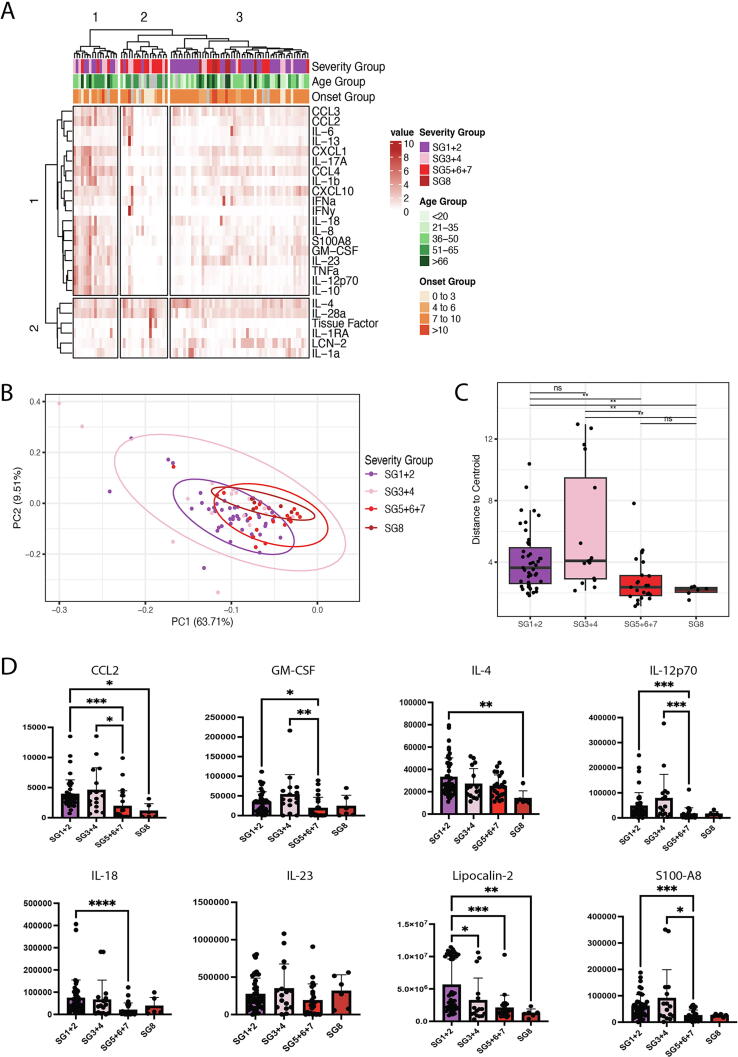
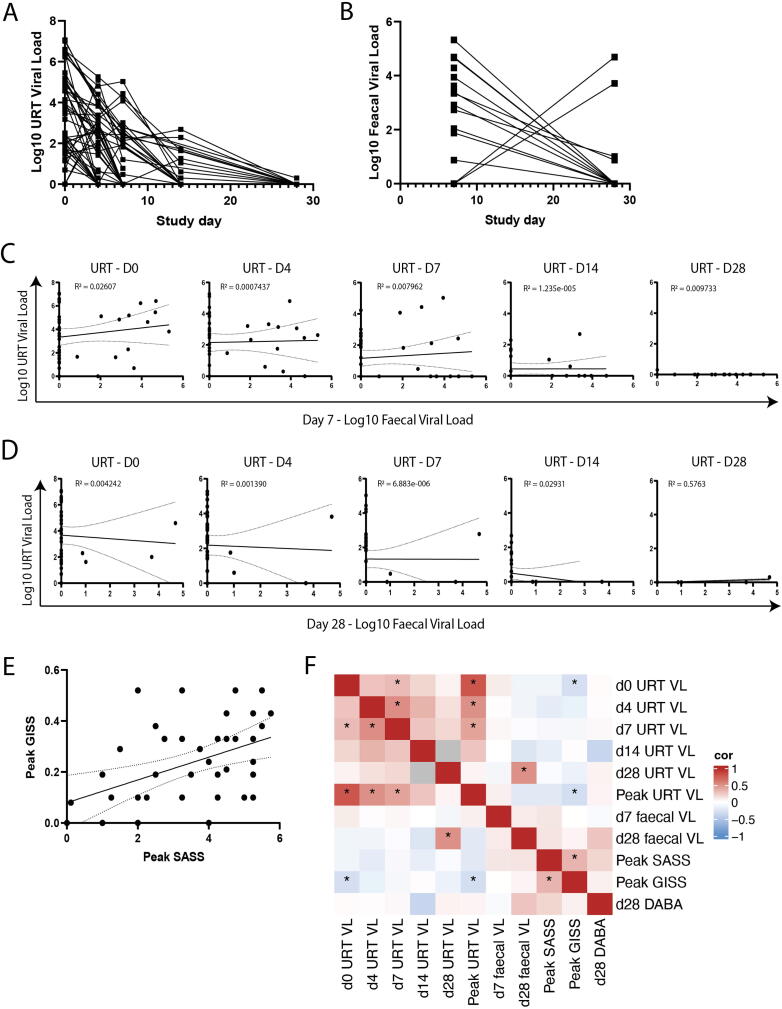
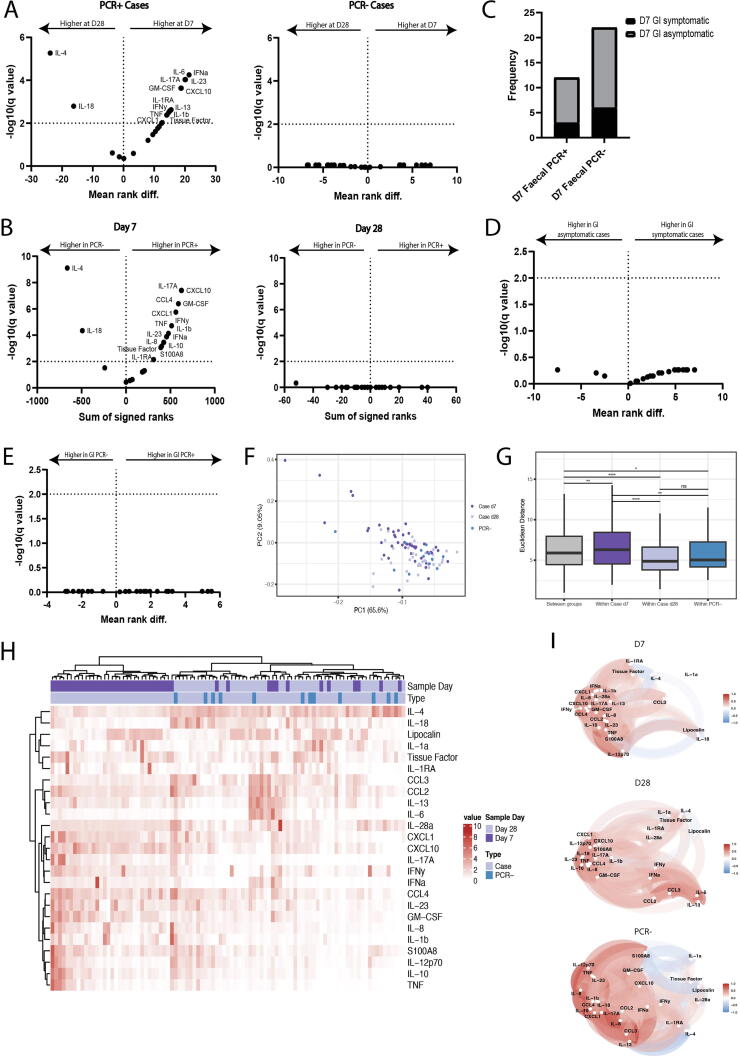
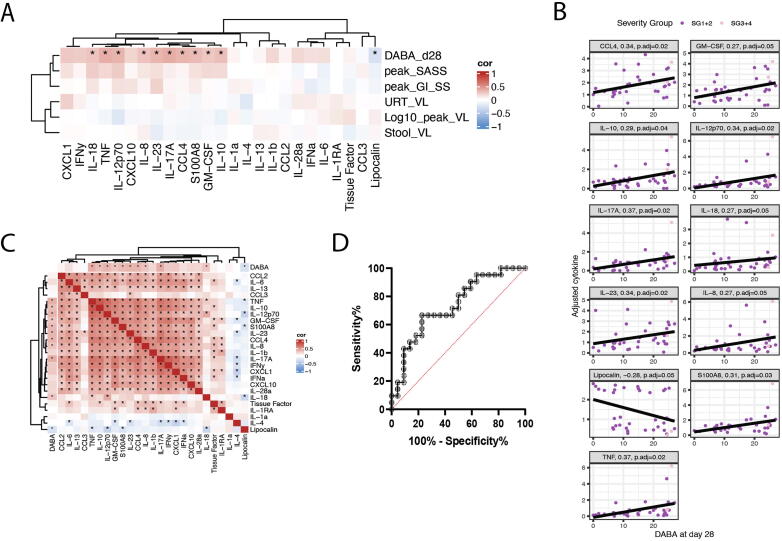
The relationship between gastrointestinal tract infection, the host immune response, and the clinical outcome of disease is not well understood in COVID-19. We sought to understand the effect of intestinal immune responses to SARS-CoV-2 on patient outcomes including the magnitude of systemic antibody induction. Combining two prospective cohort studies, International Severe Acute Respiratory and emerging Infections Consortium Comprehensive Clinical Characterisations Collaboration (ISARIC4C) and Integrated Network for Surveillance, Trials and Investigations into COVID-19 Transmission (INSTINCT), we acquired samples from 88 COVID-19 cases representing the full spectrum of disease severity and analysed viral RNA and host gut cytokine responses in the context of clinical and virological outcome measures. There was no correlation between the upper respiratory tract and faecal viral loads. Using hierarchical clustering, we identified a group of fecal cytokines including Interleukin-17A, Granulocyte macrophage colony-stimulating factor, Tumor necrosis factorα, Interleukin-23, and S100A8, that were transiently elevated in mild cases and also correlated with the magnitude of systemic anti-Spike-receptor-binding domain antibody induction. Receiver operating characteristic curve analysis showed that expression of these gut cytokines at study enrolment in hospitalised COVID-19 cases was associated negatively with overall clinical severity implicating a protective role in COVID-19. This suggests that a productive intestinal immune response may be beneficial in the response to a respiratory pathogen and a biomarker of a successful barrier response.


Figures

Fig. 1
Fig. 1
INSTINCT (n = 45) and ISARIC4C (n = 43) study sample collection schedules and cohort demographics. (A) PCR-negative controls and ambulatory community COVID-19 cases were collected via INSTINCT. Serial faecal, blood and nasopharyngeal swabs were collected over 28 days. Moderate and severely ill COVID-19 cases were recruited via ISARIC4C. Faecal samples and nasopharyngeal swabs were collected at enrolment which occurred immediately following hospitalisation. ISARIC4C and INSTINCT sample collection schedules are aligned to show that comparisons are made between faecal samples collected at D0 and D7 respectively. (B) Table showing patient state and descriptor for each severity group. (C) Participant age and (D) Biological sex and (E) Bristol stool score stratified by symptom severity group. Colours represent Severity Groups. Results of Kruskal Wallis tests with Dunn’s multiple comparison tests are displayed *p < 0.05, **p < 0.01, ***p < 0.001. ECMO = extracorporeal membrane oxygenation.
Fig. 2
Fig. 2
Mild COVID-19 cases have a pronounced pro-inflammatory gut mucosal cytokine response. (A) Hierarchical clustered heatmap of cytokines from faecal samples in both INSTINCT (n = 45) and ISARIC4C (n = 43) cohorts. Further annotated with severity group, age group and time from symptom onset to sample acquisition group. (B) Principal component analysis showing clustering of cytokines according to severity group (n = 88). Cytokine loadings associated with PCA shown in Supplementary Fig. 6 (C) Distance of cytokines from the clustered severity group centroid (n = 88). (D) Concentrations of 8 cytokines in faecal samples stratified by severity groups. Results of Kruskal Wallis tests with Dunn’s multiple comparison tests are displayed *p < 0.05, **p < 0.01, ***p < 0.001, ****p < 0.0001.
Fig. 3
Fig. 3
Viral burden in the upper respiratory tract and gut are non-correlated (n = 45). (A) URT and (B) Faecal viral load were quantified by PCR targeting SARS-CoV-2 E gene. Viral load trajectories are plotted over 28 days. (C) Viral load between the URT sample timepoints versus faecal viral load at day 7 and (D) Day 28. (E) Peak symptom associated severity score (SASS) versus peak GI symptom score (GISS). (F) Correlation heatmap between URT viral loads, faecal viral loads, peak SASS, peak GISS and D28 serum DABA. Correlation measured by Kendall rank correlation coefficient, tau. Correlations that are statistically different than zero (p < 0.05) are marked with an asterisk (*).
Fig. 4
Fig. 4
Longitudinal cytokine analysis shows elevated early gut cytokine production in mild COVID-19 disease (PCR- n = 12, PCR+ Day 7 n = 45, PCR+ Day 28 n = 38). (A) Mean rank difference of faecal cytokines measured at day 7 and day 28 in PCR+ and PCR- cases. (B) Sum of signed ranks of faecal cytokines measured in PCR+ and PCR- cases at day 7 and day 28. (C) Frequency of participants experiencing GI symptoms who have a measurable viral load (PCR+) or not (PCR-) at day 7 (p > 0.999). (D) Mean rank difference of faecal cytokines in participants with or without GI symptoms at day 7 and (E) in faecal PCR+ and PCR- participants. (F) PCA of faecal cytokines measured in samples collected from PCR+ cases at D7 or D28 or from PCR- cases. Cytokine loadings associated with PCA are shown in Supplementary Fig. 6. (G) Euclidian distance of pairwise samples between and within PCR+ cases at D7, PCR+ cases at day D28 and PCR- cases. (H) Heatmap of cytokines measured in faecal samples from PCR- control individuals and PCR+ cases at day 7 and day 28. (I) Correlation networks of cytokines from faecal cytokines measured in PCR+ cases at day 7 samples, PCR+ cases at day 28 samples and in PCR- individuals where the correlation is shown by proximity of points and direction and strength of the correlation between cytokines is indicated by color (red = positive correlation, blue = negative correlation). Correlation measured by Kendall rank correlation coefficient, tau. Only correlations ≥0.3 are shown.
Fig. 5
Fig. 5
Gut cytokine profile following recent SARS-CoV-2 infection associates with systemic anti-SARS-CoV-2 antibody induction. (A) Correlation between faecal cytokines measured from day 7 samples (n = 45) and day 28 serum DABA levels, peak SASS, peak GISS, URT viral load at day 7, faecal viral load at day 7, and log 10 of peak viral load in the URT. Correlation measured by Kendall rank correlation coefficient, tau. Correlations that are statistically different than zero (p < 0.05) are marked with an asterisk (*). (B) Individual correlation graphs between cytokines that significantly correlate with D28 DABA measurements. (C) Correlation matrix of faecal cytokines measured from PCR+ day 7 samples (n = 45). Correlation of cytokines against D28 serum DABA measurements are shown along the top and left axes. Correlation measured by Kendall rank correlation coefficient, tau. Correlations that are statistically different than zero (p < 0.05) are marked with an asterisk (*). (D) A receiver operating characteristic (ROC) graph showing the sensitivity and specificity with which the antibody-associated cytokine profile score predicted the need for invasive ventilation in the ISARIC4C cohort (n = 43).

References

    1. Hoffmann M., et al. SARS-CoV-2 cell entry depends on ACE2 and TMPRSS2 and is blocked by a clinically proven protease inhibitor. Cell. 2020;181:271–280.e8. - PMC - PubMed
    1. Li M.Y., Li L., Zhang Y., Wang X.S. Expression of the SARS-CoV-2 cell receptor gene ACE2 in a wide variety of human tissues. Infect. Dis. Pover. 2020;9:45. - PMC - PubMed
    1. Xiao F., et al. Evidence for gastrointestinal infection of SARS-CoV-2. Gastroenterology. 2020;158:1831–1833.e3. - PMC - PubMed
    1. Lamers M.M., et al. SARS-CoV-2 productively infects human gut enterocytes. Science. 2020;369:50–54. - PMC - PubMed
    1. Zang R., et al. TMPRSS2 and TMPRSS4 promote SARS-CoV-2 infection of human small intestinal enterocytes. Sci. Immunol. 2020;5:eabc3582. - PMC - PubMed