. 2024 Jan:365:602-616.
doi: 10.1016/j.jconrel.2023.11.034. Epub 2023 Dec 7.

Effective delivery of miR-511-3p with mannose-decorated exosomes with RNA nanoparticles confers protection against asthma

Affiliations

Effective delivery of miR-511-3p with mannose-decorated exosomes with RNA nanoparticles confers protection against asthma

Wei Tu et al. J Control Release. 2024 Jan.

Abstract

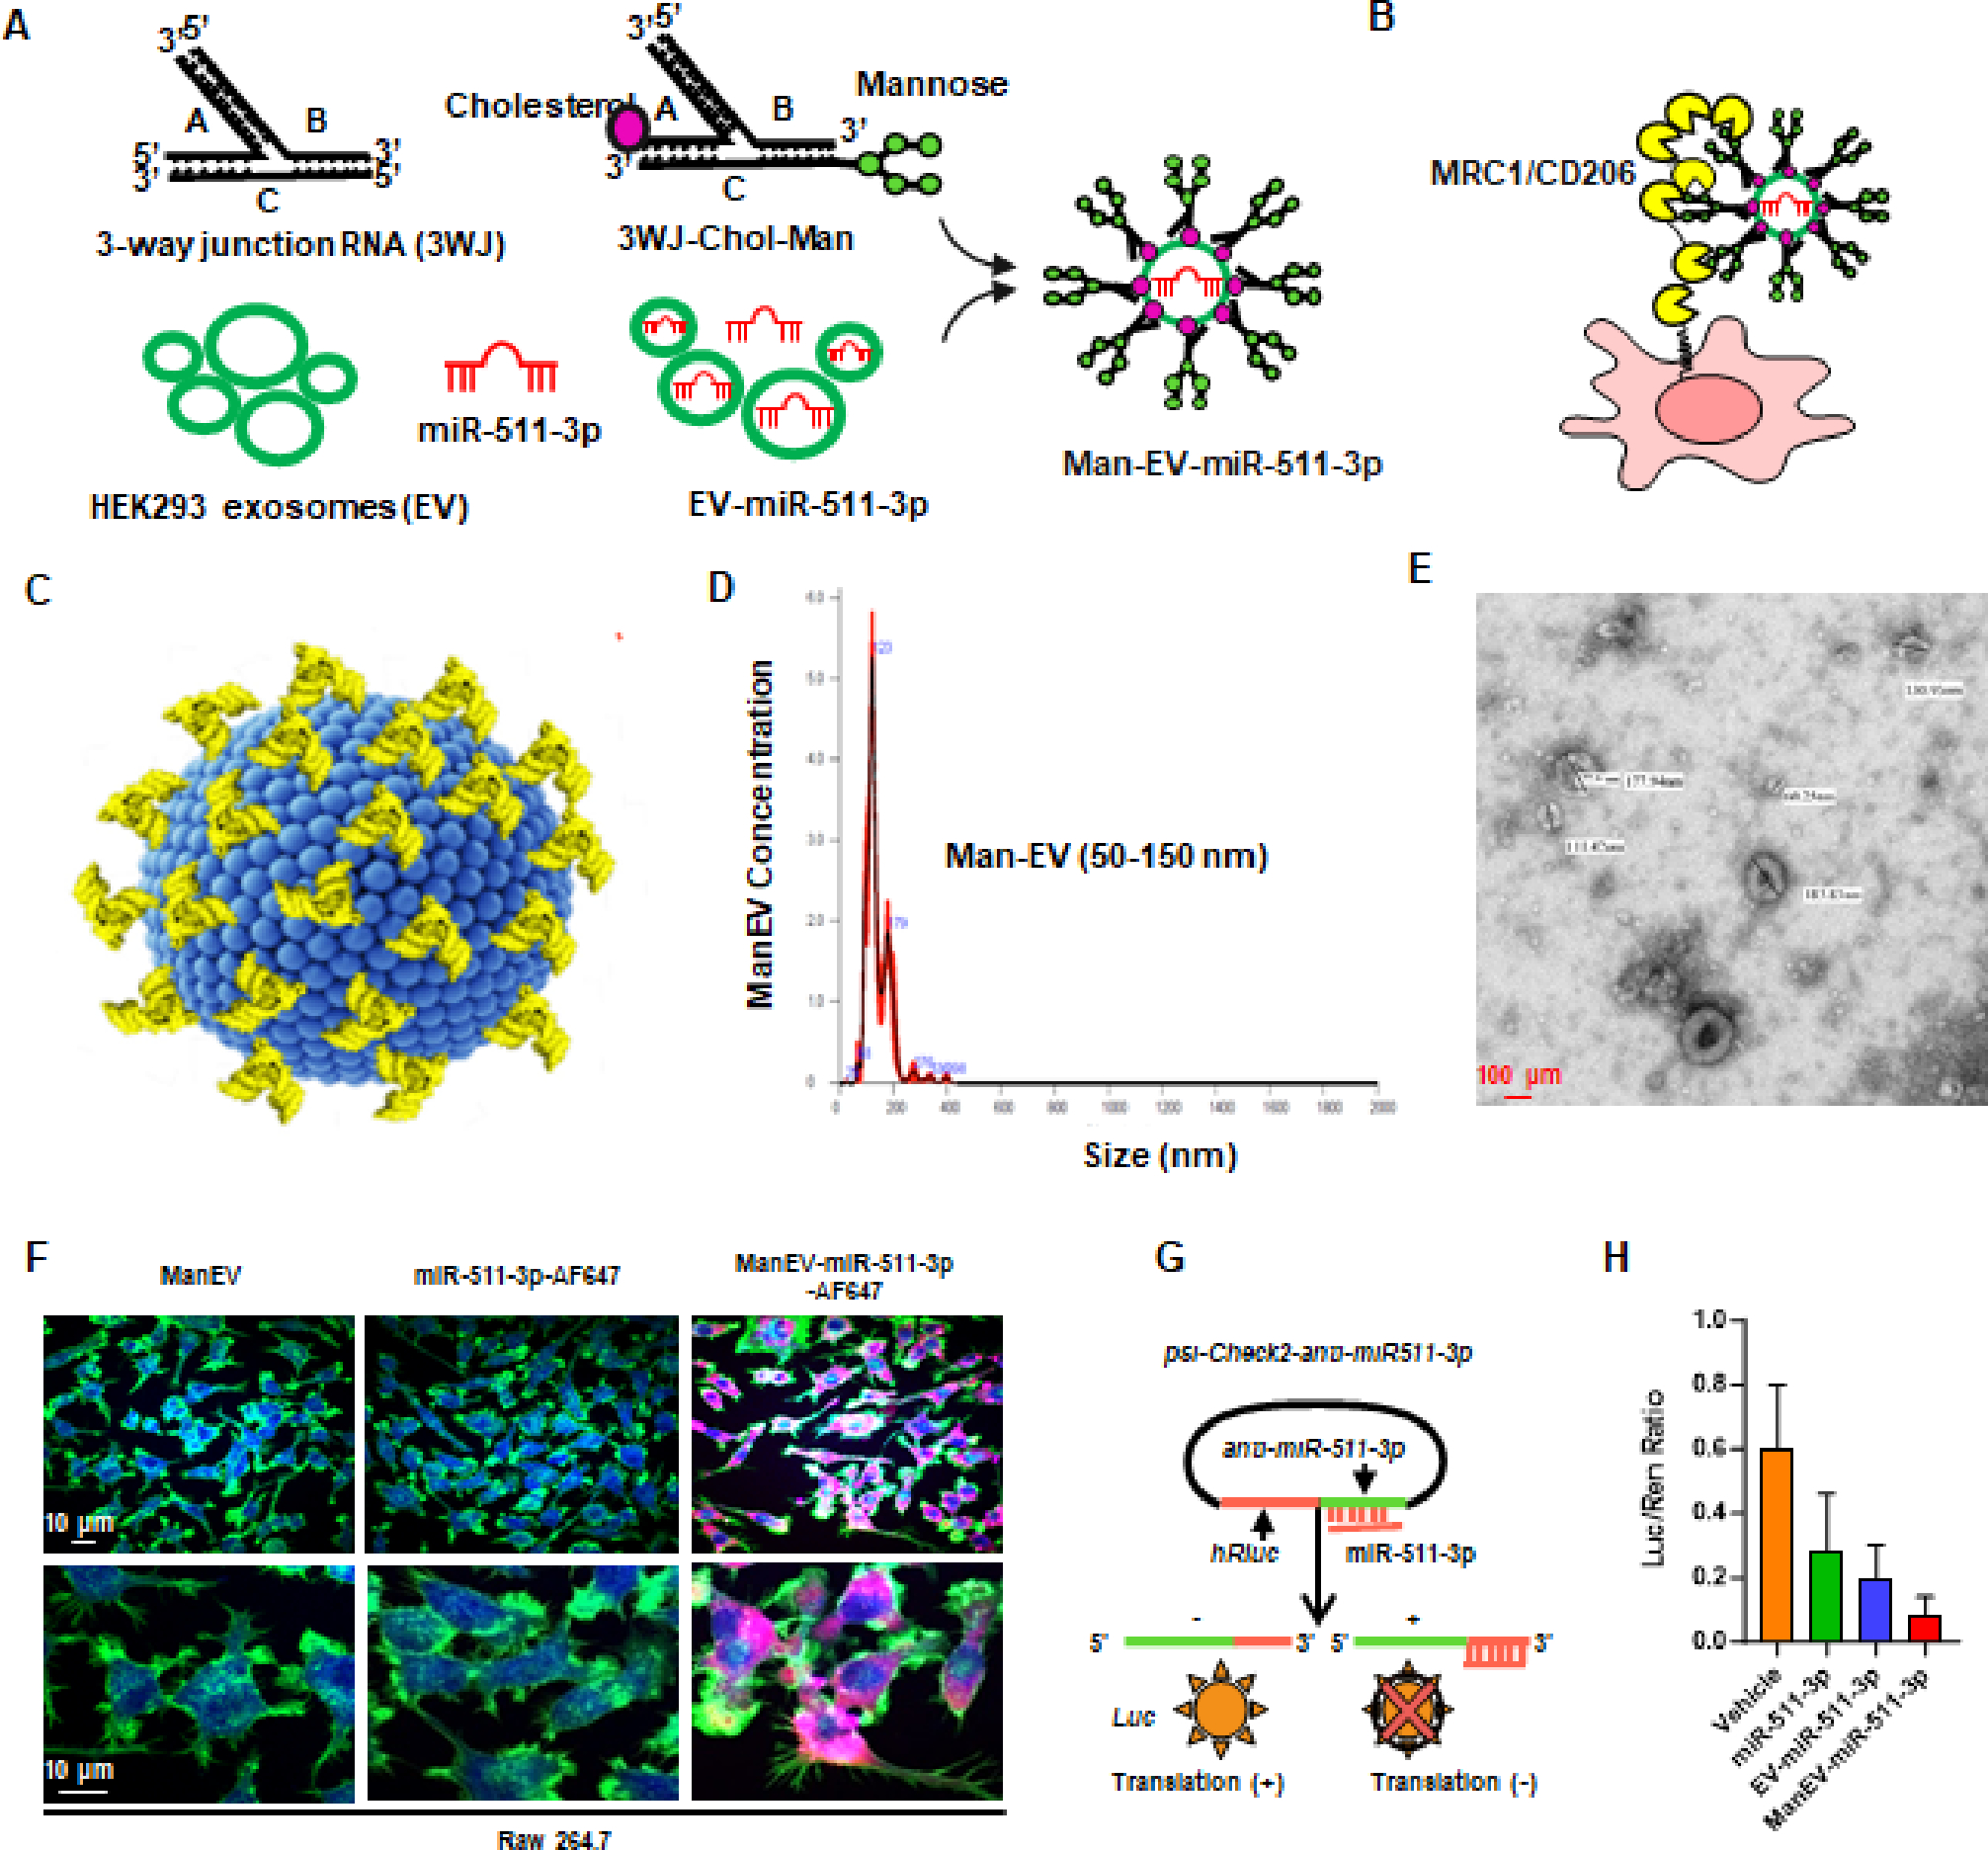
Our previous studies have shown that miR-511-3p treatment has a beneficial effect in alleviating allergic airway inflammation. Here, we sought to explore its therapeutic potential in animal models and gain a deeper understanding of its therapeutic value for asthma. miR-511-3p knockout mice (miR-511-3p-/-) were generated by CRISPR/Cas and showed exacerbated airway hyper-responsiveness and Th2-associated allergic airway inflammation compared with wild-type (WT) mice after exposed to cockroach allergen. RNA nanoparticles with mannose decorated EV-miR-511-3p were also created by loading miR-511-3p mimics into the mannose decorated EVs with engineered RNA nanoparticle PRNA-3WJ (Man-EV-miR-511-3p). Intra-tracheal inhalation of Man-EV-miR-511-3p, which could effectively penetrate the airway mucus barrier and deliver functional miR-511-3p to lung macrophages, successfully reversed the increased airway inflammation observed in miR-511-3p-/- mice. Through microarray analysis, complement C3 (C3) was identified as one of the major targets of miR-511-3p. C3 was increased in LPS-treated macrophages but decreased after miR-511-3p treatment. Consistent with these findings, C3 expression was elevated in the lung macrophages of an asthma mouse model but decreased in mice treated with miR-511-3p. Further experiments, including miRNA-mRNA pulldown and luciferase reporter assays, confirmed that miR-511-3p directly binds to C3 and activates the C3 gene. Thus, miR-511-3p represents a promising therapeutic target for asthma, and RNA nanotechnology reprogrammed EVs are efficient carriers for miRNA delivery for disease treatment.

Keywords: Asthma; Complement C3; Inflammation; Macrophage; miRNA.


Conflict of interest statement

Declaration of Competing Interest The authors have declared that no conflict of interest exists.

Figures

Fig. 1.
Fig. 1.. Generation of miR-511-3p knockout mice using the CRISPR-Cas9 system.
(A) Schematic illustration of the process for the generation of miR-511-3p−/− mice by using CRISPR/Cas9 system with guide RNA (gRNA) sequences flanking the murine miR-511-3p. (B-C) Confirmation of the newly generated miR-511-3p−/− mice by Sanger Sequencing (B) and genotyping (C). (D) RT-PCR confirmation of miR-511-3p deletion in the lung tissues of miR-511-3p−/− mice (n=10/group). (E-F) Expression of Mrc1 in lung tissue macrophages of wild-type (WT) and miR-511-3p−/− mice analyzed by flow cytometry analysis (E) and co-immunostaining with Mrc1 and F4/80 (F). (G) Representative of FITC-CRE (green) in macrophages (red) of lung tissues from WT and miR-511-3p−/− mice (n = 3 per group). All data were expressed as the means ± SEM. Statistical significance was calculated by one-way ANOVA followed by Tukey’s post-hoc test. ***P < 0.001.
Fig. 2.
Fig. 2.. miR-511-3p−/− mice show exacerbation of cockroach allergen-induced airway hyper-responsiveness and lung inflammation.
(A) Experimental protocol for the generation of cockroach allergen-induced mouse model of asthma with WT and miR-511-3p−/− mice. (B) Lung resistance in response to increasing concentrations of methacholine using the forced oscillation technique (FlexiVent, SCIREQ) (n=5/group). (C) Histological examination of mouse paraffin lung sections stained with hematoxylin and eosin (H&E, upper panel) and Periodic acid–Schiff (PAS, lower panel) staining. (D) Bronchoalveolar lavage (BAL) fluid total and eosinophil cell counts as assessed by flow cytometry. (E) Serum levels of cockroach allergen-specific IgE and IgG1. (F) Levels of cytokines in BAL fluids. D-F, n=6–16/group. All data were expressed as the means ± SEM. Statistical significance was calculated by one-way ANOVA followed by Tukey’s post-hoc test. *P < 0.05, **P < 0.01, and ***P < 0.001. CRE: cockroach extract. WT: wild-type.
Fig. 3.
Fig. 3.. Lack of miR-511-3p leads macrophage polarization to M1 phenotypes.
(A) Schematic of preparation of single cells from lung tissues for flow cytometry analysis. (B) Gating strategies for the flow cytometry analysis of M1/M2 macrophages in the lung tissues of wild-type (WT) and miR-511-3p−/− mice. (C-D) Quantitation of lung tissue M1 and M2 macrophages as indicated by the percentage of F4/80+CD11c+iNOS+ cells (%M1, C) and F4/80+CD11c+Arg-1+ cells (%M2, D) among total lung single cells. n=4/group. (E) Representative image of immune fluorescence staining with the primary antibodies against iNOS. Nuclei were counterstained with 4’-6-diamidino-2-phenylindole dihydrochloride (DAPI). Right panel: quantification of immunostainings for F4/80+iNOS+ in total F4/80+ cells. n=5/group. (F) Representative image of immune fluorescence staining with the primary antibodies against Arg-1. Right panel: quantification of immunostainings for F4/80+Arg-1+ in total F4/80+ cells. n=5. (G-H) Quantitative RT-PCR analyses for M1 (G) and M2 (H)-associated genes in bone marrow-derived macrophages (BMDMs) from WT and miR-511-3p−/− mice cultured under M1 or M2 condition. n=4. Data represent means ± SEM. Statistical significance was calculated by one-way ANOVA followed by Tukey’s post-hoc test. *P < 0.05, **P < 0.01, and ***P < 0.001.
Fig. 4.
Fig. 4.. Generation of RNA nanoparticles with mannose decorated extracellular vesicle-miR-511-3p for targeted delivery.
(A) Schematic of generation of RNA nanoparticles with mannose decorated extracellular vesicle-miR-511-3p for specific delivery of miR-511-3p. (B) Schematic of the mannose decorated EVs with miR-511-3p targeting macrophages through mannose receptor Mrc1. (C) 3D structure of Man-EV-miR-511-3p with EVs (blue) and RNA nanoparticles harboring mannose (yellow). (D) Size and concentration of Man-EV-miR-511-3p detected by Nanoparticle tracking analysis (NTA). (E) Actual morphology was observed with transmission electron microscope. (F)Representative confocal images show miR-511-3p uptake by RAW 264.7 cells. Nucleus (blue), cytoplasm (green), and miR-511-3p (red). (G) Schematic of a luciferase-based miR-511-3p reporter system in which a binding sequence of miR-511-3p was cloned into the 3’-UTR of Renila luciferase gene (psi-Check2-anti-miR-511-3p). (H) Dual luciferase assay to test the delivery of miR-511-3p into RAW 264.7 cells and shows a better inhibition as assessed by renilla/firefly luciferase ratio.
Fig. 5.
Fig. 5.. Man-EV-miR-511-3p recovers the increased airway inflammation caused by miR-511-3p deficiency.
(A) Experimental protocol for the use of Man-EV-miR-511-3p in asthma mouse model. (B) (C) Histological examination of mouse paraffin lung sections stained with hematoxylin and eosin (H&E, upper panel) and Periodic acid-Schiff (PAS, lower panel) staining. (C) Flow cytometry analyses of inflammatory cells in bronchoalveolar lavage (BAL) fluids. (D) ELISA analyses of cockroach allergen-specific IgE and IgG1 levels in serum. (E) ELISA analyses of cytokine levels in BAL fluids. C-E, n=6–11/group. All data were expressed as the means ± SEM. Statistical significance was calculated by one-way ANOVA followed by Tukey’s post-hoc test. *P < 0.05, **P < 0.01, and ***P < 0.001. CRE: cockroach extract. WT: wild-type. ManEV: mannose decorated extracellular vesicle.
Fig. 6.
Fig. 6.. Man-EV-miR-511-3p polarizes macrophages into M2 phenotypes.
(A) Schematic of delivered Man-EV-miR-511-3p targeting lung macrophages via Mrc1 to modulating macrophage polarization. (B) Gating strategies for the flow cytometry analysis of M1/M2 macrophages in the lung tissues. (C-D) Quantitation of lung tissue M1 and M2 macrophages as indicated by the percentage of F4/80+CD11c+iNOS+ cells (%M1, C) and F4/80+CD11c+Arg-1+ cells (%M2, D) among total lung single cells. n=5/group. (E) Representative image of immune fluorescence staining with the primary antibodies against iNOS. Nuclei were counterstained with 4’-6-diamidino-2-phenylindole dihydrochloride (DAPI). Right panel: uantification of immunostainings for F4/80+iNOS+ in total F4/80+ cells. n=3–4/group (F) Representative image of immune fluorescence staining with the primary antibodies against Arg-1. Right panel: uantification of immunostainings for F4/80+Arg-1+ in total F4/80+ cells. n=3–4/group (G-H) Quantitative RT-PCR analyses for M1 (G) and M2 (H)-associated genes in Man-EV-miR-511-3p pre-treated bone marrow-derived macrophages (BMDMs) cultured under M1 or M2 condition. n=3/group. Data represent means ± SEM. Statistical significance was calculated by one-way ANOVA followed by Tukey’s post-hoc test. *P < 0.05, **P < 0.01, and ***P < 0.001. ManEV: mannose decorated extracellular vesicle.
Fig. 7.
Fig. 7.. Microarray analysis identifies C3 as one of the major miR-511-3p target genes.
(A) Schematic of microarray analysis for miR-511-3p pre-treated macrophages under M1 culture condition using the mouseRef-8 v2.0 BeadChip. (B-C) Volcano plot of differentially expressed genes in bone marrow-derived macrophages (BMDMs) cultured with (M1) or without (M0) LPS (B) or LPS-treated BMDMs with or without miR-511-3p pretreatment (C). The logarithms of the fold changes of individual genes (x axis) are plotted against the negative logarithm of false discover rate (FDR) to base 10 (y axis). (D-E) Heatmap (D) and gene expression (E) of complement C3 gene in undifferentiated BMDMs and M1 macrophages with or without miR-511-3p pretreatment. n=3/group. (F-G) qPCR analysis of C3 expression in BMDMs (F) and lung tissues of asthma mouse model (G) with or without AAV-miR-511-3p treatment. n=6/group. (H) Expression of C3 in macrophages defined by the representative image of C3 (red) co-immune fluorescence staining with F4/80 (green). Nuclei were counterstained with 4’-6-diamidino-2-phenylindole dihydrochloride (DAPI). Right panel: quantification of double immunostainings for C3 and F4/80. n=9–12/group. (I) Expression of C3 in macrophages defined by the representative image of C3 (red) co-immune fluorescence staining with F4/80 (green) in miR-511-3p−/− mice treated with/without ManEV-miR-511-3p. Nuclei were counterstained with 4’-6-diamidino-2-phenylindole dihydrochloride (DAPI). Right panel: quantification of double immunostainings for C3 and F4/80. n=4–6/group. All data were expressed as the means ± SEM. Statistical significance was calculated by one-way ANOVA followed by Tukey’s post-hoc test. *P < 0.05, **P < 0.01, and ***P < 0.001. CRE: cockroach extract. ManEV: mannose decorated extracellular vesicle.
Fig. 8.
Fig. 8.. miR-511-3p illustrates a direct binding to C3 and regulates C3 activity.
(A) Schematic representation of miR-511-3p-C3 mRNA biotin pulldown assay. (B) qPCR analysis of C3 expression in miR-511-3p-C3 mRNA complexes. n=4. (C) In silico prediction of miR-511-3p binding site in C3 mRNA by BiBiServ RNAhybrid. (D-F) Dual-luciferase assay in HEK293T cells transfected with C3-psicheck2 plasmid containing the binding site (D), mutant binding site (E), and control (F) and then treated with either NC-mimics or miR-511-3p mimics. n=3. All data were expressed as the means ± SEM. Statistical significance was calculated by one-way ANOVA followed by Tukey’s post-hoc test. *P < 0.05, ***P < 0.001.

References

    1. Gelber LE, Seltzer LH, Bouzoukis JK, Pollart SM, Chapman MD, Platts-Mills TA. Sensitization and exposure to indoor allergens as risk factors for asthma among patients presenting to hospital. The American review of respiratory disease 1993; 147(3): 573–8. - PubMed
    1. Rosenstreich DL, Eggleston P, Kattan M, et al. The role of cockroach allergy and exposure to cockroach allergen in causing morbidity among inner-city children with asthma. The New England journal of medicine 1997; 336(19): 1356–63. - PubMed
    1. Chew GL, Perzanowski MS, Canfield SM, et al. Cockroach allergen levels and associations with cockroach-specific IgE. The Journal of allergy and clinical immunology 2008; 121(1): 240–5. - PubMed
    1. Olmedo O, Goldstein IF, Acosta L, et al. Neighborhood differences in exposure and sensitization to cockroach, mouse, dust mite, cat, and dog allergens in New York City. The Journal of allergy and clinical immunology 2011; 128(2): 284–92 e7. - PMC - PubMed
    1. Kang B, Vellody D, Homburger H, Yunginger JW. Cockroach cause of allergic asthma. Its specificity and immunologic profile. The Journal of allergy and clinical immunology 1979; 63(2): 80–6. - PubMed

Publication types