. 2023 Nov 23;14(1):7664.
doi: 10.1038/s41467-023-42855-6.

Molecular EPISTOP, a comprehensive multi-omic analysis of blood from Tuberous Sclerosis Complex infants age birth to two years

Affiliations

Molecular EPISTOP, a comprehensive multi-omic analysis of blood from Tuberous Sclerosis Complex infants age birth to two years

Franz Huschner et al. Nat Commun. .

Abstract

We present a comprehensive multi-omic analysis of the EPISTOP prospective clinical trial of early intervention with vigabatrin for pre-symptomatic epilepsy treatment in Tuberous Sclerosis Complex (TSC), in which 93 infants with TSC were followed from birth to age 2 years, seeking biomarkers of epilepsy development. Vigabatrin had profound effects on many metabolites, increasing serum deoxycytidine monophosphate (dCMP) levels 52-fold. Most serum proteins and metabolites, and blood RNA species showed significant change with age. Thirty-nine proteins, metabolites, and genes showed significant differences between age-matched control and TSC infants. Six also showed a progressive difference in expression between control, TSC without epilepsy, and TSC with epilepsy groups. A multivariate approach using enrollment samples identified multiple 3-variable predictors of epilepsy, with the best having a positive predictive value of 0.987. This rich dataset will enable further discovery and analysis of developmental effects, and associations with seizure development in TSC.


Conflict of interest statement

The authors declare no competing interests.

Figures
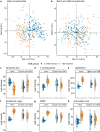
Fig. 1
Fig. 1. Vigabatrin (VGB) effects on metabolites.
a,b PCA plots of metabolomics demonstrating Vigabatrin (VGB) effect before (a) and after correction (b) are shown. cdefgh. Correction for effects of VGB. Plots for kynurenic acid (c), 4 aminobutyrate (d), glutathione (e), glutathione-nega (f), dCMP (g), and aminoadipic acid (h) before and after correction for VGB exposure are shown (nmax VGB = 72; nmax no VGB = 28; FDR < 0.05, Wilcoxon rank sum test). Samples from subjects of age > 40 weeks are shown. The box plot’s central line denotes the median, and its lower and upper boundaries indicate the 25th and 75th percentiles of the data, respectively. The whiskers represent the highest and the lowest values no further than 1.5 times the IQR. All data points are shown. Source data are provided as a Source Data file.
Fig. 2
Fig. 2. Developmental effects on the proteomic, metabolite and transcriptomic data.
ac PCA of each analyte set colored by age groups. d Spearman’s Rank correlation coefficient of each analyte with age, before age correction and colored by p value. Each dot represents one analyte. 187 (75%) metabolites, 286 (62%) protein groups, and 8585 (42%) RNAs showed a significant correlation with age (FDR < 0.05). A two-sided correlation test using Spearman’s method was executed, and the results were adjusted for multiple comparisons using the Benjamini-Hochberg procedure. The box’s middle line marks the median, its edges represent the 25th and 75th percentiles, and whiskers extend to data points within 1.5*IQR. ef. Plots of two individual analytes according to age, prior to correction. Protein group tenascin (e), Ethanolamine (f) significantly correlated with age (p < 0.001). The line is drawn to visualize the trend in the data, representing the linear regression fit, while the surrounding shaded area denotes the 95% confidence intervals (CI). Spearman’s Rank correlation coefficients (R) and p values obtained by two-sided Spearman’s correlation test are indicated. Source data are provided as a Source Data file.
Fig. 3
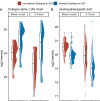
Fig. 3. Analytes whose expression at age 24 months was associated with resistant epilepsy.
Collagen alpha-1(XI) chain (a) and Hydroxyphenylacetic acid (b) are shown, with sample values corrected by two independent methods. These were the only two analytes significantly different in comparison of EPISTOP subjects with refractory epilepsy (nmax = 41) vs. those without at age 24 months (nmax = 43) (Wilcoxon rank sum test; FDR < 0.05; fold change > 1.5). The median is indicated by the center line of the box, the edges show the 25th and 75th percentiles, whiskers reach to values within 1.5*IQR. All data points are shown. Source data are provided as a Source Data file.
Fig. 4
Fig. 4. Analytes associated with epilepsy and/or TSC.
a, protein groups; b, metabolites; and c, mRNA species that were significantly different (Kruskal-Wallis Rank Sum test (FDR < 0.05; fold change > 1.5) in the comparison of group 1 with either group 2 or group 3 of three groups: (1) non-TSC control (nmax = 34); (2) TSC subjects who never developed epilepsy during the two year course of the study (nmax = 9); and (3) TSC subjects who did develop epilepsy (nmax = 31). The median is indicated by the center line of the box, the edges show the 25th and 75th percentiles, whiskers reach to values within 1.5*IQR. All data points are shown. Source data are provided as a Source Data file.
Fig. 5
Fig. 5. Results of integrative predictive epilepsy analysis.
a 3D plot of three-variable model consisting of miR-130a-3p, CECR7 and RADX (mean test MCC = 0.873). Low level of miR-130a-3p (<5M normalized Unit) and RADX expression (<0.5 CPM) corresponds with seizure-free status. b The two-variable model consisting of carnitine and rs1046276 T/C (mean test MCC = 0.79). Homozygote for C at position rs1046276 T/C in combination with high levels of carnitine is associated with remaining seizure free at age 2 years. Source data are provided as a Source Data file.

References

    1. Salussolia CL, Klonowska K, Kwiatkowski DJ, Sahin M. Genetic Etiologies, Diagnosis, and Treatment of Tuberous Sclerosis Complex. Annu Rev. Genom. Hum. Genet. 2019;20:217–240. doi: 10.1146/annurev-genom-083118-015354. - DOI - PubMed
    1. Henske EP, Jozwiak S, Kingswood JC, Sampson JR, Thiele EA. Tuberous sclerosis complex. Nat. Rev. Dis. Prim. 2016;2:16035. doi: 10.1038/nrdp.2016.35. - DOI - PubMed
    1. Curatolo P, Specchio N, Aronica E. Advances in the genetics and neuropathology of tuberous sclerosis complex: edging closer to targeted therapy. Lancet Neurol. 2022;21:843–856. doi: 10.1016/S1474-4422(22)00213-7. - DOI - PubMed
    1. Curatolo P, et al. Management of epilepsy associated with tuberous sclerosis complex: Updated clinical recommendations. Eur. J. Paediatr. Neurol. 2018;22:738–748. doi: 10.1016/j.ejpn.2018.05.006. - DOI - PubMed
    1. de Vries PJ, et al. Tuberous sclerosis associated neuropsychiatric disorders (TAND) and the TAND Checklist. Pediatr. Neurol. 2015;52:25–35. doi: 10.1016/j.pediatrneurol.2014.10.004. - DOI - PMC - PubMed

Publication types