. 2023 Nov 23;14(1):7656.
doi: 10.1038/s41467-023-43326-8.

BioE3 identifies specific substrates of ubiquitin E3 ligases

Affiliations

BioE3 identifies specific substrates of ubiquitin E3 ligases

Orhi Barroso-Gomila et al. Nat Commun. .

Abstract

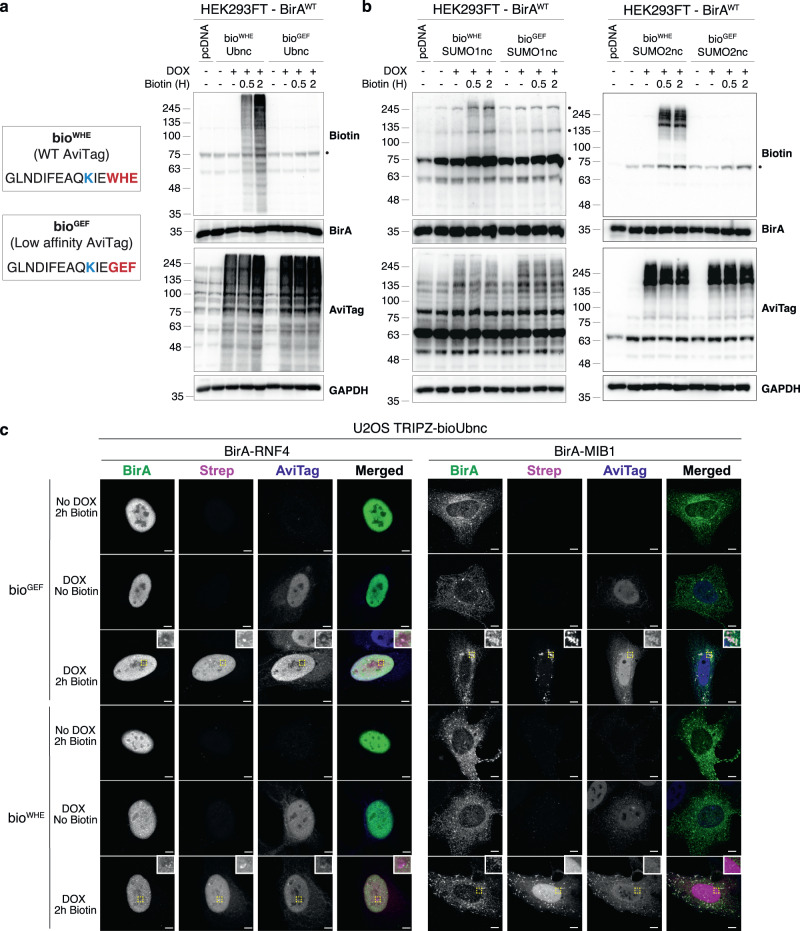
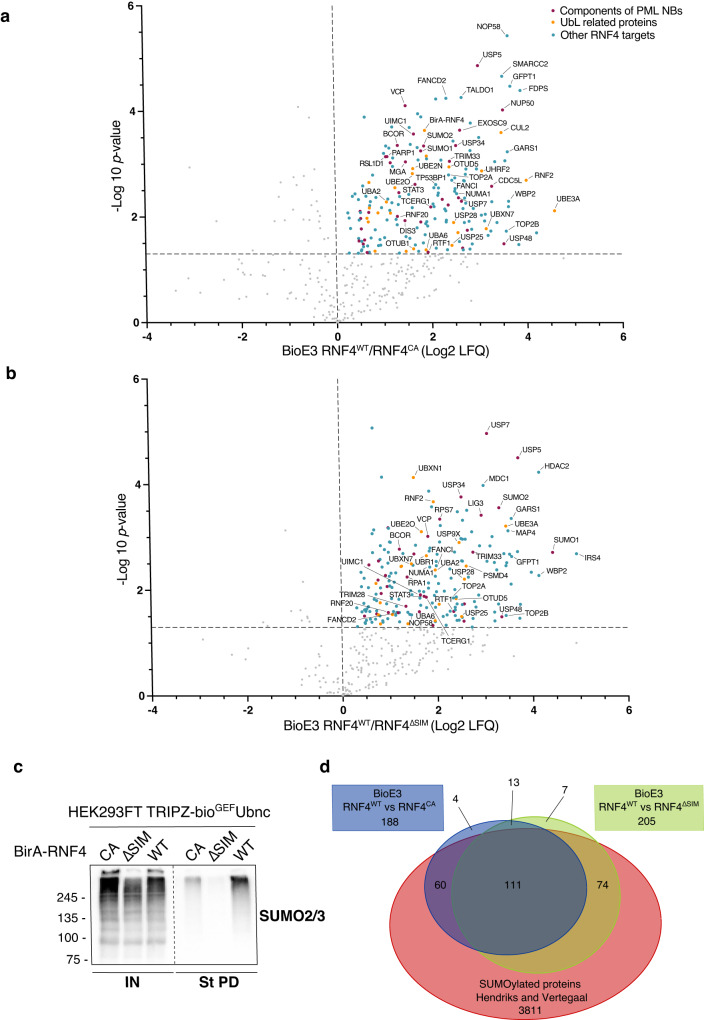
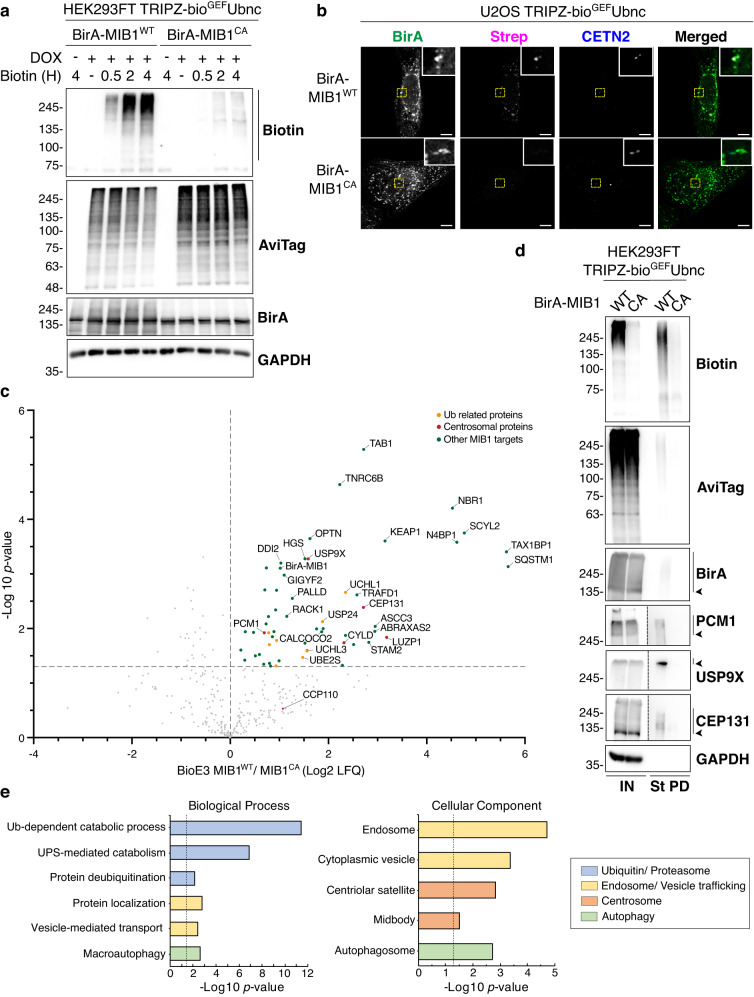
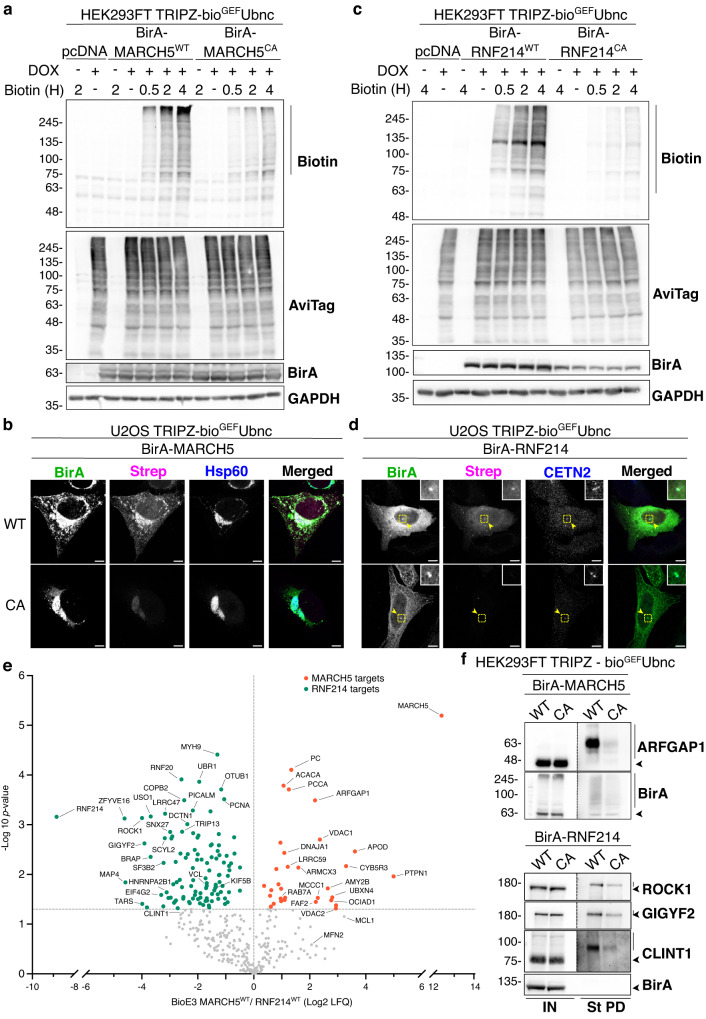
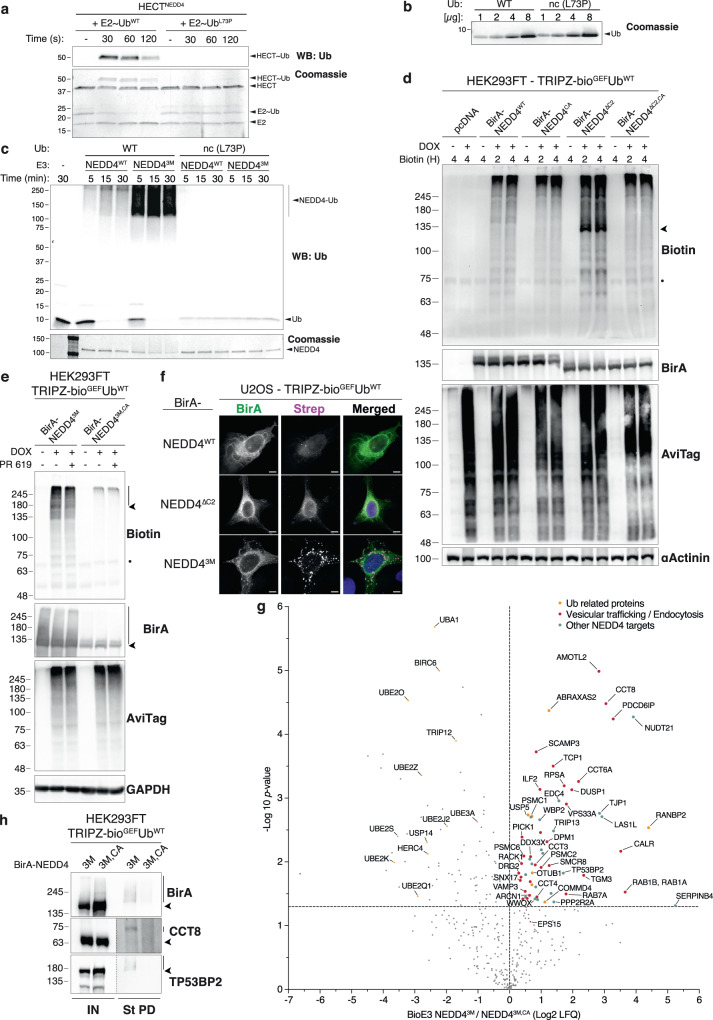
Hundreds of E3 ligases play a critical role in recognizing specific substrates for modification by ubiquitin (Ub). Separating genuine targets of E3s from E3-interactors remains a challenge. We present BioE3, a powerful approach for matching substrates to Ub E3 ligases of interest. Using BirA-E3 ligase fusions and bioUb, site-specific biotinylation of Ub-modified substrates of particular E3s facilitates proteomic identification. We show that BioE3 identifies both known and new targets of two RING-type E3 ligases: RNF4 (DNA damage response, PML bodies), and MIB1 (endocytosis, autophagy, centrosome dynamics). Versatile BioE3 identifies targets of an organelle-specific E3 (MARCH5) and a relatively uncharacterized E3 (RNF214). Furthermore, BioE3 works with NEDD4, a HECT-type E3, identifying new targets linked to vesicular trafficking. BioE3 detects altered specificity in response to chemicals, opening avenues for targeted protein degradation, and may be applicable for other Ub-likes (UbLs, e.g., SUMO) and E3 types. BioE3 applications shed light on cellular regulation by the complex UbL network.


Conflict of interest statement

The authors declare no competing interests.

Figures

Fig. 1
Fig. 1. Identification of substrates of E3 ligases: the BioE3 strategy.
Schematic representation of the BioE3 strategy and the constructs used. bioGEF, low-affinity AviTag (see text); DOX, doxycycline; EFS, elongation factor 1α short promoter; GSQ, Gly-Ser-Gln flexi-rigid linker; PUROR, puromycin resistant cassette; TetON, tetracycline inducible promoter; TRIPZ, all-in-one inducible lentiviral vector; Ub, Ubiquitin. Some elements sourced from BioRender.com.
Fig. 2
Fig. 2. Low affinity bioGEF enables BioE3 studies.
a, b Left, sequence of the WT (WHE) and the low affinity (GEF) AviTags. Biotin-targeted lysine is shown in blue, mutated amino acids in red. Western blot of HEK293FT stable cell lines expressing EFS-BirA, transfected with a TRIPZ–bioWHEUbnc or the low affinity version bioGEFUbnc and b bioWHESUMO1nc, bioWHESUMO2nc or the low affinity versions bioGEFSUMO1nc, bioGEFSUMO2nc. Cells were preincubated in biotin-free dialyzed FBS-containing media prior to transfections. Doxycycline (DOX) induction was performed at 1 μg/ml for 24 h and biotin supplementation at 50 μM for the indicated time-points. General unspecific biotinylation was observed for bioWHE tagged UbLs, while no biotinylation was observed in the case of the low-affinity bioGEF versions. Dots indicate endogenous carboxylases that are biotinylated constitutively by the cell. Molecular weight markers are shown to the left of the blots in kDa. c Confocal microscopy of U2OS stable cell lines expressing TRIPZ-bioWHEUbnc or bioGEFUbnc transfected with EFS-BirA-RNF4 or EFS-BirA-MIB1. All BioE3 experiments were performed by pre-incubating the cells in dialyzed FBS-containing media prior to transfections, DOX induction at 1 µg/ml for 24 h and biotin supplementation at 50 µM for 2 h, unless otherwise specified. Colocalization of streptavidin and BirA-RNF4/MIB1 signals was observed when using bioGEFUbnc, while general unspecific labeling was detected for bioWHEUbnc. Yellow dotted-line squares show the selected area for digital zooming. Biotinylated material was stained with fluorescent streptavidin (Strep, magenta), BirA (green), and AviTag (blue) with specific antibodies. Black and white panels show the green, magenta, and blue channels alone. Scale bar: 5 μm for RNF4 panels and 8 μm for MIB1 panels. ac Data are representative of 3 independent transfection experiments with similar results. Source data are provided in the Source data file.
Fig. 3
Fig. 3. BioE3 specifically labels substrates of RNF4.
a Western blot of BioE3 experiment in triplicates performed on HEK293FT stable cell line expressing TRIPZ-bioGEFUbnc and transfected with EFS-BirA-RNF4WT, BirA-RNF4CA, or BirA-RNF4ΔSIM. MG132 was used at 10 µM for 4 h. Specific biotinylation of RNF4 targets, which were accumulated upon MG132 treatment (bars), was observed. Dot indicates endogenously biotinylated carboxylases. Biotin signal was quantified and normalized to expression levels (BirA blot). b, d Confocal microscopy of BioE3 experiment performed on U2OS stable cell line expressing TRIPZ-bioGEFUbnc transfected with EFS-BirA-RNF4WT, BirA-RNF4CA or BirA-RNF4ΔSIM. Yellow dotted-line squares show the selected colocalization event for digital zooming. Biotinylated material is stained with fluorescent streptavidin (Strep, magenta), and BirA with specific antibody (green). In blue, nuclei are labeled with DAPI (b) or PML is labeled with specific antibody (d). Black and white panels show the green and magenta channels individually. Scale bar: 10 μm. Colocalization of streptavidin and BirA-RNF4WT signals was observed in the nucleus (yellow arrowheads) (b). Indicated samples were also treated with 1 µM ATO for 2 h and 10 µM MG132 for 6 h (d). c Western blot showing the effect of ATO treatment in PML ubiquitination (black arrowhead and bars) by RNF4. BioE3 experiment was performed on HEK293FT stable cell line expressing TRIPZ-bioGEFUbnc transfected with EFS-BirA-RNF4WT, BirA-RNF4CA or BirA-RNF4ΔSIM. Indicated samples were also treated with 1 µM ATO for 2 h. St PD, streptavidin pull-down. PML signal in the pull-down was quantified and normalized to expression levels (BirA blot). a, c Bar plots show the mean and standard deviation of n = 3. Statistical analyses were performed by one-way ANOVA with Tukey’s multiple comparison test: **p < 0.01; ***p < 0.001; ****p < 0.0001. Source data and the exact p-values are provided in the Source Data file. Molecular weight markers are shown to the left of the blots in kDa, antibodies used are indicated to the right. Source data and the exact p-values are provided in the Source data file. ad Data are representative of 3 independent experiments with similar results. Source data are provided in the Source data file.
Fig. 4
Fig. 4. BioE3 identifies SUMO-dependent Ub targets of RNF4.
a, b Volcano plots of LC-MS analysis comparing streptavidin pull-downs of BioE3 experiments performed on HEK293FT stable cell line expressing TRIPZ-bioGEFUbnc transfected with EFS-BirA-RNF4WT, BirA-RNF4CA or BirA-RNF4ΔSIM, with 3 biological replicates per condition performed (n = 3). Proteins significantly enriched (Log 2 RNF4WT/ RNF4CA (a) or RNF4ΔSIM (b) > 0 and p-value < 0.05) were considered as RNF4 targets. Statistical analyses were done using two-sided Student’s t-test. Data are provided as Supplementary Data 1. c Western blot of SUMOylated RNF4 targets from samples described in (a, b). IN: input; St PD: streptavidin pull-down. Molecular weight markers are shown to the left of the blots in kDa. d Venn diagram showing the SUMO-dependent targets of RNF4 (comparison of the BioE3 RNF4WT/RNF4CA targets in (a) versus the BioE3 RNF4WT/RNF4ΔSIM targets in (b)) and the SUMOylated targets (SUMOylome from Hendriks and Vertegaal). Comparison data are provided as Supplementary Data 1. Source data are provided in the Source data file.
Fig. 5
Fig. 5. RNF4 Ub targets participate in essential nuclear and UPS-related processes.
a STRING network analysis of the RNF4 targets defined in Fig. 4a (BioE3 RNF4WT/RNF4CA). Highly interconnected sub-clusters were derived from the core-cluster in Supplementary Fig. 5 using MCODE. Color, transparency, and size of the nodes were discretely mapped to the Log2 enrichment value as described. b Gene ontology analysis of the RNF4 targets defined in Fig. 4a (BioE3 RNF4WT/ RNF4CA). Statistical enrichment analysis was performed using Fisher’s one-tailed test with g:SCS correction for multiple comparisons. Depicted biological processes, molecular functions, and cellular components were significantly enriched. Dotted line represents the threshold of the p-value (0.05). Data are provided as Supplementary Data 2.
Fig. 6
Fig. 6. BioE3 identifies targets of MIB1.
a Western blot of BioE3 experiment performed on HEK293FT stable cell line expressing TRIPZ-bioGEFUbnc and transfected with EFS-BirA-MIB1WT or BirA-MIB1CA. Specific biotinylation of MIB1 targets was observed at different biotin timings (bars). Molecular weight markers are shown to the left of the blots in kDa. b Confocal microscopy of BioE3 experiment performed on U2OS stable cell line expressing TRIPZ-bioGEFUbnc transfected with EFS-BirA-MIB1WT or BirA-MIB1CA. Colocalization of streptavidin (Strep, magenta), BirA-MIB1 (green), and Centrin-2 (CETN2, blue) was observed at the centrosomes and selected for digital zooming (yellow dotted-line squares). Black and white panels show the green, magenta, and blue channels individually. Scale bar: 8 μm. c Volcano plot of LC-MS analysis comparing streptavidin pull-downs of BioE3 experiments performed on HEK293FT stable cell line expressing TRIPZ-bioGEFUbnc and transfected with EFS-BirA-MIB1WT or BirA-MIB1CA (n = 3 biological replicates per condition). Proteins significantly enriched (Log2 MIB1WT/MIB1CA > 0 and p-value < 0.05) were considered as MIB1 targets. Statistical analyses were performed by two-sided Student’s t-test. Data are provided as Supplementary Data 3. d Western blot validations of centrosomal MIB1 targets identified in (c): PCM1, USP9X, and CEP131. Arrowheads and bars point to unmodified and Ub modified proteins, respectively. IN: input; St PD: streptavidin pull-down. Molecular weight markers are shown to the left of the blots in kDa. e Gene ontology analysis of the MIB1 targets defined in (c). Statistical enrichment analysis was performed using Fisher’s one-tailed test with g:SCS correction for multiple comparisons. Depicted biological processes and cellular components were significantly enriched. Dotted line represents the threshold of the p-value (0.05). Data are provided as Supplementary Data 4. ad Data are representative of 3 independent transfection experiments with similar results. Source data are provided in the Source data file.
Fig. 7
Fig. 7. BioE3 identifies Ub targets of MARCH5 and RNF214.
a, c Western blot of BioE3 experiment performed on HEK293FT stable cell line expressing TRIPZ-bioGEFUbnc and transfected with a EFS-BirA-MARCH5WT or BirA-MARCH5CA and c EFS-BirA-RNF214WT or BirA-RNF214CA. Specific biotinylation of MARCH5 and RNF214 targets was observed at different biotin timings (bars). Molecular weight markers are shown to the left of the blots in kDa. b, d Confocal microscopy of BioE3 experiment performed in U2OS stable cell line expressing TRIPZ-bioGEFUbnc and transfected with EFS-BirA-MARCH5WT or BirA-MARCH5CA (b) and EFS-BirA-RNF214WT or BirA-RNF214CA (d). Colocalization of streptavidin (Strep, magenta) and BirA (BirA antibody, green) signals was observed at mitochondria (Hsp60, blue) (b) or at the centrosome (Centrin-2, CETN-2, blue) (d). Black and white panels show the green, magenta, and blue channels individually. Scale bar: 8 μm. Yellow dotted-line squares show the selected colocalization event for digital zooming. e Volcano plot of LC-MS analysis comparing streptavidin pull-downs of BioE3 experiments performed on HEK293FT stable cell line expressing TRIPZ-bioGEFUbnc transfected with EFS-BirA-MARCH5WT and BirA-RNF214WT (n = 3 biological replicates). Proteins significantly enriched (p-value < 0.05) were considered as targets. Statistical analyses were performed by two-sided Student’s t-test. Data are provided as Supplementary Data 5. f Western blot validations of mitochondrial MARCH5 (ARFGAP1) or centrosomal RNF214 (ROCK1, GIGYF2, and CLINT1) targets identified in €. Arrowheads and bars point to unmodified and Ub modified proteins, respectively. IN: input; St PD: streptavidin pull-down. Molecular weight markers are shown to the left of the blots in kDa. af All BioE3 experiments were performed as above, with biotin supplementation at 50 µM for 2 h (or indicated time points). Data are representative of 3 independent transfection experiments with similar results. Source data are provided in the Source data file.
Fig. 8
Fig. 8. BioE3 using bioGEFUbWT identifies targets of activated NEDD4.
ac Ubnc (L73P) mutation impairs NEDD4~Ub transthiolation and autoubiquitination. a Western blot (upper) and Coomassie staining of NEDD4 transthiolation assay, using UbWT loaded Ube2D3 (E2~UbWT) or Ubnc loaded Ube2D3 (E2 ~ UbL73P). b Coomassie staining showing that UbWT and Ubnc were at similar levels in the reaction. c Western blot (upper) and Coomassie staining of NEDD4 autoubiquitination assay using purified Ube1 (E1), Ube2D3 (E2), UbWT or Ubnc together with NEDD4WT or NEDD43M (E3s). Ubiquitination reactions were stopped at indicated time-points. NEDD4WT and NEDD43M autoubiquitination is impaired by L73P mutation on Ub (black arrowhead). Data are representative of 2 independent experiments with similar results. d, e Western blot of BioE3 experiments performed on HEK293FT stable cell line expressing TRIPZ-bioGEFUbWT transiently transfected with d EFS-BirA-NEDD4WT, NEDD4CA, NEDD4ΔC2 or NEDD4ΔC2,CA and e EFS-BirA-NEDD43M or EFS-BirA-NEDD43M,CA. Active, auto-ubiquitinated and biotinylated BirA-NEDD4ΔC2 and BirA-NEDD43M are depicted with black arrowheads and ubiquitinated substrates with bars. Dots indicate endogenous biotinylated carboxylases. Cells in (e) were also treated with the DUB inhibitor PR619. f Confocal microscopy of BioE3 experiment performed on U2OS stable cell line for TRIPZ-bioGEFUbWT transfected with EFS-BirA-NEDD4WT, BirA-NEDD4ΔC2 or BirA-NEDD43M. Biotinylated material is stained with fluorescent streptavidin (Strep, magenta), and BirA with specific antibody (green). Black and white panels show the green and magenta channels individually. Scale bar: 8 μm. g Volcano plot of LC-MS analysis comparing streptavidin pull-downs of BioE3 experiments performed on HEK293FT stable cell line expressing TRIPZ-bioGEFUbWT and transfected with EFS-BirA-NEDD43M or BirA-NEDD43M,CA (n = 3 biological replicates). Proteins significantly enriched (Log2 NEDD43M/NEDD43M,CA > 0 and p-value < 0.05) were considered as NEDD4 targets. Statistical analyses were performed by two-sided Student’s t-test. Data are provided as Supplementary Data 7. h Western blot validations of NEDD4 targets identified in (g): CCT8 and TP53BP2. Arrowheads and bars point to unmodified and Ub modified proteins, respectively. IN: input; St PD: Streptavidin pull-down. ah Molecular weight markers are shown to the left of the blots in kDa. dh Data are representative of 3 independent transfection experiments with similar results. Source data are provided in the Source data file.

References

    1. George AJ, Hoffiz YC, Charles AJ, Zhu Y, Mabb AM. A comprehensive atlas of E3 ubiquitin ligase mutations in neurological disorders. Front. Genet. 2018;9:29. doi: 10.3389/fgene.2018.00029. - DOI - PMC - PubMed
    1. Buetow L, Huang DT. Structural insights into the catalysis and regulation of E3 ubiquitin ligases. Nat. Rev. Mol. Cell Biol. 2016;17:626–642. doi: 10.1038/nrm.2016.91. - DOI - PMC - PubMed
    1. Garcia-Barcena C, Osinalde N, Ramirez J, Mayor U. How to inactivate human ubiquitin E3 ligases by mutation. Front Cell Dev. Biol. 2020;8:39. doi: 10.3389/fcell.2020.00039. - DOI - PMC - PubMed
    1. Liew CW, Sun H, Hunter T, Day CL. RING domain dimerization is essential for RNF4 function. Biochem. J. 2010;431:23–29. doi: 10.1042/BJ20100957. - DOI - PMC - PubMed
    1. Rotin D, Kumar S. Physiological functions of the HECT family of ubiquitin ligases. Nat. Rev. Mol. Cell Biol. 2009;10:398–409. doi: 10.1038/nrm2690. - DOI - PubMed

Publication types