

Microscopic theory, analysis, and interpretation of conductance histograms in molecular junctions
- PMID: 37996422
- PMCID: PMC10667247
- DOI: 10.1038/s41467-023-43169-3
Microscopic theory, analysis, and interpretation of conductance histograms in molecular junctions
Abstract
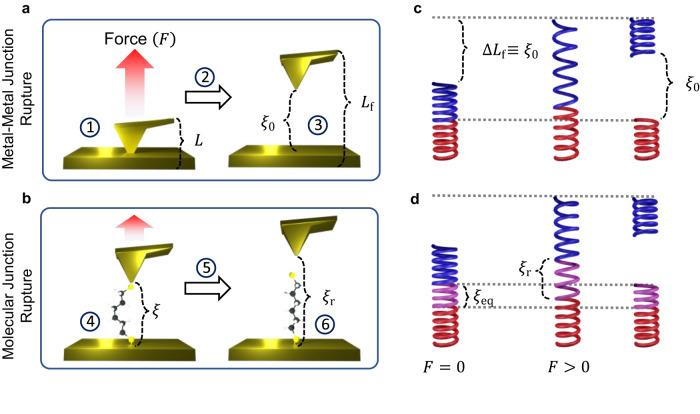
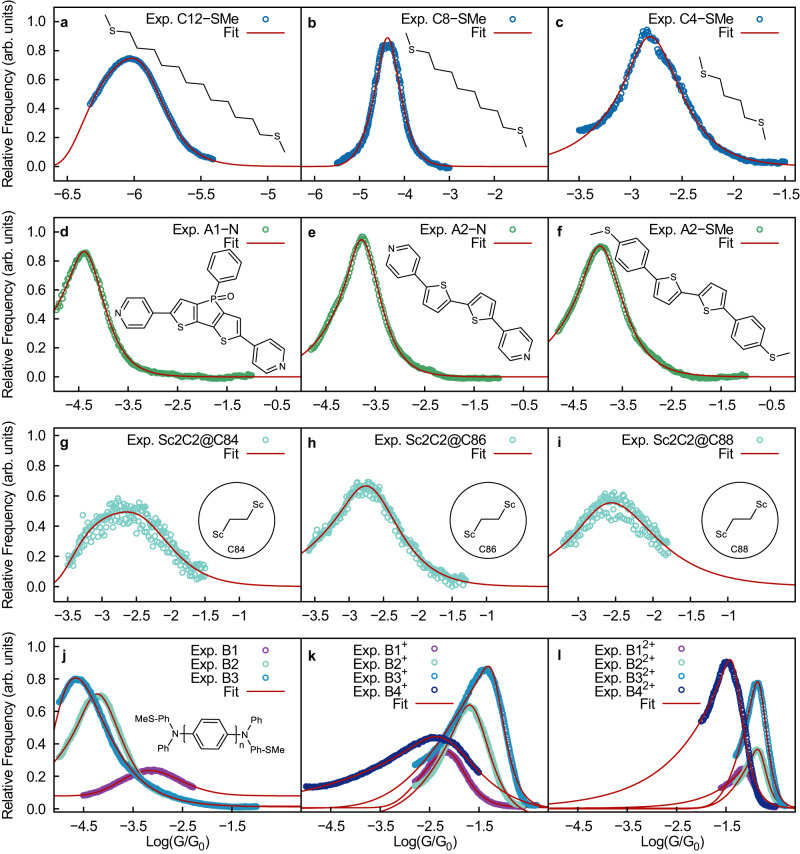
Molecular electronics break-junction experiments are widely used to investigate fundamental physics and chemistry at the nanoscale. Reproducibility in these experiments relies on measuring conductance on thousands of freshly formed molecular junctions, yielding a broad histogram of conductance events. Experiments typically focus on the most probable conductance, while the information content of the conductance histogram has remained unclear. Here we develop a microscopic theory for the conductance histogram by merging the theory of force-spectroscopy with molecular conductance. The procedure yields analytical equations that accurately fit the conductance histogram of a wide range of molecular junctions and augments the information content that can be extracted from them. Our formulation captures contributions to the conductance dispersion due to conductance changes during the mechanical elongation inherent to the experiments. In turn, the histogram shape is determined by the non-equilibrium stochastic features of junction rupture and formation. The microscopic parameters in the theory capture the junction's electromechanical properties and can be isolated from separate conductance and rupture force (or junction-lifetime) measurements. The predicted behavior can be used to test the range of validity of the theory, understand the conductance histograms, design molecular junction experiments with enhanced resolution and molecular devices with more reproducible conductance properties.
© 2023. The Author(s).
Conflict of interest statement
The authors declare no competing interests.
Figures


Similar articles
-
Structure-Property Relationships in Atomic-Scale Junctions: Histograms and Beyond.Acc Chem Res. 2016 Mar 15;49(3):452-60. doi: 10.1021/acs.accounts.6b00004. Epub 2016 Mar 3. Acc Chem Res. 2016. PMID: 26938931
-
Correlation analysis of atomic and single-molecule junction conductance.ACS Nano. 2012 Apr 24;6(4):3411-23. doi: 10.1021/nn300440f. Epub 2012 Mar 26. ACS Nano. 2012. PMID: 22397391
-
Learning Conductance: Gaussian Process Regression for Molecular Electronics.J Chem Theory Comput. 2023 Feb 14;19(3):992-1002. doi: 10.1021/acs.jctc.2c00648. Epub 2023 Jan 24. J Chem Theory Comput. 2023. PMID: 36692968
-
Molecular Electronics: From Single-Molecule to Large-Area Devices.Chempluschem. 2019 Sep;84(9):1215-1221. doi: 10.1002/cplu.201900171. Epub 2019 May 28. Chempluschem. 2019. PMID: 31944062 Review.
-
Break-junctions for investigating transport at the molecular scale.J Phys Condens Matter. 2014 Nov 26;26(47):474201. doi: 10.1088/0953-8984/26/47/474201. Epub 2014 Oct 29. J Phys Condens Matter. 2014. PMID: 25352355 Review.
Cited by
-
Methods for the analysis, interpretation, and prediction of single-molecule junction conductance behaviour.Chem Sci. 2024 May 25;15(25):9510-9556. doi: 10.1039/d4sc00488d. eCollection 2024 Jun 26. Chem Sci. 2024. PMID: 38939131 Free PMC article. Review.
References
-
- Elke, S. & Carlos, C. J. Molecular Electronics: An Introduction to Theory and Experiment, volume 15. (World Scientific, 2017).
-
- Datta, S. Quantum Transport: Atom to Transistor. (Cambridge University Press, 2005).
-
- Nitzan, A. Chemical Dynamics in Condensed Phases: Relaxation, Transfer and Reactions in Condensed Molecular Systems. (Oxford University Press, 2006).
Grants and funding
LinkOut - more resources
Full Text Sources
