. 2023 Nov 23;14(1):7666.
doi: 10.1038/s41467-023-42967-z.

Hi-C metagenome sequencing reveals soil phage-host interactions

Affiliations

Hi-C metagenome sequencing reveals soil phage-host interactions

Ruonan Wu et al. Nat Commun. .

Abstract

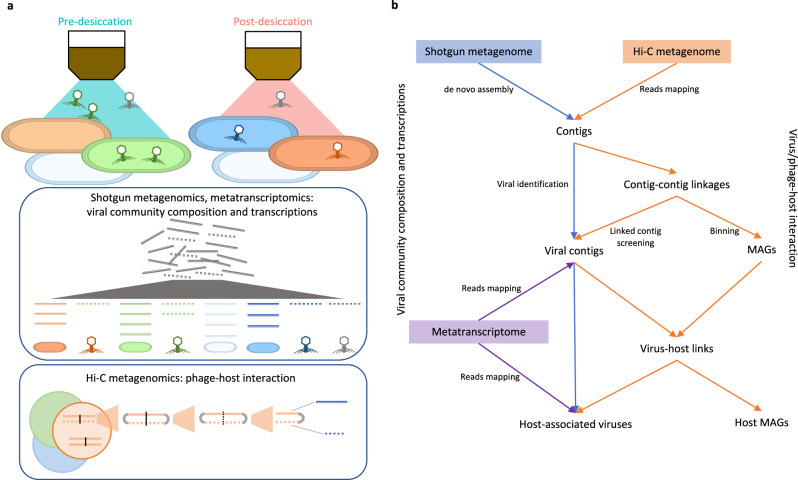
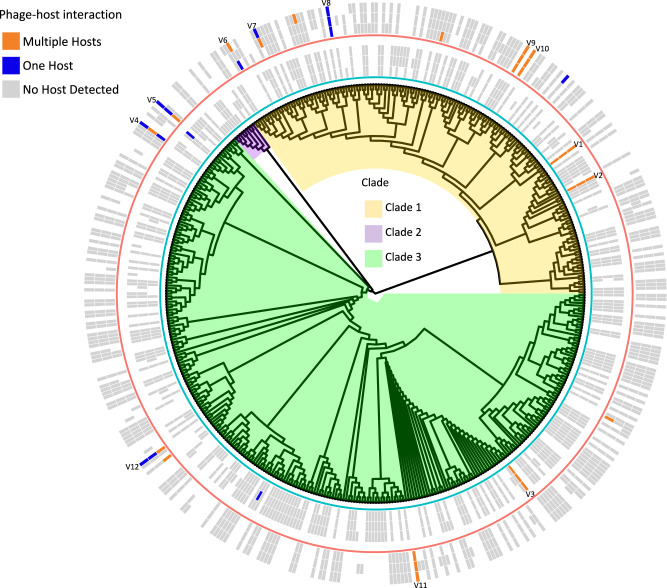
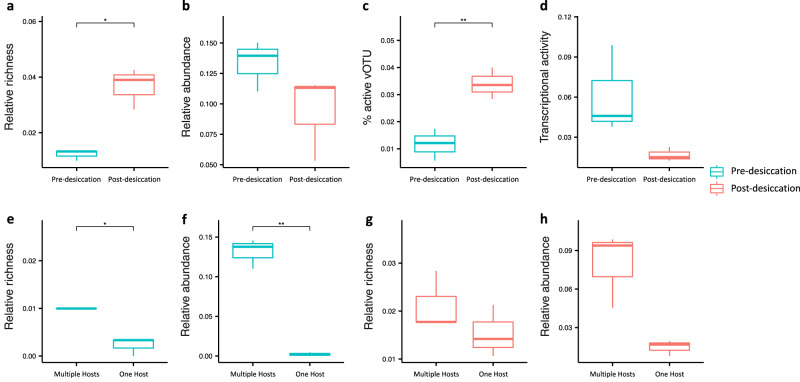
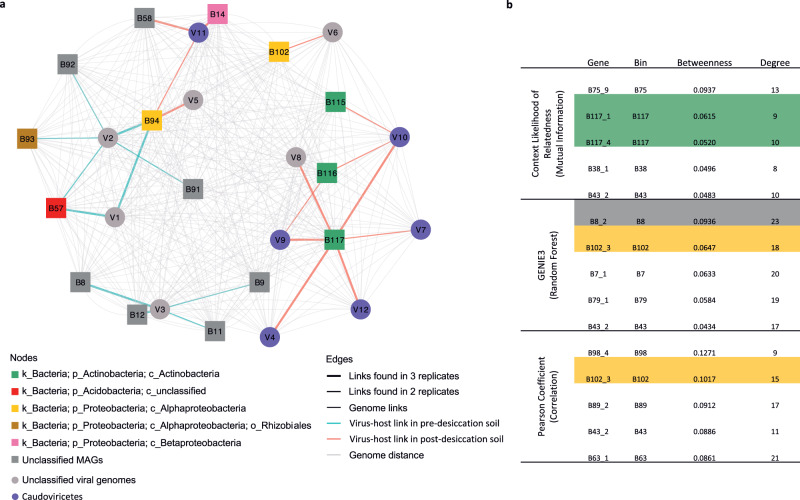
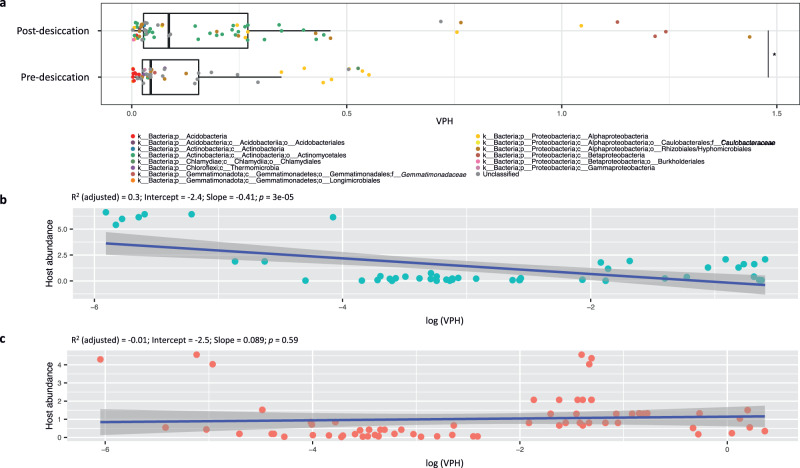
Bacteriophages are abundant in soils. However, the majority are uncharacterized, and their hosts are unknown. Here, we apply high-throughput chromosome conformation capture (Hi-C) to directly capture phage-host relationships. Some hosts have high centralities in bacterial community co-occurrence networks, suggesting phage infections have an important impact on the soil bacterial community interactions. We observe increased average viral copies per host (VPH) and decreased viral transcriptional activity following a two-week soil-drying incubation, indicating an increase in lysogenic infections. Soil drying also alters the observed phage host range. A significant negative correlation between VPH and host abundance prior to drying indicates more lytic infections result in more host death and inversely influence host abundance. This study provides empirical evidence of phage-mediated bacterial population dynamics in soil by directly capturing specific phage-host interactions.


Conflict of interest statement

The authors declare no competing interests.

Figures

Fig. 1
Fig. 1. Schematic of the experimental design and data analysis workflow.
a Description of sample treatment and the collected sequencing data. Soil samples were collected pre- (75% water holding capacity, represented by the first soil jar icon) and post-desiccation (soil dried to consistent weight, represented by the second soil jar icon). Shotgun metagenomes (sequenced on the total DNA, demonstrated in the first box), (bulk) metatranscriptomes (sequenced on the total RNA, demonstrated in the first box), and Hi-C metagenomes (sequenced on the cross-linked DNA, demonstrated in the second box) were generated from each replicate sample. b Data analysis and integration. Shotgun metagenome-assembled contigs were used to screen for viral contigs. The normalized read coverages of the identified viral contigs in shotgun metagenomes and metatranscriptomes were used to detect the viral (phage) community compositions and transcriptional activities in the soil samples before and after desiccation. Hi-C metagenomes containing the sequenced cross-linked DNA of the extracted host microbial cells were used to identify contig-contig linkages. The quality-filtered linkages were used to cluster linked contigs into metagenome assembled genomes (MAGs) and to identify phage-host pairs. Co-analysis of the paired shotgun and Hi-C metagenomes was performed for the detection of phage-host interactions under wet and dry soil conditions and to determine phage-host interactions.
Fig. 2
Fig. 2. Soil phage–host interactions revealed using Hi–C metagenomics.
Hi–C metagenomics was used to characterize host-associated vOTUs in pre- and post-desiccation soils. The tree of all the detected vOTUs based on genome-wide similarities is shown in the center with the three major clades colored in yellow (Clade 1), purple (Clade 2) and green (Clade 3). The two heatmaps outside the tree indicate the vOTUs that were detected in each of the three replicate samples. The outlines underneath each heatmap indicate the experimental conditions: Pre-desiccation (inner circle, blue); Post-desiccation (outer circle, red). The cells of the heatmaps are colored by the type of phage-host interaction of each vOTU: Multiple Hosts in orange, One Host in dark blue, and No Host Detected in gray. Empty (white) cells indicate the vOTUs were not detected in the sample. The vOTUs linked to the same host(s) in at least two replicates are labeled. Source data are provided as a Source Data file.
Fig. 3
Fig. 3. Richness, abundance, and transcriptional activities of host-associated vOTUs.
a Relative richness of host-associated vOTUs to total vOTU richness in pre- and post-desiccation soil incubations. The relative richness of the host-associated vOTUs was calculated by dividing the number of host-associated vOTUs by the number of the total recovered vOTUs. b Relative abundance of the host-associated vOTUs to total vOTU abundance. c Percentage of transcriptionally active vOTUs that were host-associated. d Percentage of transcripts that were mapped to the host-associated vOTUs. Comparison of relative richness e and relative abundances f of the vOTUs infecting multiple hosts (Multiple Hosts) and the vOTUs infecting one host (One Host) in wet soils. Comparison of relative richness g and relative abundances h of the vOTUs infecting multiple hosts (Multiple Hosts) and the vOTUs infecting one host (One Host) in post-desiccation soils. The relative richness of the vOTUs infecting multiple hosts or one host was calculated by dividing the number of those vOTUs by the number of the total recovered vOTUs. Each panel contains a box plot for comparing the three biological replicates with the pre-desiccation treatment (n = 3) against the three biological replicates with the post-desiccation treatment (n = 3). Boxes colored in blue and red represent Pre-desiccation and Post-desiccation soil incubation treatments, respectively. In each boxplot, the top and bottom of each box represent the 25th and 75th percentiles, and the center line indicates the median. The upper and lower whiskers of each box represent the maximum and minimum values detected in the three biological replicates, respectively. The differences between the pre-and post-desiccation treatments were assessed using a two-sided t-test. The significant differences in all panels are highlighted by asterisks, with * representing p < 0.05 and ** p < 0.01. The exact p-values of the comparisons shown in panels ah are 0.02, 0.18, 0.009, 0.06, 0.02, 0.006, 0.28 and 0.06, respectively. Source data are provided as a Source Data file.
Fig. 4
Fig. 4. Phage–host infection network and community co-occurrence analysis.
a Phage–host infection network showing phage-host pairs that were detected in at least two replicate soils. vOTUs and their linked hosts are shown as nodes in circular and rectangular shapes, respectively. The nodes are colored by taxonomic assignment. Host–host and vOTU-vOTU edges are colored in gray and the vOTU-host edges are colored by treatment (Pre-desiccation: blue; Post-desiccation: red). Edge thickness corresponds to the number of replicates in which the vOTU-host interaction was observed. b The top five metagenome assembled genomes (MAGs) by betweenness centrality using three network inference methods. The MAGs identified as phage hosts are highlighted and colored by their taxonomic assignment following the same color scheme used in panel a. Source data are provided as a Source Data file.
Fig. 5
Fig. 5. Prevalence of phage infections in bacterial host populations.
a The viral (phage) copies per host (VPH) detected in soils pre- and post-desiccation. Each data point is a single de-replicated MAG linked to phage by Hi-C sequencing and represents a phage host population. The phage host populations are identified from at least two of the three biological replicates of the soils with the pre-desiccation (n = 49 unique populations) or post-desiccation treatment (n = 69 unique populations). Datapoints are colored by host taxonomic assignment. The top and bottom of each box represent the 25th and 75th percentiles, and the center line indicates the median. The upper and lower whiskers of each box represent the maximum and minimum values detected in the three biological replicates, respectively. The differences between the pre-and post-desiccation treatments were assessed using a two-sided t-test. The significant difference (p < 0.05) is highlighted by an asterisk (*). The exact p-value is 0.03. b, c The correlations between VPH and host abundance in soils pre- and post-desiccation, respectively. The regions shaded in dark gray along the lines represent the 95% confidence level intervals in linear regression. The significance of the regression analysis was determined by an F-test with the adjusted R2 and p-value to estimate the strength of the relationship. Source data are provided as a Source Data file.

References

    1. Williamson KE, Fuhrmann JJ, Wommack KE, Radosevich M. Viruses in soil ecosystems: an unknown quantity within an unexplored territory. Annu Rev. Virol. 2017;4:201–219. doi: 10.1146/annurev-virology-101416-041639. - DOI - PubMed
    1. Jansson, J. K. & Wu, R. Soil viral diversity, ecology and climate change. Nat. Rev. Microbiol. 1–16 (2022). - PubMed
    1. Schimel JP. Life in dry soils: effects of drought on soil microbial communities and processes. Annu Rev. Ecol. Evol. Syst. 2018;49:409–432. doi: 10.1146/annurev-ecolsys-110617-062614. - DOI
    1. Wu R, et al. Moisture modulates soil reservoirs of active DNA and RNA viruses. Commun. Biol. 2021;4:1–11. doi: 10.1038/s42003-021-02514-2. - DOI - PMC - PubMed
    1. Wu R, et al. DNA viral diversity, abundance, and functional potential vary across grassland soils with a range of historical moisture regimes. Mbio. 2021;12:e02595–02521. doi: 10.1128/mBio.02595-21. - DOI - PMC - PubMed

Publication types