. 2023 Nov 24;14(1):7682.
doi: 10.1038/s41467-023-43504-8.

The extrafollicular B cell response is a hallmark of childhood idiopathic nephrotic syndrome

Affiliations

The extrafollicular B cell response is a hallmark of childhood idiopathic nephrotic syndrome

Tho-Alfakar Al-Aubodah et al. Nat Commun. .

Abstract

The efficacy of the B cell-targeting drug rituximab (RTX) in childhood idiopathic nephrotic syndrome (INS) suggests that B cells may be implicated in disease pathogenesis. However, B cell characterization in children with INS remains limited. Here, using single-cell RNA sequencing, we demonstrate that a B cell transcriptional program poised for effector functions represents the major immune perturbation in blood samples from children with active INS. This transcriptional profile was associated with an extrafollicular B cell response marked by the expansion of atypical B cells (atBCs), marginal zone-like B cells, and antibody-secreting cells (ASCs). Flow cytometry of blood from 13 children with active INS and 24 healthy donors confirmed the presence of an extrafollicular B cell response denoted by the expansion of proliferating RTX-sensitive extrafollicular (CXCR5-) CD21low T-bet+ CD11c+ atBCs and short-lived T-bet+ ASCs in INS. Together, our study provides evidence for an extrafollicular origin for humoral immunity in active INS.


Conflict of interest statement

The authors declare no competing interests.

Figures

Fig. 1
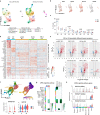
Fig. 1. B cells in INS are transcriptionally poised to acquire effector functions.
a Integrated Uniform Manifold Approximation and Projection (UMAP) of the 18 clusters of PBMC from HC (n = 4) and INS (n = 4) children. b Proportions of each broad immune cell lineage. Data are shown as box plots depicting the median (center), interquartile range (bounds of box), and min-max range (whiskers); each dot corresponds to a single donor (n = 4 HC, 4 INS); P-values were determined using individual two-sided Mann-Whitney U-tests. c Pseudobulk differential gene expression analysis between INS and HC broad cell lineages was performed with the Muscat R package using the edgeR method and a multi-dimensional scaling (MDS) plot was used to depict the results. Genes with |log2(Fold Change)| > 0.65 and Padj < 0.05 were considered significantly differentially expressed. Padj were determined using the Benjamini-Hochberg correction d Heatmap of the normalized expression of differentially expressed genes between INS and HC B cells. e Enrichment map depicting the pathway analysis results in the nephrotic B cell signature. f Bubble plots showing the expression of genes associated with B cell effector functions in the nephrotic B cell signature. OXPHOS denotes oxidative phosphorylation and FAO denotes fatty acid oxidation. g A network plot from ChEA3 depicting the transcription factors predicted to confer the nephrotic B cell signature. h A bubble plot showing the expression of three ChEA3 hits. i A gene set enrichment analysis (GSEA) plot of the Gene Ontology term “Cellular Response to Interferon Beta” (GO:0035458). Padj value was determined using the Benjamini-Hochberg correction for multiple-testing. NES, normalized enrichment score.
Fig. 2
Fig. 2. The engagement of extrafollicular B cells is a feature of active INS.
a Integrated UMAP of the ten B cell subclusters shown for HC (n = 4) and INS (n = 4). b Feature plots showing expression of IGHM, BACH2, BCL2A1, and PRDM1 in B cells. c Proportions of each B cell subcluster in HC and INS children. Data are shown as box plots depicting median (center), interquartile range (bounds of box), and min-max range (whiskers); each dot corresponds to a single donor (n = 4 HC, 4 INS); P-values were determined using individual two-sided Mann-Whitney U-tests. d Heatmap showing the expression of the most highly enriched genes in each memory B cell subcluster. e Pseudobulk differential gene expression analysis between INS and HC B cell subclusters was performed with the Muscat R package using the edgeR method and volcano plots were used to depict the results. Genes with |log2(Fold Change)| > 0.65 and Padj < 0.05 were considered significantly differentially expressed. Padj values were determined using the Benjamini-Hochberg correction f UMAP plots showing re-clustering of all B cell subclusters except ASC-1 and ASC-2 alongside the trajectory (left) and pseudotime values (right) determined by Monocle3, and violin plots showing the expression of TNFRSF13B and GPR183 in branches II and III (bottom). g Heatmaps from CellChatDB showing the relative strength of the participation of each PBMC cluster in the APRIL signaling network in HC and INS (left), and the importance of each PBMC cluster in INS as acting as “sender”, “modulator”, or “receiver” cell types within the APRIL signaling network. h Violin plots showing the expression of genes within the APRIL signaling network across participating PBMC clusters in HC and INS. actMBC, activated memory B cells; MBC-2, memory B cell cluster 2; MZ-like, marginal zone-like B cells; SM, isotype-switched memory B cells; atBC, atypical B cells; ASC, antibody-secreting cells.
Fig. 3
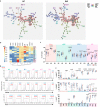
Fig. 3. CD21low CXCR5 B cells and ASCs are actively expanding in active INS.
a Minimal spanning trees (MST) of HC (n = 24) and INS (n = 13) B cells generated by FlowSOM clustering. The 14 metaclusters (M0-M13) are labeled on both MSTs. Arrowheads indicate key cell clusters expanded in INS. b Heatmap showing the geometric mean fluorescence intensities (gMFI) of the markers used for clustering in each metacluster. c Proportions of each metacluster in HC (n = 24) and INS (n = 13) PBMC. d, e Histograms of CD21, CXCR5, and Ki-67 in the six metaclusters enriched in INS (d) with quantification of the proportions of CD21low, CXCR5+, and Ki-67+ cells in each metacluster from HC (n = 24) and INS (n = 13) B cells (e). Data are shown as median with 95% confidence intervals and P-values were determined by two-sided Mann-Whitney U-tests in (ce). Each data point corresponds to a single donor. The yellow data point represents the child with glucocorticoid-resistant membranous nephropathy. cMBC, classical memory B cells; ASC, antibody-secreting cells.
Fig. 4
Fig. 4. CD21low T-bet+ atBCs and ASCs are a hallmark of childhood INS.
a Representative flow plots highlighting T-bet+CD11c+ cells (aquamarine) in the CD21low (CD21low CD19+ CD10 CD20+ CD38-/low) and cMBC (CD27+ CD21+ CD19+ CD10 CD20+ CD38-/low) mature B cell compartments. Proportions of T-bet+ CD11c+ among CD21low and cMBC mature B cells (left graph) in HC (n = 24) and INS (n = 13) along with linear regression analysis between the proportions of T-bet+ CD11c+ and CD21low mature B cells (right graph). b Representative flow plots of atBCs (T-bet+ CD11c+ mature B cells) in HC and INS. Quantification of the proportion of atBCs (left graph) and isotype-switched (IgM IgD) atBCs (right graph) in HC (n = 24) and INS (n = 13) B cells. c, d Histograms showing T-bet (c) and FcRL5 (d) expression in HC (n = 24) and INS (n = 13) atBC with quantification of MFIs and cell frequencies. e Representative flow plots highlighting ASCs (pink) in total B cells. Quantification of the proportions of ASCs in HC (n = 24) and INS (n = 13) B cells (top right graph) and their isotype distributions (bottom right graph). f, g Histograms showing T-bet (f) and FcRL5 (g) expression in HC (n = 24) and INS (n = 13) ASCs with quantification of cell frequencies. Data are shown as median with 95% confidence intervals and P-values were determined by two-sided Mann-Whitney U-tests (bg) two-way ANOVA with Tukey’s multiple testing ((a) left, (e) bottom), or Pearson’s correlation ((a) right). Each data point corresponds to a single donor. The yellow data point represents the child with glucocorticoid-resistant membranous nephropathy. cMBC classical memory B cells, atBC atypical B cells, ASC antibody-secreting cells.
Fig. 5
Fig. 5. atBCs and ASCs are effectively targeted by RTX.
a Schematic representing the patient groups from which PBMC were obtained in the observational longitudinal cohort. Rem-GC, remission on glucocorticoids; Rem-RTX, remission maintained by rituximab; Rel-RTX, relapse following rituximab (b) Representative flow plots from each patient group showing total B cells (CD19+, top), and mature B cells (CD19+ CD10 CD20+, bottom). Colored boxes denote ASCs (pink), cMBC (teal), and CD21low atBCs (aquamarine). ce Absolute numbers of total (c), naïve (d), and memory (e) B cell populations in the blood of INS (n = 13), Rem-GC (n = 14), and Rem-RTX (n = 14) individuals. fh Proportions of total (f) naïve (g) and memory (h) B cells in the blood of Rem-RTX (n = 14) and Rel-RTX (n = 7) individuals. Data are shown as median with 95% confidence intervals and P-values were determined by Kruskal–Wallis tests with Dunn’s multiple comparisons (ce) or two-sided Mann-Whitney U-tests (fh). Each data point corresponds to a single donor. Trans transitional, Mat mature, cMBC classical memory B cells, atBC atypical B cells, ASC antibody-secreting cells.
Fig. 6
Fig. 6. Post-RTX relapses are associated with a nascent resurgence in extrafollicular B cells.
a Integrated UMAP of total B cells (left) obtained during B cell recovery from four individuals who relapsed following RTX treatment (Rel-RTX, n = 4) and were subsequently treated with GC and RTX to maintain long-term remission (Rem-RTX, n = 4). Rel-RTX, relapse following rituximab; Rem-RTX, remission maintained by rituximab b Heatmap showing expression of B cell subcluster genes identified in Fig. 2c. c Proportions of B cell clusters. Data are shown as box plots with median (center), interquartile range (bounds of box), and min-max range (whiskers); P-values were determined using individual paired two-sided t-tests. Each pair of dots corresponds to a single donor sampled at Rel-RTX and Rem-RTX time points (n = 4/group). d Feature and violin plots showing the module score for the MZ-like B cell signature in total B cells. e Differential gene expression analysis between Rel-RTX and Rem-RTX memory B cells was performed using the Seurat FindMarkers function. MA plot showing the differential expression of genes between Rel-RTX and Rem-RTX memory B cells. f A Venn diagram showing the overlap between the nephrotic B cell signature and the most enriched genes in Rel-RTX B cells. Genes with |log2(Fold Change)| > 0.1, Padj < 0.01 and a minimum percent expression of 15% were considered differentially expressed; Padj values were determined using Wilcoxon Rank Sum tests with Bonferroni correction. MZ-like, marginal zone-like B cells; SM, isotype-switched memory B cells; atBC, atypical B cells; ASC, antibody-secreting cells.

References

    1. Noone DG, Iijima K, Parekh R. Idiopathic nephrotic syndrome in children. Lancet. 2018;392:61–74. - PubMed
    1. Eddy AA, Symons JM. Nephrotic syndrome in childhood. Lancet. 2003;362:629–639. - PubMed
    1. Samuel SM, et al. Setting new directions for research in childhood nephrotic syndrome: results from a national workshop. Can. J. Kidney Health Dis. 2017;4:2054358117703386. - PMC - PubMed
    1. Liu, J. & Guan, F. B cell phenotype, activity, and function in idiopathic nephrotic syndrome. Pediatr. Res.10.1038/s41390-022-02336-w (2022). - PubMed
    1. Takei T, et al. Effect of single-dose rituximab on steroid-dependent minimal-change nephrotic syndrome in adults. Nephrol. Dial. Transpl. 2013;28:1225–1232. - PubMed

Publication types

Associated data