. 2023 Nov 23;13(1):20584.
doi: 10.1038/s41598-023-47905-z.

Characterization of gut microbiome composition in Iranian patients with nonalcoholic fatty liver disease and nonalcoholic steatohepatitis

Affiliations

Characterization of gut microbiome composition in Iranian patients with nonalcoholic fatty liver disease and nonalcoholic steatohepatitis

Sara Abdollahiyan et al. Sci Rep. .

Abstract

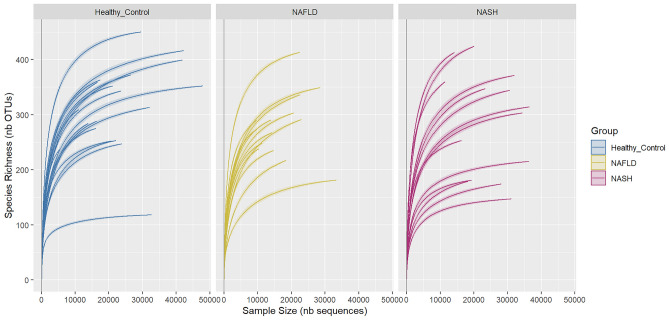
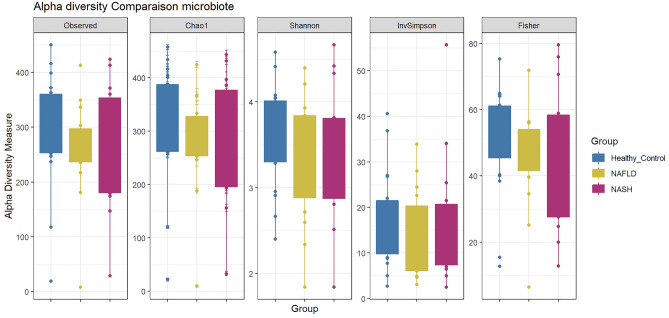
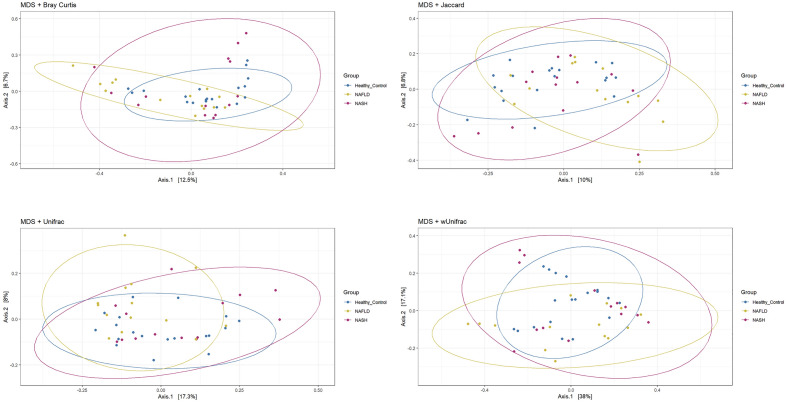
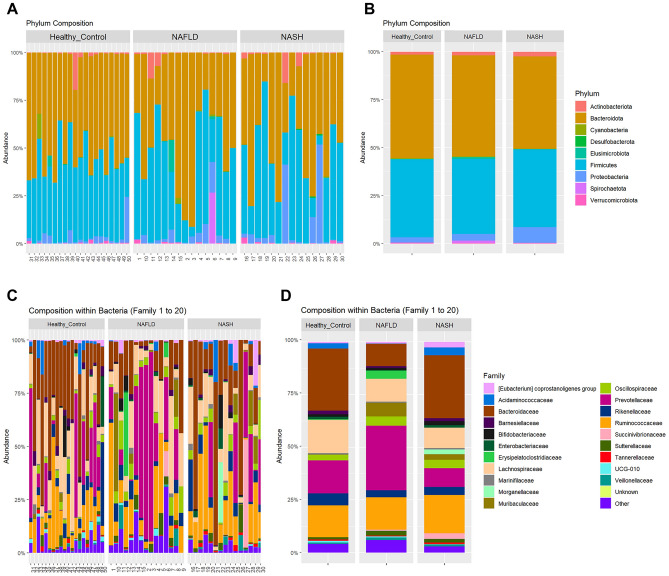
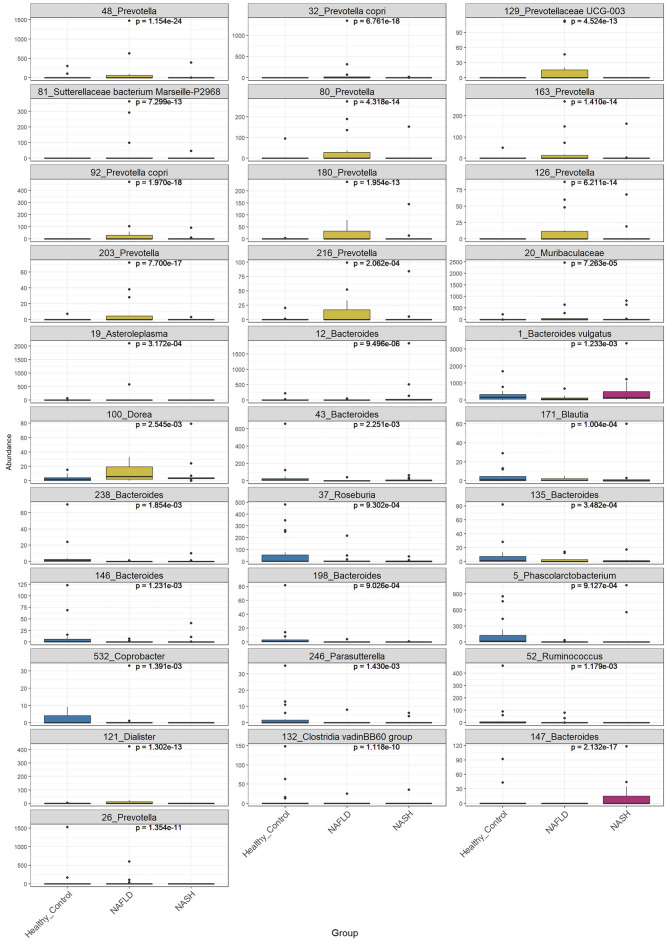
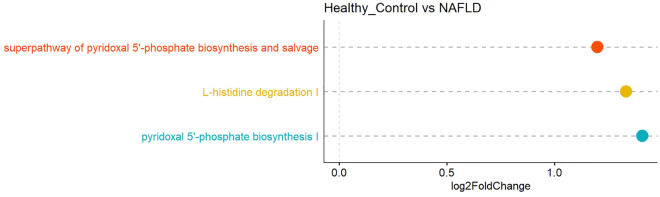
Gut microbiota dysbiosis is intimately associated with development of non-alcoholic fatty liver disease (NAFLD) and nonalcoholic steatohepatitis (NASH). Nevertheless, the gut microbial community during the course of NAFLD and NASH is yet to be comprehensively profiled. This study evaluated alterations in fecal microbiota composition in Iranian patients with NAFLD and NASH compared with healthy individuals. This cross-sectional study enrolled 15 NAFLD, 15 NASH patients, and 20 healthy controls, and their clinical parameters were examined. The taxonomic composition of the fecal microbiota was determined by sequencing the V3-V4 region of 16S rRNA genes of stool samples. Compared to the healthy controls, NAFLD and NASH patients presented reduced bacterial diversity and richness. We noticed a reduction in the relative abundance of Bacteroidota and a promotion in the relative abundance of Proteobacteria in NAFLD and NASH patients. L-histidine degradation I pathway, pyridoxal 5'-phosphate biosynthesis I pathway, and superpathway of pyridoxal 5'-phosphate biosynthesis and salvage were more abundant in NAFLD patients than in healthy individuals. This study examined fecal microbiota dysbiosis in NAFLD and NASH patients and presented consistent results to European countries. These condition- and ethnicity-specific data could provide different diagnostic signatures and therapeutic targets.


Conflict of interest statement

The authors declare no competing interests.

Figures

Figure 1
Figure 1
Rarefaction curves of all 16S rRNA amplicon for fecal samples in each study group based on Miseq sequencing technology (Illumina).
Figure 2
Figure 2
Alpha diversity measure using observed, Chao1, Shannon, InvSimpson and Fisher indices. The significance of differences between diversities were evaluated by Tukey post-hoc test statistical analysis.
Figure 3
Figure 3
PCA plot based on the Bray–Curtis dissimilarity, Jaccard distance, UniFrac distance, and weighted UniFrac (wUnifrac) distance between samples. Samples from healthy, NAFLD, and NASH patients are not clearly distinct from each other, indicating delicate differences in microbiome structures.
Figure 4
Figure 4
The relative percentage and alteration of the gut microbiota in stool samples of healthy controls, NAFLD, and NASH patients. (A) Phylum-level composition of the gut microbiota in each individual. (B) Phylum-level composition of the gut microbiota in each group. (C) Family-level composition of the gut microbiota in each individual. (D) Family-level composition of the gut microbiota in each group. Each color represents a type of microbiota analyzed in this study.
Figure 5
Figure 5
Boxplots of OTUs for which the abundance was significantly different between healthy controls, NAFLD, and NASH patients. Control vs NAFLD (9 up and 9 down), control vs NASH (2 up and 2 down), and NAFLD vs NASH (6 up and 1 down). (*P < 0.05; **P < 0.01; ***P < 0.001; ****P < 0.0001).
Figure 6
Figure 6
Correlation plot between individuals’ metadata and fecal microbiota composition at the phylum-level, (A) healthy controls, (B) NAFLD, and (C) NASH patients. Spearman correlation presented no statistically significant correlation between the indices. The heatmaps have been generated using the R package corrplot (version 0.92, https://www.rdocumentation.org/packages/corrplot/versions/0.92).
Figure 7
Figure 7
Differentially abundant pathways in the gut microbiome of healthy controls and NAFLD patients using Picrust analysis. There were no substantial differences comparing the NASH group with the control group or the NAFLD group.

References

    1. Idalsoaga F, Kulkarni AV, Mousa OY, Arrese M, Arab JP. Non-alcoholic fatty liver disease and alcohol-related liver disease: Two intertwined entities. Front. Med. 2020;7:448. doi: 10.3389/fmed.2020.00448. - DOI - PMC - PubMed
    1. Bashir A, Duseja A, De A, Mehta M, Tiwari P. Non-alcoholic fatty liver disease development: A multifactorial pathogenic phenomena. Liver Res. 2022;6(2):72–83. doi: 10.1016/j.livres.2022.05.002. - DOI
    1. Dyson JK, Anstee QM, McPherson S. Non-alcoholic fatty liver disease: A practical approach to diagnosis and staging. Frontline Gastroenterol. 2014;5(3):211–218. doi: 10.1136/flgastro-2013-100403. - DOI - PMC - PubMed
    1. Anushiravani A, Sepanlou SG. Burden of liver diseases: A review from Iran. Middle East J. Digest. Dis. 2019;11(4):189. doi: 10.15171/mejdd.2019.147. - DOI - PMC - PubMed
    1. Kawano Y, Cohen DE. Mechanisms of hepatic triglyceride accumulation in non-alcoholic fatty liver disease. J. Gastroenterol. 2013;48(4):434–441. doi: 10.1007/s00535-013-0758-5. - DOI - PMC - PubMed