. 2024 Feb;5(2):240-261.
doi: 10.1038/s43018-023-00668-y. Epub 2023 Nov 23.

Cytokine-armed dendritic cell progenitors for antigen-agnostic cancer immunotherapy

Affiliations

Cytokine-armed dendritic cell progenitors for antigen-agnostic cancer immunotherapy

Ali Ghasemi et al. Nat Cancer. 2024 Feb.

Abstract

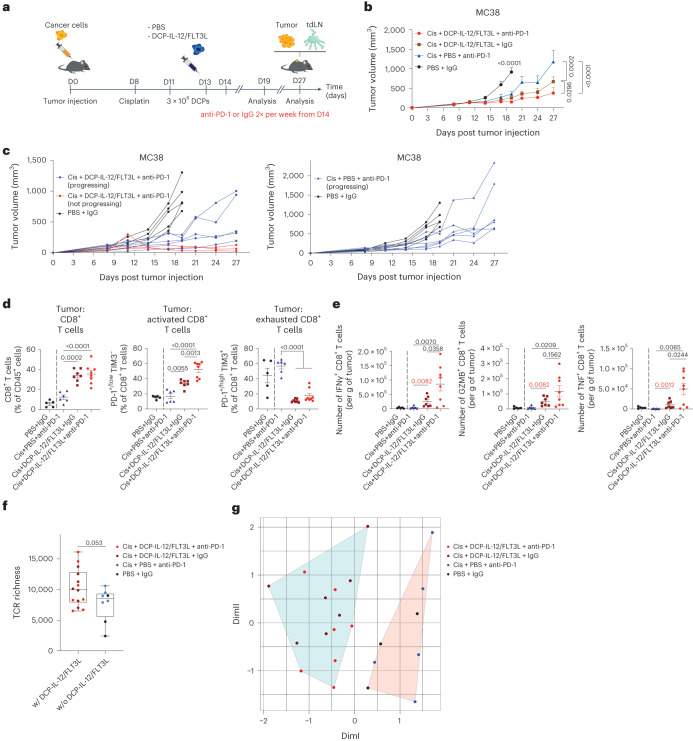
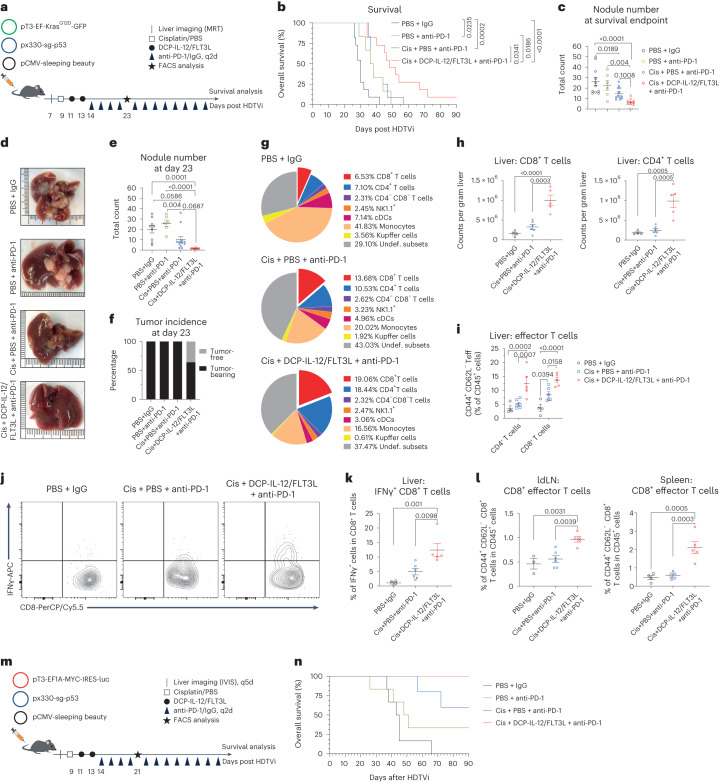
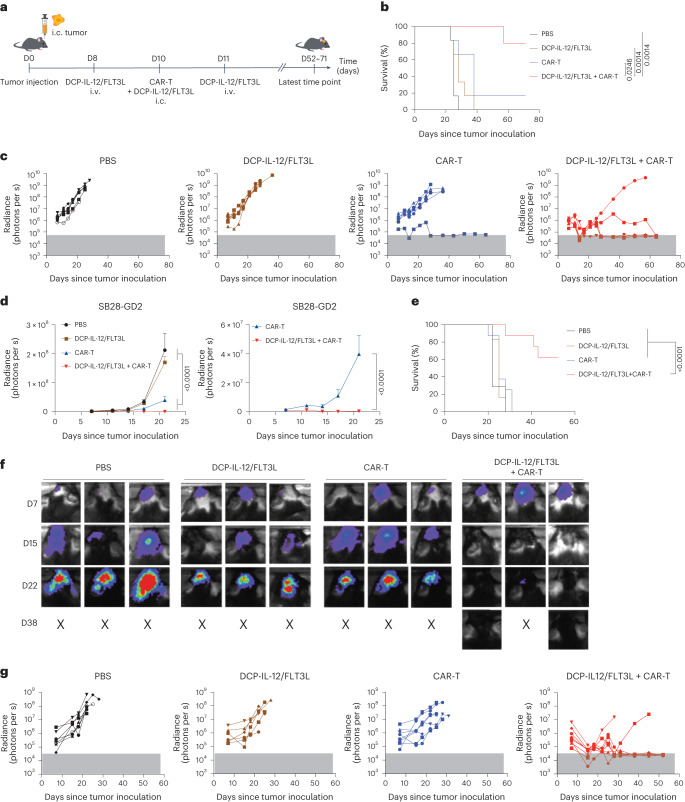
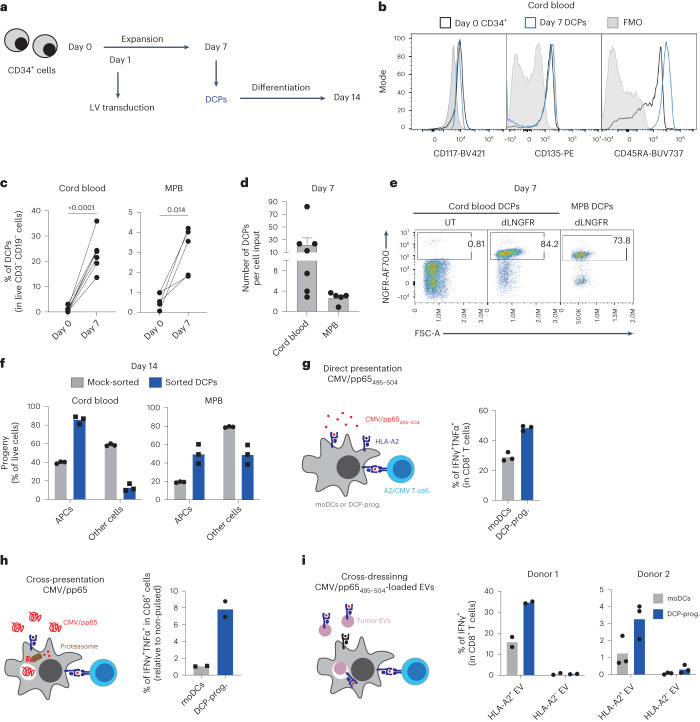
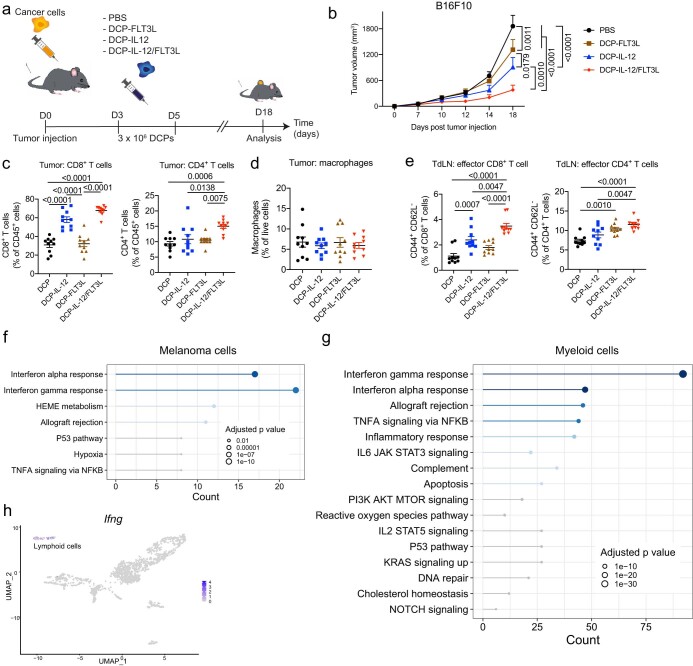
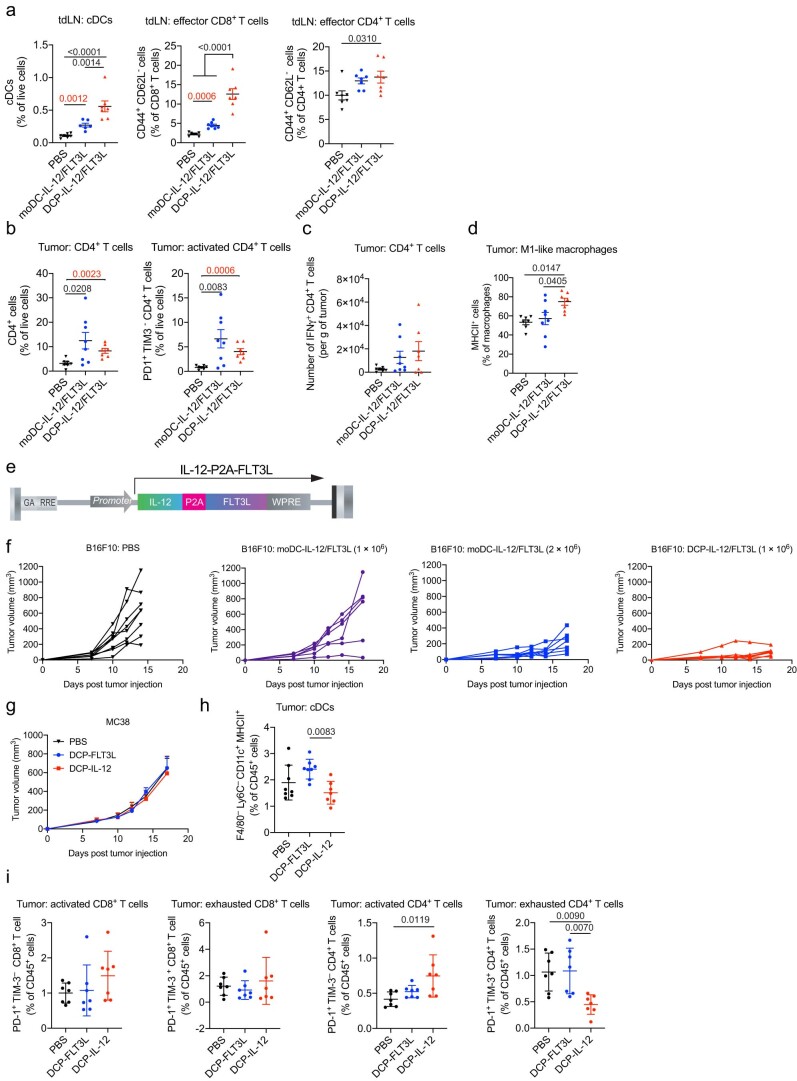
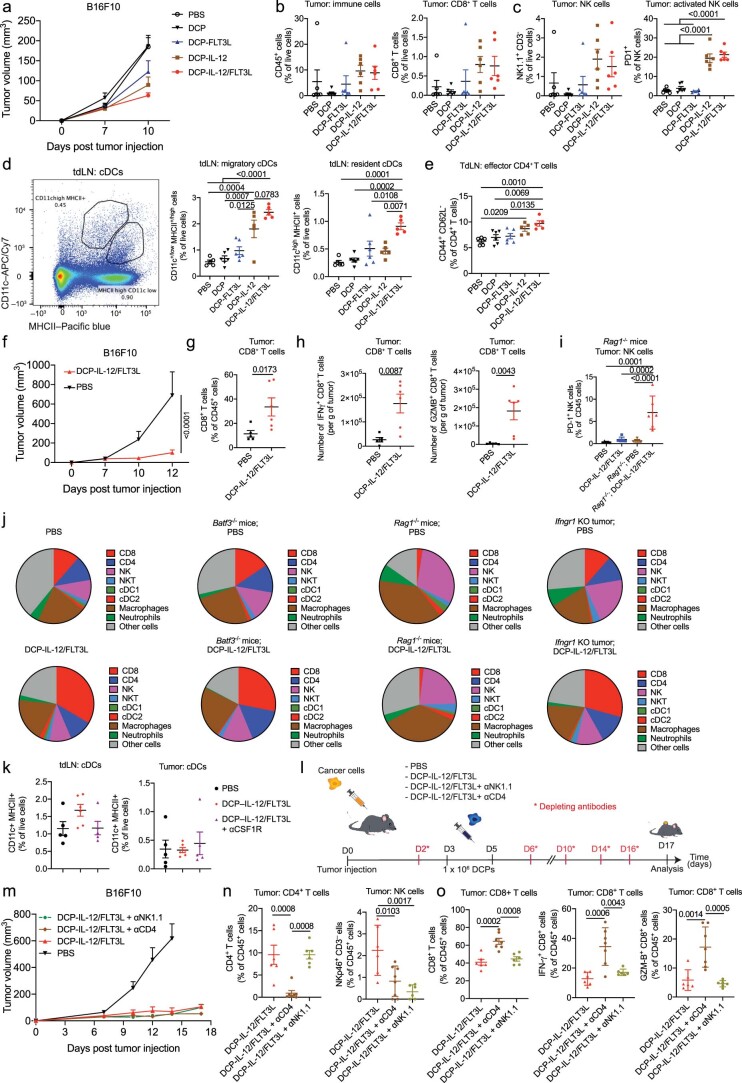
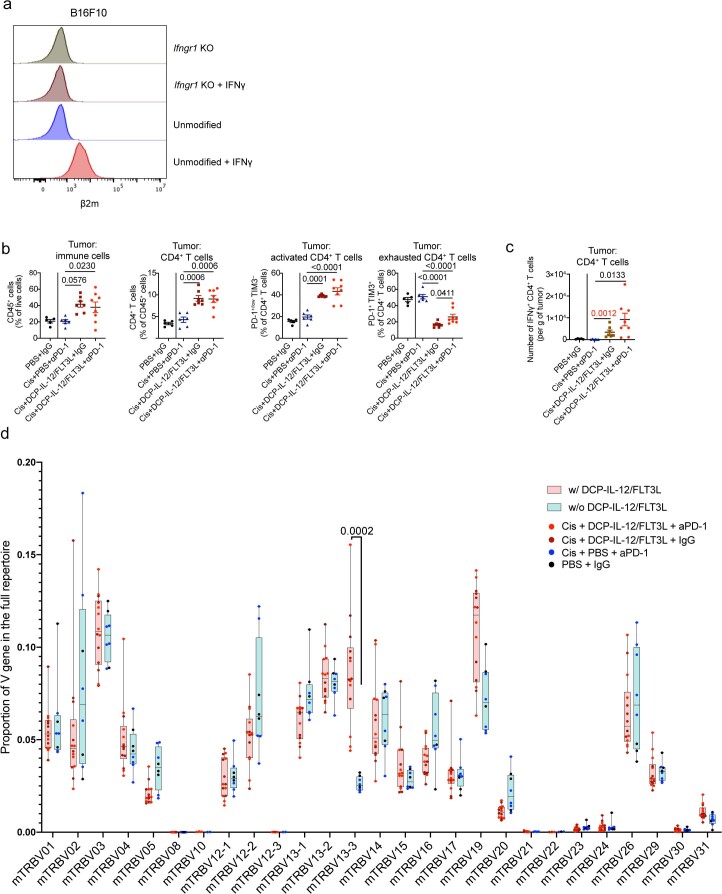
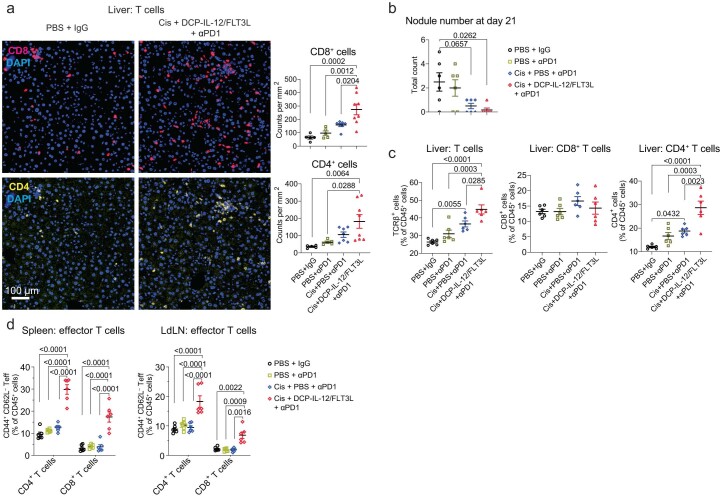
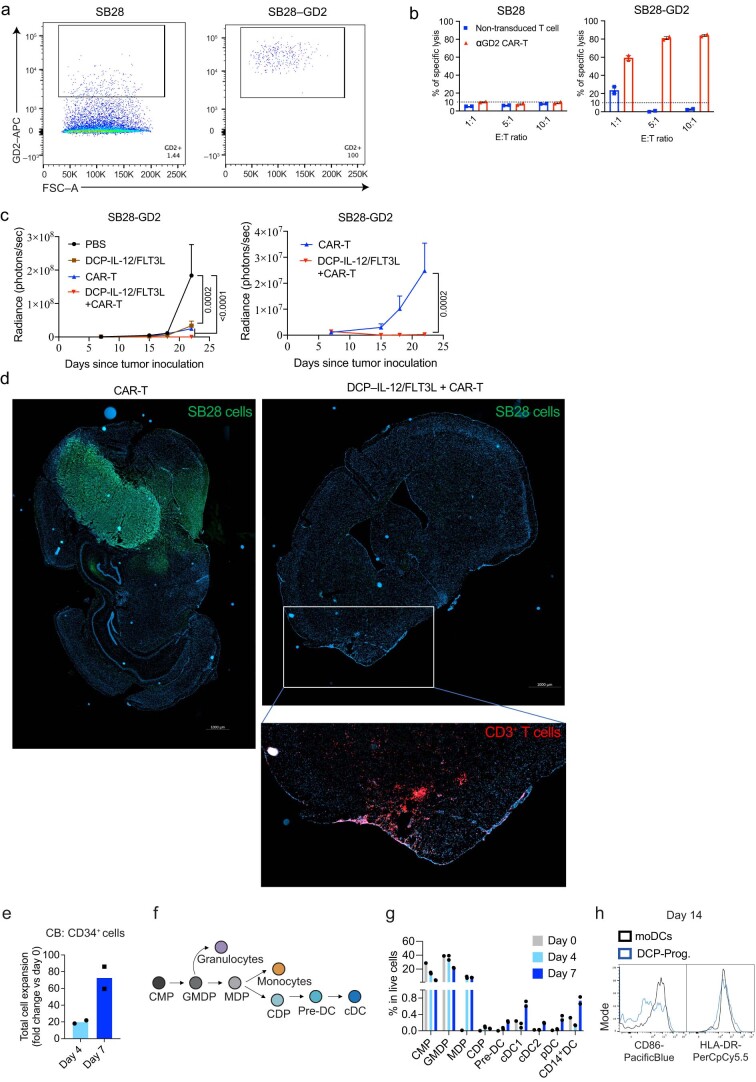
Dendritic cells (DCs) are antigen-presenting myeloid cells that regulate T cell activation, trafficking and function. Monocyte-derived DCs pulsed with tumor antigens have been tested extensively for therapeutic vaccination in cancer, with mixed clinical results. Here, we present a cell-therapy platform based on mouse or human DC progenitors (DCPs) engineered to produce two immunostimulatory cytokines, IL-12 and FLT3L. Cytokine-armed DCPs differentiated into conventional type-I DCs (cDC1) and suppressed tumor growth, including melanoma and autochthonous liver models, without the need for antigen loading or myeloablative host conditioning. Tumor response involved synergy between IL-12 and FLT3L and was associated with natural killer and T cell infiltration and activation, M1-like macrophage programming and ischemic tumor necrosis. Antitumor immunity was dependent on endogenous cDC1 expansion and interferon-γ signaling but did not require CD8+ T cell cytotoxicity. Cytokine-armed DCPs synergized effectively with anti-GD2 chimeric-antigen receptor (CAR) T cells in eradicating intracranial gliomas in mice, illustrating their potential in combination therapies.


Conflict of interest statement

M.D.P. has received sponsored research grants from EVIR Therapeutics, Hoffmann La-Roche and Deciphera Pharmaceuticals, serves on the Scientific Advisory Boards of EVIR Therapeutics, Montis Biosciences, Macomics, Deciphera Pharmaceuticals, Light Chain Bioscience/Novimmune and Genenta, and is an inventor on patents on engineered DCs filed by EPFL. D.M. is a consultant for Limula and MPC Therapeutics, scientific co-founder of Cellula Therapeutics and is an inventor on patents related to CAR-T cell therapy filed by the University of Pennsylvania, Istituto Oncologico della Svizzera Italiana (IOSI) and the University of Geneva. The other authors declare no conflict of interest.

Figures

Fig. 1
Fig. 1. DCPs efficiently generate cDCs in mice.
a, Procedure to generate DCPs from the mouse BM cells. b, Phenotype of DCPs after enrichment of lineage-negative cells. c, Procedure to study the fate of adoptively transferred DCPs, moDCs or cDC1-like cells in tumor-free mice. All DC types were generated from the BM of CD45.1 mice and transferred to CD45.2 mice. d, Engraftment of CD45.1+ cells derived from DCPs, moDCs and cDC1-like cells (mean ± s.e.m.; n = 3 mice for PBS and n = 4 for DCPs, moDCs and cDC1-like cells) in the spleen of recipient mice, 4 days after the last cell dose. Statistical analysis by one-way ANOVA with Tukey’s multiple comparison test. e, Donor cell chimerism in cDC1 and cDC2 (mean ± s.e.m.; n = 3 mice for PBS and n = 4 for DCPs, moDCs and cDC1-like cells). Statistical analysis by one-way ANOVA with Tukey’s multiple comparison test. f, Pie chart showing the fate of DCPs in the spleen (mean values; n = 4 mice). Double-negative (DN) DCs are defined as CD8a CD11b cDCs. Other cells mostly comprise CD11c+ MHCII–/low immature DCs. g, Procedure to study the fate of DCPs in MC38 tumor-bearing mice. h, Engraftment of CD45.1+ cells derived from DCPs, moDCs and cDC1-like cells (mean ± s.e.m.; n = 7 mice for PBS and n = 8 for DCPs, moDCs and cDC1-like cells) in the tumor of recipient mice, 4 days after the last cell dose. Statistical analysis by one-way ANOVA with Tukey’s multiple comparison test. i, Donor cell chimerism in cDC1, cDC2 and macrophages in the tumor of recipient mice (mean ± s.e.m.; n = 7 mice for PBS and n = 8 for DCPs, moDCs and cDC1-like cells). Statistical analysis by one-way ANOVA with Tukey’s multiple comparison test. Each data point represents one sample from an independent mouse. Source data
Fig. 2
Fig. 2. Cytokine-armed DCPs activate immunity and inhibit melanoma growth.
a, Procedure to study transfer of cytokine-armed DCPs in B16F10 tumor-bearing mice. b, B16F10 tumor growth (mean  ± s.e.m.; n = 10 mice). Statistical analysis by two-way ANOVA with Tukey’s multiple comparison test; red P value was calculated by two-way ANOVA with Sidak’s multiple comparison test on DCP-IL-12 versus DCP-IL-12/FLT3L. c, Concentration of IL-12 and FLT3L in serum (mean ± s.e.m.; PBS, n = 5 mice; other groups, n = 6) of mice shown in Extended Data Fig. 5b, analyzed by ELISA at the indicated time points after the last DCP infusion. d, Frequency of the indicated cell types in tumors (mean ± s.e.m.; n = 10 mice). Statistical analysis by one-way ANOVA with Tukey’s multiple comparison test. e, IFNγ expression by ex vivo re-stimulated CD8+ and CD4+ T cells (mean ± s.e.m.; n = 10 mice in all groups, except for DCP where n = 8). Statistical analysis by one-way ANOVA with Tukey’s multiple comparison test. f, Left: representative images of CD3 (yellow) and CD8 (magenta) immunostaining, and DAPI nuclear staining (blue), of tumors from mice treated as indicated. Scale bar, 50 μm. Right: quantification of the data (mean ± s.e.m.; n = 6 mice for PBS and n = 8 for DCP-IL-12/FLT3L). Statistical analysis by two-tailed Mann–Whitney test. g, Frequency of M1-like TAMs in tumors (mean ± s.e.m.; n = 10 mice). Statistical analysis by one-way ANOVA with Tukey’s multiple comparison test. h, Annotation of main cell populations identified by scRNA-seq of B16F10 tumors. The uniform manifold approximation and projection (UMAP) plot shows merged samples from both PBS and DCP-IL-12/FLT3L-treated mice. i, Expression of Tyrp1 and Cd68 shown on the UMAP. j, Most deregulated pathways in cancer cells (identified by Tyrp1 expression) and myeloid cells (identified by Cd68 expression) upon DCP-IL-12/FLT3L computed by overrepresentation analysis using Reactome pathways. Statistical analysis by one-tailed Fisher’s exact test followed by Benjamini–Hochberg P value correction. Pathways in blue are significant by adjusted P value. k, Left: representative images of real-size tumors immunostained for CD31 (green, endothelial cells) and stained with DAPI (blue), from mice treated as indicated. Scale bar, 250 μm. Right: quantification of the CD31+ area (mean ± s.e.m.; n = 6 mice for PBS and n = 8 for DCP-IL-12/FLT3L). Statistical analysis by two-tailed Mann–Whitney test. Each data point represents one sample from an independent mouse except for b, in which each data point represents the mean volume of independent tumors. Source data
Fig. 3
Fig. 3. DCPs offer an effective cytokine-delivery platform alternative to moDCs.
a, Procedure to study cytokine-armed DCPs and moDCs in B16F10 tumor-bearing mice. b, B16F10 tumor growth (mean ± s.e.m.; PBS, n = 7 mice; DCP-IL-12/FLT3L, n = 7; moDC-IL-12/FLT3L, n = 8). Statistical analysis by two-way ANOVA with Tukey’s multiple comparison test. c, Frequency of the indicated cell types in B16F10 tumors (mean ± s.e.m.; PBS, n = 7 mice; DCP-IL-12/FLT3L, n = 7; moDC-IL-12/FLT3L, n = 8). Statistical analysis by one-way ANOVA with Tukey’s multiple comparison test; P values in red were calculated by Mann–Whitney test on PBS versus moDC-IL-12/FLT3L. d, IFNγ, GZMB and TNF expression by ex vivo re-stimulated T cells (mean ± s.e.m.; PBS, n = 7 mice; DCP-IL-12/FLT3L, n = 7; moDC-IL-12/FLT3L, n = 8). Statistical analysis by one-way ANOVA with Tukey’s multiple comparison test. e, Pie charts showing the cell composition of B16F10 tumors (mean values; PBS, n = 7 mice; DCP-IL-12/FLT3L, n = 7; moDC-IL-12/FLT3L, n = 8). f, Procedure to study cytokine-armed DCPs and moDCs in B16F10 tumor-bearing mice. g, B16F10 tumor growth (mean ± s.e.m.; PBS, n = 8 mice; DCP-IL-12/FLT3L (1 × 106), n = 7; moDC-IL-12/FLT3L (1 × 106), n = 6; moDC-IL-12/FLT3L (2 × 106), n = 7). Left, tumor volume over time; right, tumor volume at endpoint (day 17). Statistical analysis by two-way ANOVA with Tukey’s multiple comparison test; P value in red was calculated by two-way ANOVA with Sidak’s multiple comparison test on DCP-IL-12/FLT3L (1 × 106) versus moDC-IL-12/FLT3L (2 × 106). Statistical analysis at day 17 by two-tailed Mann–Whitney test. Note that the PBS and DCP-IL-12/FLT3L group datasets are also shown in Extended Data Fig. 7m, as the two studies were conducted in parallel. h, MC38 tumor growth (mean ± s.e.m.; n = 10 mice). Statistical analysis by two-way ANOVA with Sidak’s multiple comparison test. i,j, Frequency of the indicated cell types in MC38 tumors (mean ± s.e.m.; DCP, n = 10 mice; DCP-IL-12/FLT3L, n = 8 in i and n = 9 in). Statistical analysis by two-tailed Mann–Whitney test. k, Pie charts showing the cell composition of MC38 tumors (mean values; DCP, n = 10 mice; DCP-IL-12/FLT3L, n = 8). l, Frequency of the indicated cell types in MC38 tdLNs (mean ± s.e.m.; n = 10 mice). Statistical analysis by two-tailed Mann–Whitney test. Each data point represents one sample from an independent mouse except for b, g and h, in which each point represents the mean volume of independent tumors. Source data
Fig. 4
Fig. 4. Tumor response to cytokine-armed DCPs is cDC1 and IFNγ-dependent but does not require CD8+ T cells.
a, Procedure to study cytokine-armed DCPs in B16F10 tumor-bearing mice (early time point). bd, Frequency of the indicated cell types in tumors (mean ± s.e.m.; n = 6 mice) and tdLNs (PBS, n = 5 mice; DCP, n = 6; DCP-FLT3L, n = 6; DCP-IL-12, n = 5; DCP-IL-12/FLT3L, n = 5). Statistical analysis by one-way ANOVA with Tukey’s multiple comparison test. e, B16F10 tumor growth in Batf3–/– mice (mean volume ± s.e.m.; n = 6 mice). Statistical analysis by two-way ANOVA with Sidak’s multiple comparison test (not significant). f, Frequency of CD8+ T cells in tumors of Batf3–/– mice (mean ± s.e.m.; n = 6 mice). Statistical analysis by two-tailed Mann–Whitney test. g, IFNγ and GZMB expression by ex vivo re-stimulated T cells (mean ± s.e.m.; n = 6 mice). Statistical analysis by two-tailed Mann–Whitney test (N.S., not significant). h, B16F10 tumor growth in Rag1–/– mice (mean  ± s.e.m.; n = 6 mice). Statistical analysis by two-way ANOVA with Sidak’s multiple comparison test. i, Procedure to study cell or cytokine depletion. j, B16F10 tumor growth (mean ± s.e.m.; PBS, n = 5 mice; DCP-IL-12/FLT3L, DCP-IL-12/FLT3L + aCD8a and DCP-IL-12/FLT3L + aCD8a/CD4/NK1.1, n = 6; DCP-IL-12/FLT3L + aCSF1R and DCP-IL-12/FLT3L + aIFNγ, n = 5). Statistical analysis by two-way ANOVA with Tukey’s multiple comparison test. The PBS and DCP-IL-12/FLT3L datasets are also shown in Extended Data Fig. 5b (the two studies were conducted in parallel). k, Representative images of F4/80 (white), CD3 (orange) or CD8β (white) immunostaining of B16F10 tumors. Scale bar, 2 mm (top) or 50 μm (middle and bottom). l, Quantification of immune cells in tumors (mean ± s.e.m.; PBS, n = 5 mice, except for NKp46 staining where n = 4; DCP-IL-12/FLT3L, DCP-IL-12/FLT3L + aCD8a and DCP-IL-12/FLT3L + aCD8a/CD4/NK1.1, n = 6, except for NKp46 staining in DCP-IL-12/FLT3L + aCD8a/CD4/NK1.1 where n = 5; DCP-IL-12/FLT3L + aCSF1R and DCP-IL-12/FLT3L + aIFNγ, n = 5). Statistical analysis by one-way ANOVA with Tukey’s multiple comparison (F4/80) or Kruskal–Wallis test with Sidak’s multiple comparison (CD3, CD8β, NKp46). m, Ifngr1-knockout (KO) B16F10 tumor growth (mean ± s.e.m.; n = 6 mice). Statistical analysis by two-way ANOVA with Sidak’s multiple comparison test. n, Frequency of CD8+ T cells in Ifngr1-knockout B16F10 tumors (mean ± s.e.m.; n = 6 mice). Statistical analysis by two-tailed Mann–Whitney test. o, IFNγ and GZMB expression by ex vivo re-stimulated T cells from Ifngr1-knockout B16F10 tumors (mean ± s.e.m.; n = 6 mice). Statistical analysis by two-tailed Mann–Whitney test. Each data point represents one sample from an independent mouse except for e, h, j and m, in which each point represents the mean volume of independent tumors. Source data
Fig. 5
Fig. 5. Cytokine-armed DCPs improve the efficacy of cisplatin and PD-1 blockade in a colorectal cancer model.
a, Procedure to study MC38 tumor response to cytokine-armed DCPs in combination with cisplatin (cis) and anti-PD-1. b,c, MC38 tumor growth showing mean tumor growth (b) and growth of individual tumors (c). Data show tumor volume (mean ± s.e.m.; PBS + IgG, n = 5 mice; cis + PBS + anti-PD-1, n = 6; cis + DCP-IL-12/FLT3L + IgG, n = 7; cis + DCP-IL-12/FLT3L + anti-PD-1, n = 8). Statistical analysis by two-way ANOVA with Tukey’s multiple comparison test. d, Frequency of the indicated cell types in MC38 tumors (mean ± s.e.m.; PBS + IgG, n = 5 mice; cis + PBS + anti-PD-1, n = 6; cis + DCP-IL-12/FLT3L + IgG, n = 7; cis + DCP-IL-12/FLT3L + anti-PD-1, n = 8). Statistical analysis by one-way ANOVA with Tukey’s multiple comparison test (the analysis excludes tumors in the PBS + IgG group, which were processed independently). e, IFNγ, GZMB and TNF expression by ex vivo re-stimulated T cells (mean ± s.e.m.; PBS + IgG, n = 5 mice; cis + PBS + anti-PD-1, n = 6; cis + DCP-IL-12/FLT3L + IgG, n = 7; cis + DCP-IL-12/FLT3L + anti-PD-1, n = 8). Statistical analysis by one-way ANOVA with Tukey’s multiple comparison test (black P values) or two-tailed Mann–Whitney test (red P values, comparing two groups of interest). f, Diversity of TCR repertoire (PBS + IgG, n = 3 mice; cis + PBS + anti-PD-1, n = 5; cis + DCP-IL-12/FLT3L + IgG, n = 7; cis + DCP-IL-12/FLT3L + anti-PD-1, n = 7) assessed in bulk TCR sequencing (TCR-seq) on mRNAs isolated from fresh–frozen MC38 tumor samples. TCR diversity was estimated by TCR richness. Box plots show median (central bar), numerical data through their third and first quartiles (box), and maximum and minimum values (whiskers). All tumors from mice that received DCP-IL-12/FLT3L were combined and compared with tumors from mice that did not receive DCP-IL-12/FLT3L. Statistical analysis by two-tailed Student’s t-test after normality testing by Shapiro–Wilk test and QQ plot visualization. g, K-means clustering of bulk TCR-seq data based on V gene usage, showing separation of samples containing DCP-IL-12/FLT3L (n values as in f). Each data point represents one sample or tumor measurement from an independent mouse except for b, in which each data point represents the mean volume of independent tumors. Source data
Fig. 6
Fig. 6. Cytokine-armed DCPs are effective in two genetically engineered liver cancer models.
a, Induction and treatment of KrasG12D; Trp53–/– liver tumors. Mice were monitored for up to 90 days. b, Survival of KrasG12D; Trp53–/– tumor-bearing mice (PBS + IgG, n = 11 mice, 30 days; PBS + anti-PD-1, n = 6, 37 days; cis + PBS + anti-PD-1, n = 12, 37 days; cis + DCP-IL-12/FLT3L + anti-PD-1, n = 11, 48 days). Statistical analysis by log-rank Mantel–Cox test. Two independent experiments combined (one mouse was terminated while being tumor-free). c, Number of KrasG12D; Trp53–/– liver nodules (mean ± s.e.m.) at survival endpoint (n values as in b). Statistical analysis by one-way ANOVA with Turkey’s multiple comparisons test. d, Representative KrasG12D; Trp53–/– livers analyzed at day 23. Two independent experiments combined. e, Number of KrasG12D; Trp53–/– liver nodules at day 23 (mean ± s.e.m.; PBS + IgG, n = 9 mice; PBS + anti-PD-1, n = 6; cis + PBS + anti-PD-1, n = 12; cis + DCP-IL-12/FLT3L + anti-PD-1, n = 11). Two independent experiments combined. Statistical analysis by one-way ANOVA with Turkey’s multiple comparisons test. f, KrasG12D; Trp53–/– tumor incidence at day 23 (n values as in d). Two independent experiments combined. g, Pie charts showing immune cell composition of KrasG12D; Trp53–/– livers at day 23 from one of two experiments (mean values; PBS + IgG, n = 4 mice; cis + PBS + anti-PD-1, n = 6; cis + DCP-IL-12/FLT3L + anti-PD-1, n = 5). h,i, Frequency of the indicated cell types in KrasG12D; Trp53–/– livers at day 23 (mean ± s.e.m.; n values as in g). Statistical analysis by one-way ANOVA with Turkey’s multiple comparisons test (h) or two-way ANOVA with Turkey’s multiple comparisons test (i). j,k, IFNγ expression by ex vivo re-stimulated T cells from KrasG12D; Trp53–/– livers at day 23 (mean ± s.e.m.; n values as in g). Statistical analysis one-way ANOVA with Turkey’s multiple comparisons test. Representative CD8+ T cells are shown in j. l, Frequency of the indicated cell types in KrasG12D; Trp53–/– liver-draining lymph nodes (ldLNs) and spleens at day 23 (mean ± s.e.m.; n values as in g, except for PBS + IgG in ldLNs where n = 3 mice). Statistical analysis one-way ANOVA with Turkey’s multiple comparisons test. m, Induction and treatment of Myc; Trp53–/– liver tumors. Mice were monitored for up to 90 days. n, Survival of Myc; Trp53–/– tumor-bearing mice (PBS + IgG, n = 6 mice, 44 days; PBS + anti-PD-1, n = 6, 49.5 days; cis + PBS + anti-PD-1, n = 5, undefined; cis + DCP-IL-12/FLT3L + anti-PD-1, n = 6, undefined). Statistical analysis not applicable. Each data point represents one sample from an independent mouse. Source data
Fig. 7
Fig. 7. Cytokine-armed DCPs synergize with CAR-T cells to eradicate mouse gliomas.
a, Procedure to study the combination of DCP-IL-12/FLT3L and CAR-T cells for the treatment of the SB28-GD2 glioma model. Mice received cytokine-armed DCPs both intracranially (i.c.) and intravenously (i.v.), and CAR-T cells intracranially. b, Survival analysis (PBS, n = 6 mice; DCP-IL-12/FLT3L, n = 6; CAR-T, n = 6; DCP-IL-12/FLT3L + CAR-T, n = 5). Mice were monitored for up to 71 days. Statistical analysis by log-rank Mantel–Cox test. c, Growth of individual tumors assessed by in vivo fluorescence imaging (IVIS) (n values as in b). The gray box indicates background radiance signal. d, Tumor burden quantified by IVIS imaging (mean radiance ± s.e.m.; n values as in b) shown until day 20, a time point when all the mice were still alive. The graph on the right shows the CAR-T and DCP-IL-12/FLT3L + CAR-T treatment groups separately. Statistical analysis by two-way ANOVA with Tukey’s (left) or Sidak’s (right) multiple comparison test. e, Survival analysis (PBS, n = 7 mice; DCP-IL-12/FLT3L, n = 6; CAR-T, n = 8; DCP-IL-12/FLT3L + CAR-T, n = 8). One mouse in the DCP-IL-12/FLT3L + CAR-T cohort was terminated while being tumor-free according to IVIS and post-mortem analysis. Mice were monitored for up to 52 days. Statistical analysis by log-rank Mantel–Cox test. f, IVIS imaging data of three representative mice from e per treatment condition (n values as in e). g, Growth of individual tumors assessed by IVIS imaging (n values as in e). The gray box indicates background radiance signal. Each data point in c and g represents one tumor measurement; each data point in d represents the mean volume of independent tumors. Source data
Fig. 8
Fig. 8. Human HSPCs are a source of DCPs with antigen-presentation capacity.
a, Procedure to generate human DCPs from cord blood or MPB CD34+ cells. b, Representative flow cytometry histograms of CD117, CD135 and CD45RA expression of day zero cord-blood CD34+ cells and day seven DCPs (LinCD34+CD115+). Day seven cells were used as fluorescence minus one (FMO) staining control. c, Percentage of DCPs in total CD3CD19 live cells at days 0 and 7 after expansion (cord blood, n = 7 independent donors; MPB, n = 5). Statistical analysis by paired, two-tailed Student’s t-test. d, Number of DCPs at day 7 per input cell at day 0 (mean ± s.e.m.; cord blood, n = 7 independent donors; MPB, n = 5). e, Representative flow cytometry dot plots of NGFR expression of untransduced (UT) or LV-transduced (dLNGFR) DCPs, analyzed at day 7. f, Percentage of APCs (containing CD14+ monocytes, CD14CD141+CLEC9A+ cDC1s, CD14CD141CLEC9ACD1c+ cDC2s and CD14CD141+CLEC9A immature DCs) after 7-day differentiation of sorted DCPs or mock-sorted cells. The data show one representative donor and three technical replicates (data points). Additional experiments with three independent donors are shown as Source Data Fig. 8. g, Direct antigen presentation by DCPs. The data show the percentage of IFNγ+TNF+ cells within A2/CMV/pp65495-504-specific CD8+ T cells after co-culture with CMV/pp65495-504 peptide-loaded HLA-A2+ cord-blood-derived DCP progeny (DCP-Prog.) or monocyte-derived HLA-A2+ DCs (moDCs). The data show one representative donor and three technical replicates (data points). Additional experiments with three independent donors are shown as Source Data Fig. 8. h, Antigen cross-presentation by DCPs. The data show the percentage of IFNγ+TNF+ cells within CD8+ A2/CMV/pp65495-504-specific CD8+ T cells after co-culture with CMV/pp65 protein-loaded HLA-A2+ cord-blood-derived DCP progeny or moDCs. The data show one representative donor and two technical replicates (data points). i, Antigen cross-dressing by DCPs. The data show the percentage of IFNγ+ cells within A2/CMV/pp65495-504-specific CD8+ T cells after co-culture with HLA-A2 MPB-derived DCP progeny or moDCs, which were previously exposed to CMV/pp65495-504 peptide-pulsed melanoma extracellular vesicles (EVs). The data show two independent donors with two (donor 1) or three (donor 2) technical replicates (data points). Source data
Extended Data Fig. 1
Extended Data Fig. 1. DCPs efficiently generate cDCs in recipient mice.
a, Left: Phenotype of DCPs before enrichment of lineage-negative cells. Right: Proportion of DCPs before and after enrichment (paired samples) in several independent experiments (n = 6). b, Flow cytometry analysis of enriched DCPs from a representative experiment (gated on live cells). c, Flow cytometry dot plots showing the phenotype of cDC1-like cells, moDCs, and enriched DCPs, in one representative experiment. d, Flow cytometry dot plots showing the phenotype of enriched DCPs from representative wild-type (WT; top panels) or Batf3–/– (bottom panels) mice. e, Left: Engraftment of CD45.2+ cells derived from WT or Batf3–/– DCPs in the spleen of representative CD45.1 recipient mice. Right: Quantification of donor-derived cells in the spleen of recipient mice (mean ± SEM; n = 2 mice for PBS and n = 5 for WT and Batf3–/– DCPs). Statistical analysis by one-way ANOVA with Tukey’s multiple comparison test. Each data point represents one sample from an independent cell culture or mouse. Source data
Extended Data Fig. 2
Extended Data Fig. 2. DCPs efficiently generate cDCs in distinct organs of recipient mice.
a, Engraftment of CD45.1+ cells derived from DCPs, moDCs and cDC1-like cells (mean ± SEM; n = 5 mice for PBS and n = 8 for DCPs, moDCs and cDC1-like cells) in spleen (shown as relative frequency, left, and absolute cell counts, right), BM (mean ± SEM; n = 8 mice), lung (mean ± SEM; n = 5 mice for PBS and n = 8 for DCPs, moDCs and cDC1-like cells) and liver (mean ± SEM; n = 5 mice for PBS, n = 6 for moDCs and cDC1-like cells, and n = 8 for DCPs) of MC38 tumor-bearing mice, 4 days after the last cell dose. Statistical analysis by one-way ANOVA with Tukey’s multiple comparison test. b, Donor cell chimerism in cDC1 and cDC2 of MC38 tumors after DCP transfer in an independent experiment (mean ± SEM; n = 7 mice). c, Donor cell chimerism in cDC1, cDC2, cDCs, macrophages, or Kupffer cells of spleen (mean ± SEM; n = 5 mice for PBS and n = 8 for DCPs, moDCs and cDC1-like cells), lung (mean ± SEM; n = 5 mice for PBS and n = 8 for DCPs, moDCs and cDC1-like cells) and liver (mean ± SEM; n = 5 mice for PBS, n = 6 for moDCs and cDC1-like cells, and n = 8 for DCPs). Note that liver-derived cells display some autofluorescence, which gives background signal in the CD45.1 channel. Statistical analysis by one-way ANOVA with Tukey’s multiple comparison test. Each data point represents one sample from an independent mouse. Source data
Extended Data Fig. 3
Extended Data Fig. 3. IL-12 and FLT3L promote differentiation of DCPs into cDC1 with enhanced co-stimulatory capacity.
a, Differentiation of DCPs in cDC1 medium (containing FLT3L/GM-CSF) supplemented with the indicated cytokines, analyzed at day 15. Data show representative flow cytometry dot plots of DCPs stimulated with IL-18 or IL-12. b, Differentiation of DCPs into cDC1 in cDC1 medium (FLT3L/GM-CSF) supplemented with the indicated cytokines, shown as cDC1 yield relative to untreated. One sample per condition is shown. c, Activation, measured by intracellular IFNγ staining, of OT-I or OT-II cells in co-culture with cDC1-like cells pre-loaded with recombinant OVA protein (mean ± SEM; n = 3 independent cell cultures). Statistical analysis by one-way ANOVA with Tukey’s multiple comparison test. Each dot represents one independent cell culture. Source data
Extended Data Fig. 4
Extended Data Fig. 4. IL-12/FLT3L-expressing DCPs repopulate the cDC compartment of mice.
a, Expression of GFP in LV-transduced DCPs analyzed 6 days post-transduction. b, Schematic of the experimental procedure to study adoptively transferred DCPs in B16F10 tumor-bearing mice. DCPs only express GFP; DCP-FLT3L co-express FLT3L and GFP. c, Frequency of the indicated cell types in tumor and spleen of mice that received DCPs (mean ± SEM; n = 9 mice). Statistical analysis by two-tailed Mann-Whitney test, performed independently on each cell type. d, Frequency of CD8+ and CD4+ cells with CD44+CD62 T effector cell phenotype in spleen (mean ± SEM; n = 9 mice). Statistical analysis by two-tailed Mann-Whitney test. e, Expression of GFP in LV-transduced DCPs analyzed 6 days post-transduction. f, Schematic of the experimental procedure to study the fate of untransduced DCPs, DCPs only expressing GFP (DCP) and DCPs co-expressing IL-12 and GFP (DCP-IL-12) in tumor-free mice. A single dose of 2 × 106 CD45.1+ DCPs was infused in CD45.2+ mice, and splenocytes were analyzed 4 days later. g, Number of CD45.1+ donor-derived cells in the spleen (untransduced DCP, n = 4 mice; DCP, n = 5; DCP-IL12, n = 5) of tumor-free mice. h, Left: Representative flow cytometry dot plots showing the frequency of transduced (GFP+) donor-derived cells in the spleen of tumor-free mice. One representative mouse per condition is shown. Right: Frequency of transduced (GFP+) donor-derived cells in the spleen (mean ± SEM; untransduced DCP, n = 4 mice; DCP, n = 5; DCP-IL12, n = 5). i, Top: Pie charts showing the fate of DCP-derived CD45.1+ cells in the spleen of tumor-free mice (mean values; untransduced DCP, n = 4 mice; DCP, n = 5; DCP-IL12, n = 5). Bottom: Quantification of the data showing the relative frequency (mean ± SEM) of cDC1 and cDC2 among CD45.1+ donor-derived cells. Each data point represents one sample from an independent mouse. Source data
Extended Data Fig. 5
Extended Data Fig. 5. Cytokine-armed DCPs activate immunity and inhibit melanoma growth.
a, Schematic of the experimental procedure to study adoptive transfer of cytokine-armed DCPs in B16F10 tumor-bearing mice (longer follow-up study). b, Tumor growth in mice with longer follow-up. Data show tumor volume (mean ± SEM; PBS, n = 5 mice; other groups, n = 6). Statistical analysis by two-way ANOVA with Tukey’s multiple comparison test. Note that the PBS and DCP-IL-12/FLT3L group datasets are also shown in Fig. 4J, as the two studies were conducted in parallel. c-e, Frequency of the indicated cell types in B16F10 tumors and tdLNs (mean ± SEM; n = 10 mice) analyzed at day 15 from the experiment shown in Fig. 2A, B. Statistical analysis by one-way ANOVA with Tukey’s multiple comparison test. f-g, scRNA-Seq of B16F10 tumors. The overrepresentation analysis of the Hallmark database shows the most deregulated pathways in cancer cells (identified by Tyrp1 expression) and myeloid cells (identified by Cd68 expression) upon DCP-IL-12/FLT3L treatment, identified by unsupervised ranking according to Hallmark. Statistical analysis by one-tailed Fisher’s exact test followed by Benjamini-Hochberg p-value correction. Pathways in blue are significant by adjusted p value. h, Ifng expression in different cell clusters. Each data point represents one sample from an independent mouse, except for (b) in which each point represents the mean volume of independent tumors. Source data
Extended Data Fig. 6
Extended Data Fig. 6. DCPs offer an effective cytokine-delivery platform alternative to moDCs.
a–d, Frequency of the indicated cell types in B16F10 tdLNs and tumors of mice treated with cytokine-armed DCPs or moDCs (mean ± SEM; PBS, n = 7 mice; DCP-IL-12/FLT3L, n = 7; moDC-IL-12/FLT3L, n = 7-8). Statistical analysis by one-way ANOVA with Tukey’s multiple comparison test (black p values) or two-tailed Mann-Whitney test (red p values). e, Schematic of the bicistronic LV construct used to co-express IL-12 and FLT3L. f, Growth of individual B16F10 tumors in mice (PBS, n = 8 mice; DCP-IL-12/FLT3L (1 × 106), n = 7; moDC-IL-12/FLT3L (1 × 106), n = 6; moDC-IL-12/FLT3L (2 × 106), n = 7). g, MC38 tumor growth in mice. Data show tumor volume (mean ± SEM; n = 8 mice). Statistical analysis by two-way ANOVA with Tukey’s multiple comparison test (not significant). h-i, Frequency of the indicated cell types in MC38 tumors (mean ± SEM; PBS, n = 8 mice in (h) and n = 7 in (i); DCP-IL-12, n = 7; DCP-FLT3L, n = 8 in (h) and n = 7 in (i)). Statistical analysis by one-way ANOVA with Tukey’s multiple comparison test. Each data point represents one sample or tumor measurement from an independent mouse, except for (g) in which each point represents the mean volume of independent tumors. Source data
Extended Data Fig. 7
Extended Data Fig. 7. Tumor response to cytokine-armed DCPs is cDC1 and IFNγ-dependent but does not require CD8+ T cells.
a, B16F10 tumor growth (early time point of analysis; mean volume ± SEM; n = 6 mice). b-c, Frequency of the indicated cell types in tumors at day 11 (mean ± SEM; n = 6 mice). Statistical analysis by one-way ANOVA with Tukey’s multiple comparison test. d, Left: flow cytometry analysis of migratory and resident cDCs in the tdLN of one representative mouse. Right: Quantification of migratory and resident cDCs (mean ± SEM; PBS, n = 5 mice; DCP, n = 6; DCP-FLT3L, n = 6; DCP-IL-12, n = 5; DCP-IL-12/FLT3L, n = 5). Statistical analysis by one-way ANOVA with Tukey’s multiple comparison test. e, Frequency of CD4+ T effector cells in tdLN at day 11 (mean ± SEM; PBS, n = 5 mice; DCP, n = 6; DCP-FLT3L, n = 6; DCP-IL-12, n = 5; DCP-IL-12/FLT3L, n = 5). Statistical analysis by one-way ANOVA with Tukey’s multiple comparison test. f, B16F10 tumor growth (mean volume ± SEM; PBS, n = 5 mice; DCP-IL-12/FLT3L, n = 6) in wild-type mice. Statistical analysis by two-way ANOVA with Sidak’s multiple comparison test. g, Frequency of CD8+ T cells in tumors (mean ± SEM; PBS, n = 5 mice; DCP-IL-12/FLT3L, n = 6). Statistical analysis by two-tailed Mann-Whitney test. h, IFNγ and GZMB expression by ex vivo re-stimulated T cells (mean ± SEM; PBS, n = 5 mice; DCP-IL-12/FLT3L, n = 6). Statistical analysis by two-tailed Mann-Whitney test. i, Frequency of activated NK cells in tumors of Rag1–/– mice (mean ± SEM; n = 6 mice) and wild-type mice (PBS, n = 5 mice; DCP-IL-12/FLT3L, n = 6). Statistical analysis by one-way ANOVA with Tukey’s multiple comparison test. j, Pie charts showing the cell composition of B16F10 tumors (mean values; n = 6 mice for all groups, except for n = 5 in PBS). k, Frequency of cDCs in tdLN and tumors (mean ± SEM; PBS, n = 5 mice; DCP-IL-12/FLT3L, n = 6; DCP-IL-12/FLT3L + anti-CSF1R, n = 5). Statistical analysis by one-way ANOVA with Tukey’s multiple comparison test. l, Experimental procedure to study cell depletion in B16F10 tumor-bearing mice. m, B16F10 tumor growth (mean volume ± SEM; PBS, n = 8 mice; DCP-IL-12/FLT3L, n = 7; DCP-IL-12/FLT3L + aCD4, n = 8; DCP-IL-12/FLT3L + aNK1.1, n = 6). Statistical analysis by two-way ANOVA with Tukey’s multiple comparison test. The PBS and DCP-IL12/FLT3L datasets are also shown in Fig. 3G, as the two studies were conducted in parallel. n, Frequency of the indicated cell types in tumors at day 17 (mean ± SEM; DCP-IL-12/FLT3L, n = 6 mice; DCP-IL-12/FLT3L + aCD4, n = 7 (left) or 8 (right); DCP-IL-12/FLT3L + aNK1.1, n = 6). Statistical analysis by one-way ANOVA with Tukey’s multiple comparison test. o, IFNγ and GZMB expression by ex vivo re-stimulated CD8+ T cells isolated from tumors (mean ± SEM; DCP-IL-12/FLT3L, n = 6 mice; DCP-IL-12/FLT3L + aCD4, n = 7; DCP-IL-12/FLT3L + aNK1.1, n = 6). Statistical analysis by one-way ANOVA with Tukey’s multiple comparison test. Each data point represents one sample from an independent mouse, except for (a), (f), and (m) in which each point represents the mean volume of independent tumors. Source data
Extended Data Fig. 8
Extended Data Fig. 8. Cytokine-armed DCPs improve the efficacy of cisplatin/anti-PD-1 in a colorectal cancer model.
a, Flow cytometry analysis of B2M (indicative of MHCI expression) in the indicated B16F10 cells, treated as indicated. Note that Ifngr1 KO B16F10 fail to upregulate B2M in response to IFNγ. b, Frequency of the indicated cell types in MC38 tumors (mean ± SEM; PBS + IgG, n = 5 mice; cis + PBS + ɑPD-1, n = 6; cis + DCP-IL-12/FLT3L + IgG, n = 7; cis + DCP-IL-12/FLT3L + ɑPD-1, n = 8). Statistical analysis by one-way ANOVA with Tukey’s multiple comparison test (the analysis excludes tumors in the PBS + IgG, which were processed independently). c, IFNγ expression by ex vivo re-stimulated T cells from the tumors treated as indicated (mean ± SEM; PBS + IgG, n = 5 mice; cis + PBS + ɑPD-1, n = 6; cis + DCP-IL-12/FLT3L + IgG, n = 7; cis + DCP-IL-12/FLT3L + ɑPD-1, n = 8). Statistical analysis by one-way ANOVA with Tukey’s multiple comparison test (black p values) or two-tailed Mann-Whitney test (red p values). d, V gene usage profile. Data were extracted from bulk TCR-Seq of tumor samples (PBS + IgG, n = 3 mice; cis + PBS + ɑPD-1, n = 5; cis + DCP-IL-12/FLT3L + IgG, n = 7; cis + DCP-IL-12/FLT3L + ɑPD-1, n = 7). Box plots show median (central bar), numerical data through their 3rd and 1st quartiles (box), and maximum and minimun values (whiskers). All tumors from mice that received DCP-IL-12/FLT3L were combined and compared with tumors from mice that did not receive DCP-IL-12/FLT3L. Statistical analysis by multiple Wilcoxon rank sum test corrected with the Holm-Sidak method. Each data point represents one sample from an independent mouse. Source data
Extended Data Fig. 9
Extended Data Fig. 9. Cytokine-armed DCPs are effective in two genetically engineered liver cancer models.
a, Left: representative images of CD8 (red) or CD4 (yellow) immunostaining, and DAPI nuclear staining (blue), of livers of KrasG12D/Tp53–/– tumor-bearing mice treated as indicated and analyzed at day 23. Scale bar, 100 μm. Right: quantification of the data (mean ± SEM; PBS + IgG, n = 5 mice; PBS + aPD1, n = 5; Cis + PBS + aPD1, n = 7; Cis + DCP–IL-12/FLT3L + aPD1, n = 8). Statistical analysis by one-way ANOVA with Tukey’s multiple comparisons test. b, Number of liver nodules in cMyc/Tp53–/– tumor-bearing mice treated as indicated and analyzed at day 21 (mean ± SEM; n = 6 mice). Statistical analysis one-way ANOVA with Tukey’s multiple comparisons test. c, d, Frequency of the indicated cell types in livers or liver-draining lymph nodes (ldLNs) of in cMyc/Tp53–/– tumor-bearing mice treated as indicated and analyzed at day 21 (mean ± SEM; n = 6 mice). Statistical analysis one-way ANOVA with Turkey’s multiple comparisons test (c) and two-way ANOVA with Sidak’s multiple comparisons test (d). Each data point represents one sample from an independent mouse. Source data
Extended Data Fig. 10
Extended Data Fig. 10. Cytokine-armed DCPs synergize with CAR-T cells to eradicate mouse gliomas and can be generated from human HSPCs.
a, Expression of GD2 by S28-GD2 cancer cells. b, Antigen-specific cytotoxic activity by CAR-T cells. Engineered anti-GD2 CAR-T cells were cocultured with unmodified SB28 or SB-28-GD2+ cells at the indicated cell ratios. Unmodified T cells were used as control. Data show 3 technical replicates per condition. c, Tumor burden assessed by IVIS imaging (mean radiance ± SEM; PBS, n = 7 mice; DCP-IL-12/FLT3L, n = 6; CAR-T, n = 8; DCP-IL-12/FLT3L + CAR-T, n = 8) shown until day 22, a time point when all but one mouse were still alive (note that one mouse in the CAR-T group was terminated on day 18, so the data on day 22 show 7 of 8 tumors in the CAR-T group). Statistical analysis by two-way ANOVA with Tukey’s (left) or Sidak’s (right) multiple comparison test. d, representative images of GFP (green, marking SB28 glioma cells) or CD3 (red) immunostaining, and DAPI nuclear staining (blue), of brain sections from two representative mice treated as indicated. Scale bar: 1 mm. e, Number of cells after CB CD34+ cell expansion, analyzed at day 4 or 7 (fold-change relative to day 0). The data show one representative donor of two, and two technical replicates (data points). f, Schematic view of human DC hematopoiesis. g, Percentage of the indicated cell types in total live CB-derived cells analyzed at day 0, 4 and 7. The data show one representative donor and two technical replicates (data points). h, Representative flow cytometry histograms of CD86 and HLA-DR expression in moDCs and MPB-derived DCP progeny (DCP-Prog.) assessed on day 14. Each data point represents one sample from an independent mouse, except for (b), (g), and (h) in which each point represents the mean volume of independent tumors. Common myeloid progenitor (CMP); Granulocyte, monocyte and DC progenitor (GMDP); Monocyte and DC progenitor (MDP); Common-dendritic cell progenitor (CDP); cDC precursor (Pre-DC); Conventional DC (cDC). Source data

References

    1. Spranger S, Dai D, Horton B, Gajewski TF. Tumor-residing Batf3 dendritic cells are required for effector T cell trafficking and adoptive T cell therapy. Cancer Cell. 2017;31:711–723.e4. doi: 10.1016/j.ccell.2017.04.003. - DOI - PMC - PubMed
    1. Zagorulya M, Spranger S. Once upon a prime: DCs shape cancer immunity. Trends Cancer. 2023;9:172–184. doi: 10.1016/j.trecan.2022.10.006. - DOI - PMC - PubMed
    1. Perez CR, De Palma M. Engineering dendritic cell vaccines to improve cancer immunotherapy. Nat. Commun. 2019;10:5408. doi: 10.1038/s41467-019-13368-y. - DOI - PMC - PubMed
    1. Cabeza-Cabrerizo M, Cardoso A, Minutti CM, Pereira da Costa M, Reis e Sousa C. Dendritic cells revisited. Annu. Rev. Immunol. 2021;39:131–166. doi: 10.1146/annurev-immunol-061020-053707. - DOI - PubMed
    1. Gerhard GM, Bill R, Messemaker M, Klein AM, Pittet MJ. Tumor-infiltrating dendritic cell states are conserved across solid human cancers. J. Exp. Med. 2021;218:e20200264. doi: 10.1084/jem.20200264. - DOI - PMC - PubMed

Publication types