. 2023 Dec;26(12):2192-2202.
doi: 10.1038/s41593-023-01481-7. Epub 2023 Nov 23.

A dynamic sequence of visual processing initiated by gaze shifts

Affiliations

A dynamic sequence of visual processing initiated by gaze shifts

Philip R L Parker et al. Nat Neurosci. 2023 Dec.

Abstract

Animals move their head and eyes as they explore the visual scene. Neural correlates of these movements have been found in rodent primary visual cortex (V1), but their sources and computational roles are unclear. We addressed this by combining head and eye movement measurements with neural recordings in freely moving mice. V1 neurons responded primarily to gaze shifts, where head movements are accompanied by saccadic eye movements, rather than to head movements where compensatory eye movements stabilize gaze. A variety of activity patterns followed gaze shifts and together these formed a temporal sequence that was absent in darkness. Gaze-shift responses resembled those evoked by sequentially flashed stimuli, suggesting a large component corresponds to onset of new visual input. Notably, neurons responded in a sequence that matches their spatial frequency bias, consistent with coarse-to-fine processing. Recordings in freely gazing marmosets revealed a similar sequence following saccades, also aligned to spatial frequency preference. Our results demonstrate that active vision in both mice and marmosets consists of a dynamic temporal sequence of neural activity associated with visual sampling.


Conflict of interest statement

COMPETING INTERESTS STATEMENT

The authors declare no competing interests.

Figures

Extended Data Figure 1.
Extended Data Figure 1.. Characterization of free movement.
a. Mean head pitch and roll during free motion for one example recording. Pitch mean = −15.1 ± 0.02 deg; Roll mean = 9.2 ± 0.01 deg. b. Mean head pitch and roll, indicating the center point during free movement. Each point is a mouse (n=9 mice). Black bars indicate mean and standard error (pitch: −20.8 ± 3.1 deg; roll: 4.5 ± 3.3 deg). Recording from a shown in orange. c. Rate of gaze-shifting (left; run median = 106 ± 6 saccades/min; still median = 50 ± 3 saccades/min) and compensatory (right; run median = 362 ± 11 saccades/min; still median = 229 ± 15 saccades/min) movements during periods of locomotion greater than 2 cm/s measured from the top camera (“run”) compared to periods of slower locomotion, fine motion, and/or stationary periods less than 2 cm/s (“still”). Each point is a mouse (n=9 mice). Black bars indicate median and standard error. d. Amplitude of position change for eye (left), head (middle) and gaze (right; defined as eye + head) during gaze-shifting and compensatory eye/head movements at the onset of the movement for the example recording used in a. e. Scatter plot of eye and head velocities subsampled (25x) from the example recording used in a, showing compensatory, gaze-shifting, and intermediate movements, the latter of which are excluded from the analysis in the main text. f. Amplitude of gaze changes at onset of movement for the example recording used in a. g. Median ± SEM amplitude of gaze change for all recordings. Each recording is a point (n=9 mice). Recording in f is shown in orange. Compensatory: 0.73 ± 0.02 deg; intermediate: 2.63 ± 0.01 deg; gaze-shifting: 8.76 ± 0.29 deg. h. PETHs for example cells from Figure 1g including PETH for responses to intermediate saccades in black. i. Normalized PETHs of gaze-shifting (left), intermediate (middle), and compensatory (right) eye/head movements for 100 example units with a baseline firing rate >2Hz, with median of all cells (n=716) overlaid.
Extended Data Figure 2.
Extended Data Figure 2.. Additional characterization of gaze shift response types.
a. PCA of gaze shift PETHs. Only the two PCs with the highest explained variance are shown. Cells in the scatter plot are colored by the cluster they were assigned by k-means clustering of PCs. b. Fraction of units in each gaze shift response cluster. c. Latency of peak responses were significantly different for all comparisons between clusters (p<0.05 with no effect of experimental session p=0.220, linear mixed effects model; early vs. late p= 7.10e-42, early vs. biphasic p= 3.86e-116, early vs. negative p= 3.83e-162, late vs. biphasic p= 2.32e-25, late vs. negative p= 2.30e-65, biphasic vs. negative p= 6.67e-22). d. Fraction of putative cell types in each gaze shift response cluster. Excitatory and inhibitory groups were identified by k-means clustering on spike waveforms (waveforms shown above). e. Median ± SEM baseline firing rate of units during freely moving (left) and head-fixed (right) recordings (n=9 mice, n=716 cells). Freely moving baseline was calculated as the pre-saccadic period before gaze shifts. Head-fixed baseline was calculated as the firing rate during presentation of gray screen during head-fixation. f. Scatter plot of head-fixed and freely moving baseline firing rates. Each point is a cell. Linear regression shown as dashed black line. (early: r=0.87, p=1.01e-26, m=1.94; late: r=0.70, p=7.06e21, m=1.33; biphasic: r=0.70, p=3.01e-26, m=1.01; negative: r=0.69, p=1.45e-10, m=0.97). g. Gaze shift left/right direction selectivity index by cluster. h. Laminar depth of all cells determined using the local field potential from multi-unit activity power along each shank of the probe. Black outline shows the distribution of depths for all cells. Dashed line (0 μm) is the estimated depth of cortical layer 5, to which depths were aligned. i. Normalized horizontal angular velocity tuning for all cells, separated by response clusters. Positive values for angular velocity represent each unit’s preferred horizontal direction of gaze shift. j. PETH for compensatory eye/head movements for cells responsive to compensatory movements (n=48/716). Only the preferred direction is shown. Responsiveness defined as 10% modulation and modulation by at least 1 sp/s. k. Percent of each gaze shift response cluster that is responsive to compensatory movements (total=48/716, early=4/82, late=5/135, biphasic=17/170, negative=15/66, unresponsive=7/263) l. Same as j grouped by gaze shift response cluster.
Extended Data Figure 3.
Extended Data Figure 3.. Cross validation of response latencies.
a. Cross-validation for mouse gaze shift PETHs of all responsive cells. Gaze shift times were randomly divided into two sets used to calculate PETHs in the train (left) and test (right) sets. The test set was sorted by the latency of the positive peak in the train set. b. Latency of gaze shift response for train versus test sets (r=0.870, p=2.51e-140). c. Same as a for marmoset saccades. d. Same as b for marmoset saccades (r=0.875, p=1.44e-106).
Extended Data Figure 4.
Extended Data Figure 4.. Additional characterization of responses in the dark.
a. Fraction of cells responsive in the dark condition (responsive=9/269, unresponsive=260/269). b. Dark condition PETHs for cells that responded to gaze shifts in freely moving dark conditions. Units are colored by clustering from responses in light condition. n=9/269 (early=5, late=1, biphasic=0, negative=1, unresponsive=2). c. Same as a for the light condition (responsive=191/269, unresponsive=78/269). d. Responses of units in b for the light condition.
Extended Data Figure 5.
Extended Data Figure 5.. Additional characterization of drifting gratings responses.
a. Head-fixed drifting gratings PETHs for gaze shift response clusters with mean response overlayed. Stimulus is presented for 1 s with gray ISI between stimuli. n=9 mice, n=384/716 cells responsive to gratings (early=71, late=96, biphasic=98, negative=29, unresponsive=90). Cells below firing rate threshold are not shown. b. Mean normalized gratings PETHs clustered by gaze shift response for full stimulus presentation (top) and highlighting stimulus onset (bottom). c. Fraction of cells in each cluster with a ≥2:1 preference for the presented spatial frequencies compared to the sum of responses for the two other spatial frequencies. d. Mean temporal frequency tuning curve by cluster (Multivariate two-way ANOVA, TF x cluster F=21.45, p=3.45e-13). e. Temporal frequency preference for gratings-responsive cells in each gaze shift response cluster, calculated as a weighted mean of responses (n=9 mice, 384 cells). Median and standard error are shown for each cluster. Bars above indicate statistical significance at p<0.05 (linear mixed effects model, n=9 mice, n=384 cells; early vs. late p=3.64e-7, early vs. biphasic p=2.24e-21, early vs. negative p= 4.42e-9, late vs. biphasic p= 2.32e-6, late vs. negative p=5.69e-2, biphasic vs. negative p=9.37e-2). f. Weighted temporal frequency preference versus gaze shift response latency, for all cells responsive to gratings. Running median for all cells is overlaid. The color of each point indicates the cluster from gaze shift responses. (r=−0.468, p=2.12e-16). g. Same as c for temporal frequency.
Extended Data Figure 6.
Extended Data Figure 6.. Temporal tuning of neurons can explain diverse responses to gaze shifts.
a. Responses to flashed sparse noise stimulus presented with an inter-stimulus interval (ISI; n=3 mice; early=71, late=33, biphasic=9, negative=7). b. Same as a for a continuously flashed sparse noise stimulus. c. Schematic of modeling approach. A scalar stimulus, presented continuously or with an inter-stimulus interval (ISI), is passed through a variable temporal kernel of either high, intermediate, or low temporal frequency (TF), and a nonlinearity is used to generate a spiking output. d. High TF kernel. e. Intermediate TF kernel. f. Low TF kernel. g. Resulting response of model using high TF kernel to visual stimuli presented with an ISI. h. Same as g for intermediate TF kernel. i. Same as g for low TF kernel. j. Resulting response of model using high TF kernel to visual stimuli presented continuously. k. Same as j for intermediate TF kernel. l. Same as j for low TF kernel.
Extended Data Figure 7.
Extended Data Figure 7.. Additional characterization of marmoset saccade response types.
a. PCA of marmoset gaze shift PETHs for the 2 PCs with highest explained variance, colored by k-means clusters. b. Fraction of units in each saccade response cluster. c. Median ± SEM baseline firing rate of units in each cluster (n=2 marmosets, n=238 cells). d. Fraction of cells with maximal response to each presented spatial frequency.
Figure 1.
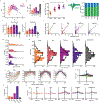
Figure 1.. V1 neurons preferentially respond to gaze-shifting eye/head movements.
a. Schematic of the head-mounted recording system. b. Experimental paradigm, in which a mouse freely moves through a visually complex environment. c. Schematic of gaze-shifting and compensatory eye/head movements, in which the eyes either move with or against the movement of the head. Note that the arrows are not to scale, and that eye vs. head movement amplitudes are not always equal in either condition. d. Mice change their horizontal eye position (top) to compensate for changing horizontal head position (middle), punctuated by rapid gaze-shifting eye movements. The resulting gaze position (bottom), the sum of horizontal eye and head positions, shows a “saccade-and-fixate” pattern. e. Scatter plot of eye and head velocities subsampled (25x) from an example 64 min recording, showing segregation of compensatory versus gaze-shifting eye movements. f. Mean ± SEM position of the animal’s gaze around gaze-shifting (red) and compensatory (blue) movements in the leftward head direction across all recordings. g. Response of three example cells to 500 randomly sampled gaze-shifting (top) or compensatory (middle) eye/head movements as a spike raster. Bottom: gaze-shifting and compensatory PETH. h. Normalized PETH of gaze-shifting (top) and compensatory (bottom) eye/head movements for 100 example units with a baseline firing rate >2Hz, with median of all cells (n=716) overlaid.
Figure 2.
Figure 2.. Diversity and temporal sequence of gaze shift responses.
a. Normalized PETHs for preferred direction of gaze shifts in responsive units, grouped by k-means clustering, with each cluster’s mean overlaid. n=9 mice, 716 units (early=82, late=135, biphasic=170, negative=66, unresponsive=263). b. Mean normalized PETH in response to gaze-shifting eye/head movements, clustered by response type. c. Same as b for compensatory movements with cells clustered on their gaze shift response. d. Example spike rasters from a 3 s period of freely moving activity, showing all units responsive to gaze shifts (n=98/128), color coded by response type cluster. Gaze shift onsets are indicated by black arrows above. e. Normalized PETH for gaze-shifting movements in the preferred (left) and nonpreferred (middle) directions, and for compensatory movements (right). All responsive cells are shown, sorted along the y-axis by response latency. Vertical colorbar to the side of the left panel shows each cell’s assigned cluster using the colors in a.
Figure 3.
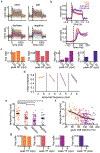
Figure 3.. Temporal dynamics of gaze shift responses depend on visual input.
a. Normalized PETHs in light condition for the preferred direction of gaze shifts, clustered using k-means weights used for cells in Figure 2. n=7 mice, 269 units (early=27, late=56, biphasic=66, negative=42, unresponsive=78). b. Same as a for dark condition. Cells are grouped by their cluster from a. c. Mean gaze shift responses of each cluster in light (left) and dark (right) conditions with standard error. d. Same as c for compensatory movements. e. Temporal sequence of responses to gaze shifts and compensatory movements in the light and dark. All temporal sequences are sorted by the cell’s gaze shift response latency for the light condition (left).
Figure 4.
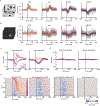
Figure 4.. Head-fixed flashed stimulus responses resemble freely moving gaze shift responses.
a. Three example cells with positive (left), biphasic (middle), and negative (right) responses to freely moving gaze shifts. Spike rasters at the time of 250 randomly sampled gaze shifts during free movement (top) and 250 full-field reversals of a black and white checkerboard during a head-fixed recording of the same cell (middle). Bottom: gaze shift (red) and checkerboard (black) PETHs for each cell. b. Schematic of head-fixed flashed checkerboard and sparse noise stimuli. c. Mean ± SEM normalized response of cells to head-fixed flashed checkerboard, clustered on their responses to freely moving gaze shifts. n=9 mice, 716 cells (checkerboard responsive=472/716, early=67, late=100, biphasic=123, negative=55, gaze shift unresponsive=127). d. Same as c for sparse noise stimulus (sparse noise responsive=333/716, early=51, late=69, biphasic=99, negative=44, gaze shift unresponsive=70). e. Pearson correlation coefficient between gaze shift PETH and flashed checkerboard (median=0.64, n=345; arrows indicate correlation for example cells 1 (blue, 0.99), 2 (orange, 0.83), and 3 (green, 0.73) in a. f. Same as e for flashed sparse noise stimulus. (median=0.68, n=263). g. Temporal sequence of gaze shift responses (left, cells responsive to gaze shifts and either flashed head-fixed stimulus, n=366), checkerboard (middle, cells responsive to both gaze shift and checkerboard, n=345) and sparse noise (right, cells responsive to both gaze shift and sparse noise, n=263) sorted on the latency of gaze shift responses in freely moving conditions. h. Latency of positive peak in gaze-shifting responses versus head-fixed stimulus responses for checkerboard (Pearson correlation coefficient, r=0.487, p=5.89e-22, slope=0.55, intercept=0.041). i. Same as h for sparse noise stimulus (Pearson correlation coefficient, r=0.526, p=4.19e-20, slope=0.44, intercept=0.045).
Figure 5.
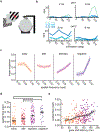
Figure 5.. Spatial frequency tuning demonstrates coarse-to-fine processing around gaze shifts.
a. Schematic of head-fixed drifting gratings recordings. b. Orientation tuning curves for two example cells from head-fixed drifting gratings stimulus. Responses are shown for eight orientations of gratings (0 deg is the horizontal rightwards direction), three spatial frequencies, and low (left) and high (right) temporal frequencies. Spontaneous firing rates are shown as a horizontal dotted black line. c. Mean ± SEM spatial frequency tuning curve for gratings-responsive cells in each cluster (Multivariate two-way ANOVA, SF x cluster, F=9.20, p=8.71e-10; n=9 mice, grating responsive cells=384/716, early=71, late=96, biphasic=98, negative=29, unresponsive=90). d. Spatial frequency preference for gratings-responsive cells in each gaze shift response cluster, calculated as a weighted mean of responses. Median and standard error are shown for each cluster. Bars above indicate statistical significance at p<0.05 (linear mixed effects model, n=9 mice, n=384 cells; early vs. late p=0.145, early vs. biphasic p=3.04e-7, early vs. negative p=5.49e-06, late vs. biphasic p=4.54e-5, late vs. negative p=3.96e-4, biphasic vs. negative p=0.620). 20/384 cells had a weighted mean spatial frequency response greater than 0.25 cps and are not visible in the scatter plot but are included in the calculation of median. e. Weighted spatial frequency preference versus gaze shift response latency, for all cells responsive to gratings. Running median ± SEM for all cells is overlaid. The color of each point indicates the cluster from gaze shift responses. (Pearson correlation coefficient, r=0.286, p=1.73e-6).
Figure 6.
Figure 6.. A similar temporal sequence of V1 saccade responses in freely gazing marmosets.
a. Schematic of marmoset natural image free-viewing. b. Three example cells’ spike raster (top) and PETH (bottom) for 500 randomly selected saccades. c. Normalized PETHs for saccades, grouped by k-means clustering, with each cluster’s mean overlaid. n=2 marmosets, 334 units (early=64, late=136, biphasic=84, negative=50). d. Mean normalized saccade response of cells in each cluster. e. Normalized saccade PETHs sorted along the y-axis by positive peak latency. Vertical colorbar indicates the response cluster for each cell using colormap from c.
Figure 7.
Figure 7.. A coarse-to-fine temporal sequence in freely gazing marmosets.
a. Schematic of grating stimulus. Sinusoidal gratings of varying spatial frequency and orientation were presented rapidly (60Hz) while monkeys performed saccades to forage for an embedded Gabor patch. b. Mean ± SEM spatial frequency tuning curve for gratings-responsive cells in each cluster (Multivariate two-way ANOVA, SF x cluster F=12.43, p=1.82e-18; n=2 marmosets, n=238 cells, early=41, late=88, biphasic=70, negative=39). c. Weighted spatial frequency (SF) preference for each saccade response cluster, calculated as a weighted mean of responses for 4 presented SFs. Median and standard error are shown for each cluster. Only gratings-responsive cells are shown. Bars above indicate statistical significance at p<0.05 (linear mixed effects model, n=2 marmosets, n=238 cells; early vs. late p=5.77e-3, early vs. biphasic p=1.29e-4, early vs. negative p=9.71e-6, late vs. biphasic p=0.126, late vs. negative p=0.013, biphasic vs. negative p=0.253). d. Weighted SF preference versus saccade response latency. Running median ± SEM is overlaid. Point colors indicate response clusters. Outlier cells with a response latency below 25 ms (n=1) or above 160 ms (n=12) are not shown for plotting purposes but included in statistical tests. n=334 units (early=40, late=88, biphasic=69, negative=29; r=0.313, p=8.54e-7).

References

    1. Boi M, Poletti M, Victor JD & Rucci M Consequences of the Oculomotor Cycle for the Dynamics of Perception. Curr. Biol 27, 1268–1277 (2017). - PMC - PubMed
    1. Ahissar E & Arieli A Figuring space by time. Neuron 32, 185–201 (2001). - PubMed
    1. Schroeder CE, Wilson DA, Radman T, Scharfman H & Lakatos P Dynamics of Active Sensing and perceptual selection. Curr. Opin. Neurobiol 20, 172–176 (2010). - PMC - PubMed
    1. Gibson JJ The Ecological Approach to Visual Perception: Classic Edition. Psychology Press; (1979).
    1. Parker PRL, Brown MA, Smear MC & Niell CM Movement-Related Signals in Sensory Areas: Roles in Natural Behavior. Trends Neurosci. 43, 581–595 (2020). - PMC - PubMed

LinkOut - more resources