. 2024 Jan;27(1):34-47.
doi: 10.1038/s41593-023-01496-0. Epub 2023 Nov 23.

Stathmin-2 loss leads to neurofilament-dependent axonal collapse driving motor and sensory denervation

Affiliations

Stathmin-2 loss leads to neurofilament-dependent axonal collapse driving motor and sensory denervation

Jone López-Erauskin et al. Nat Neurosci. 2024 Jan.

Abstract

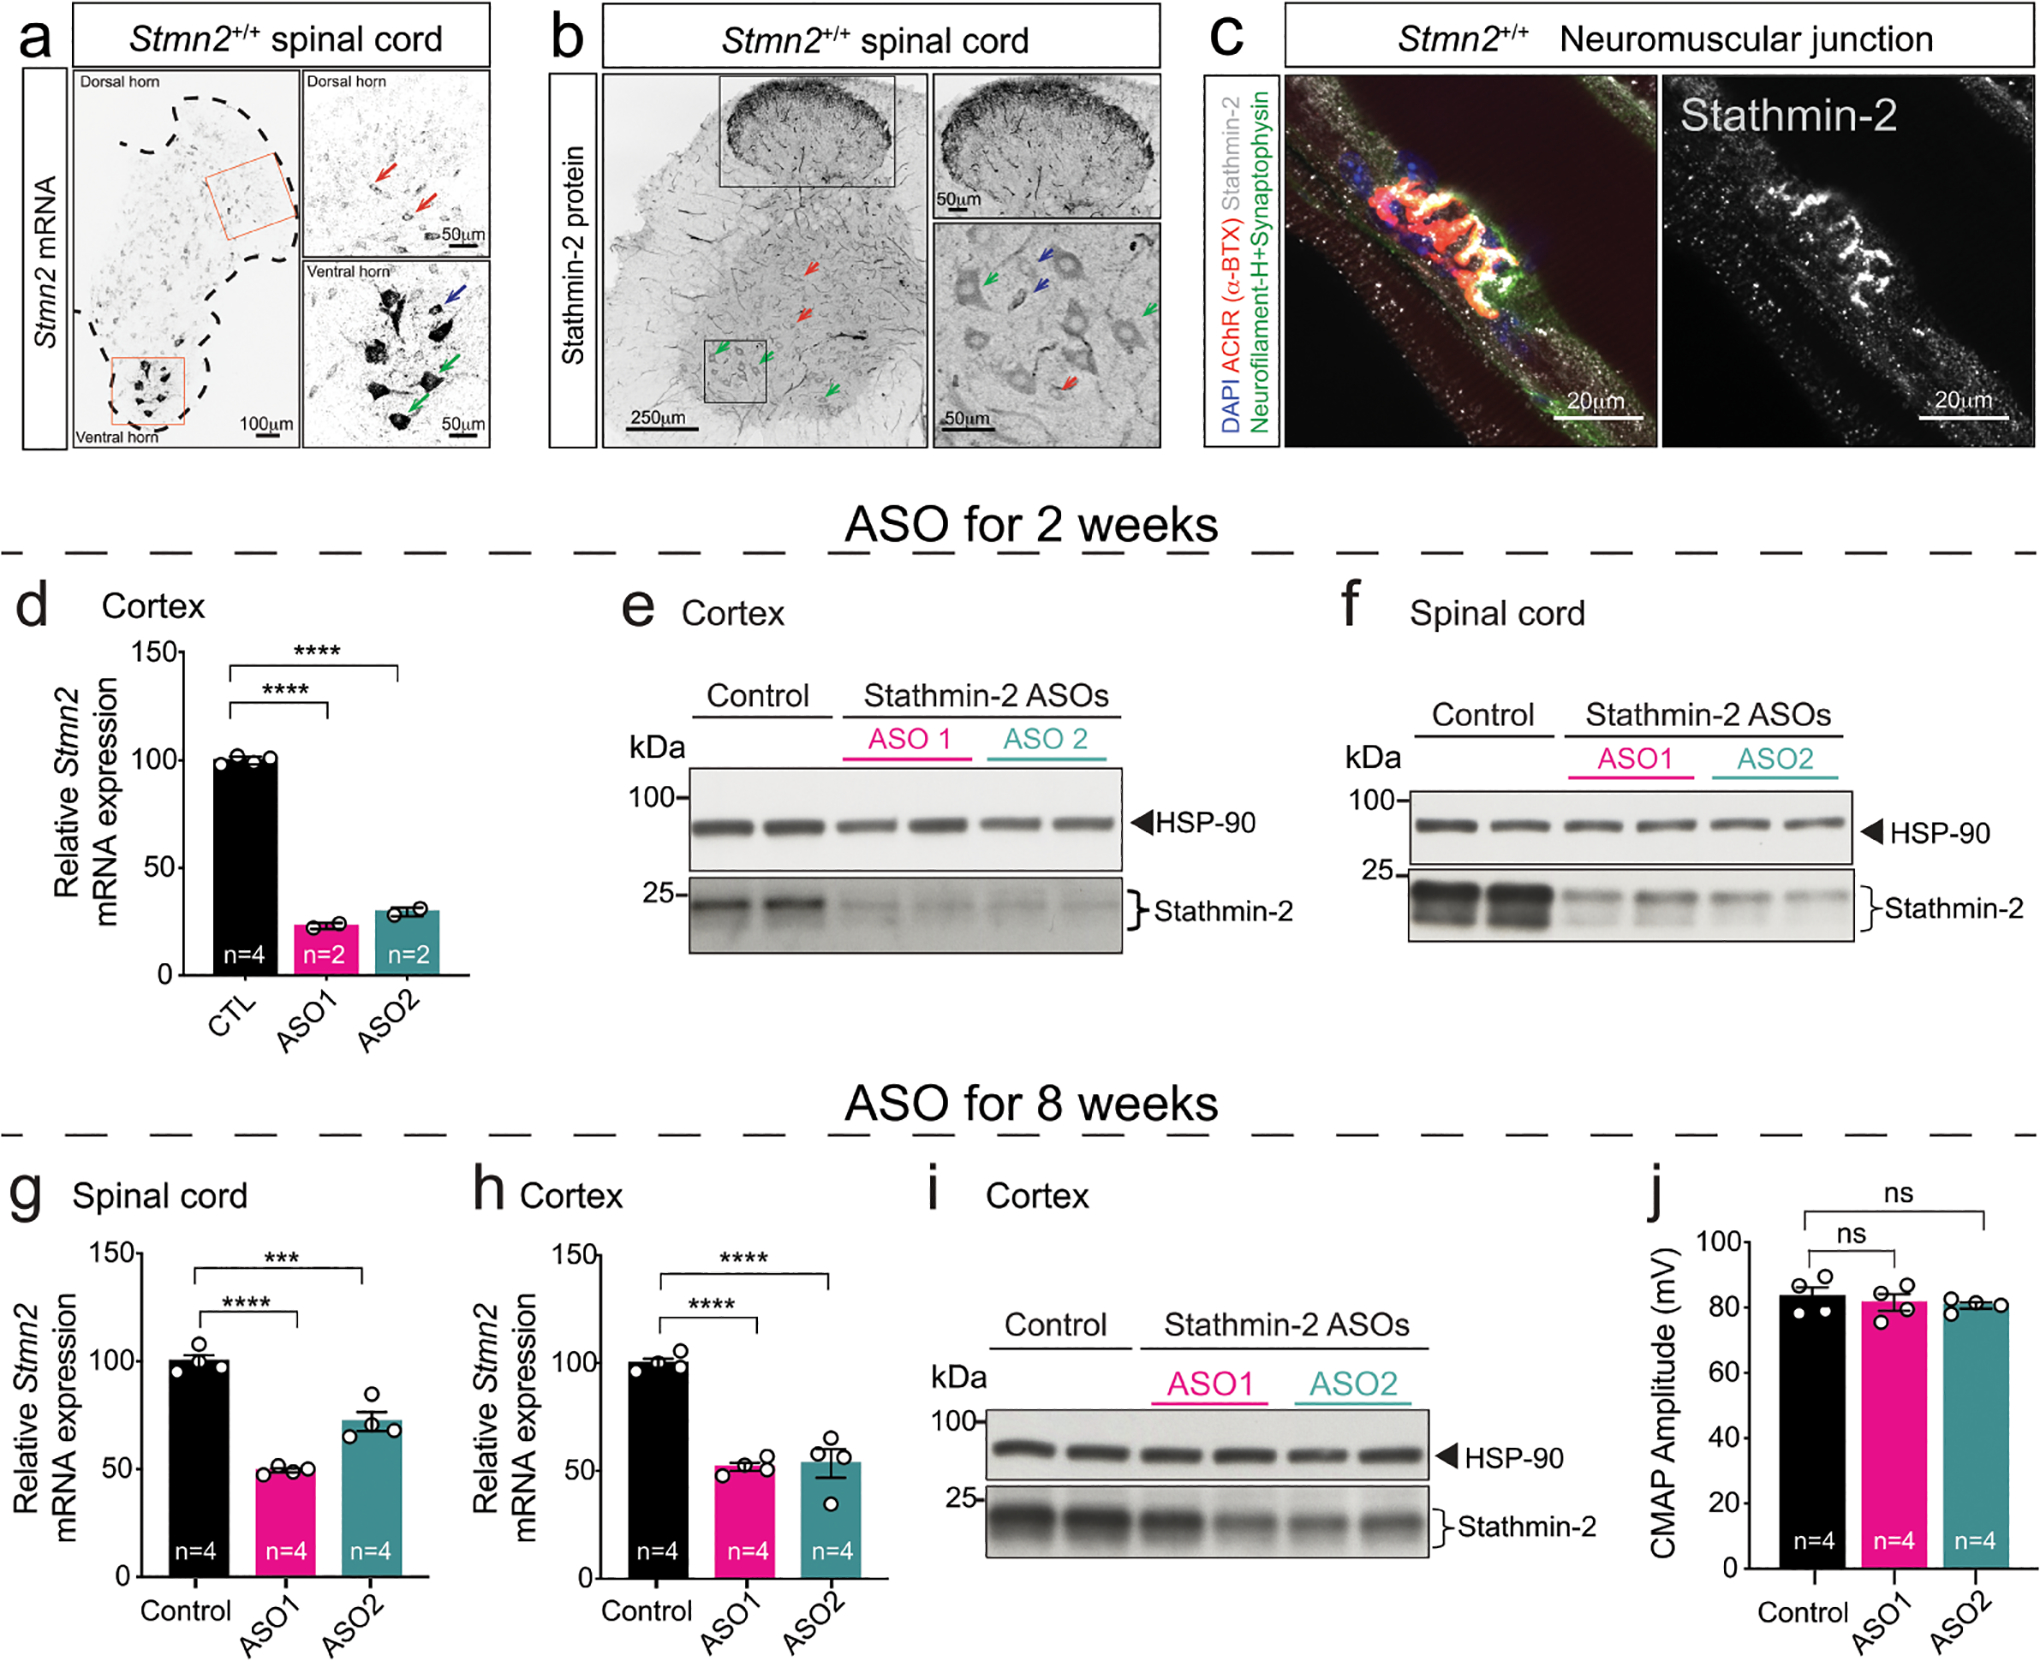
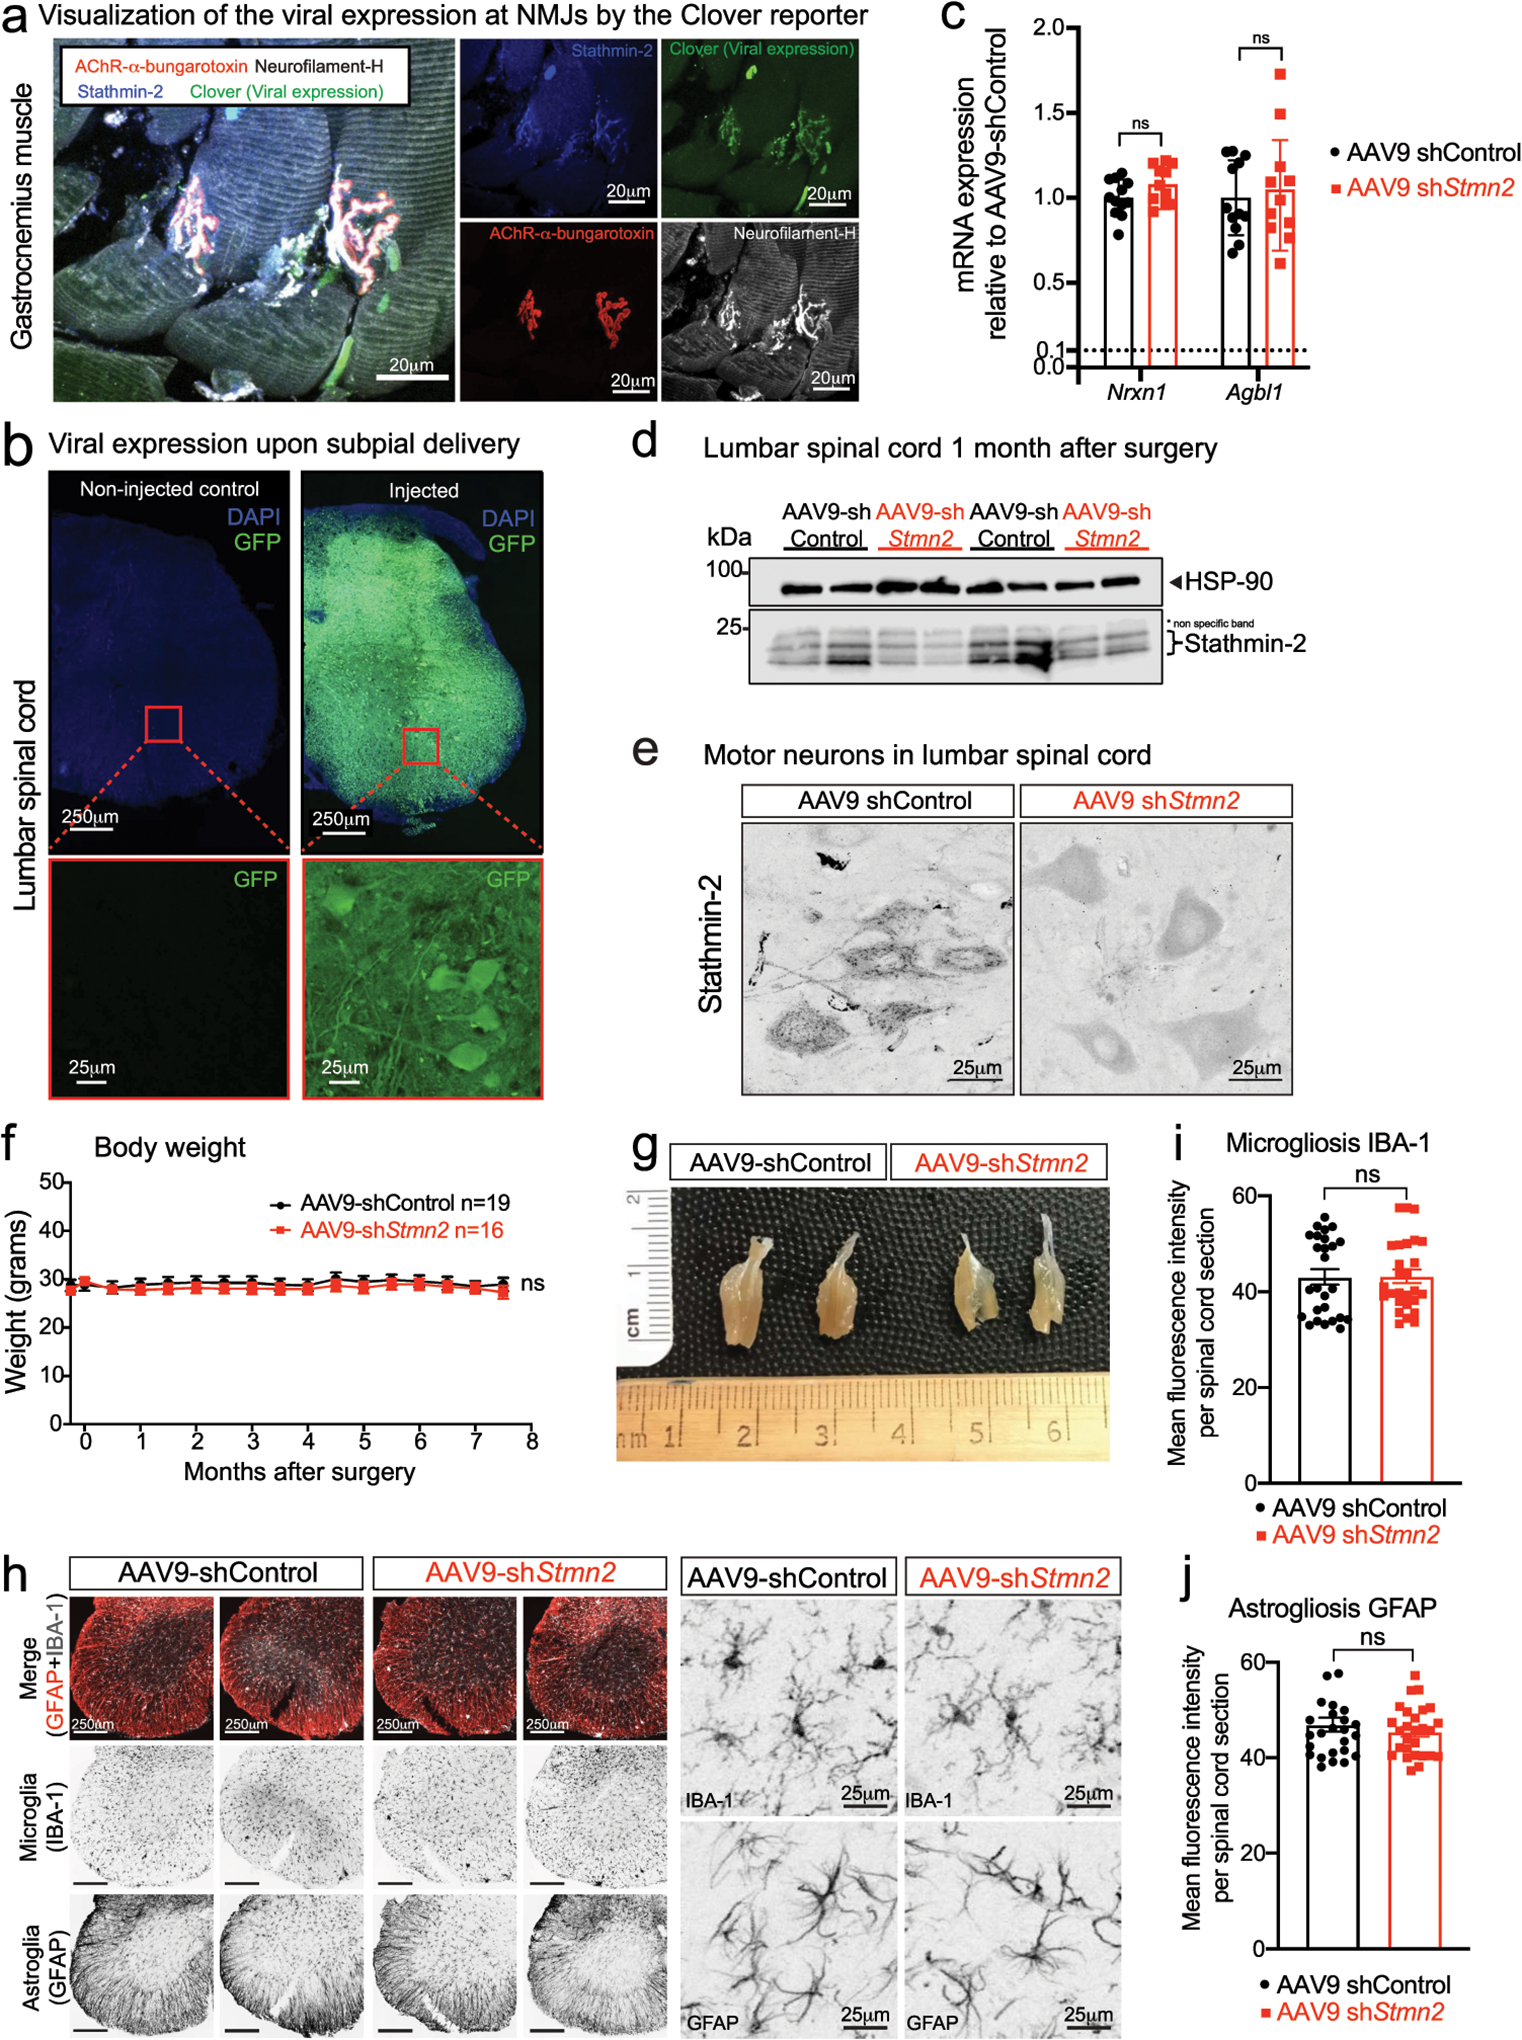
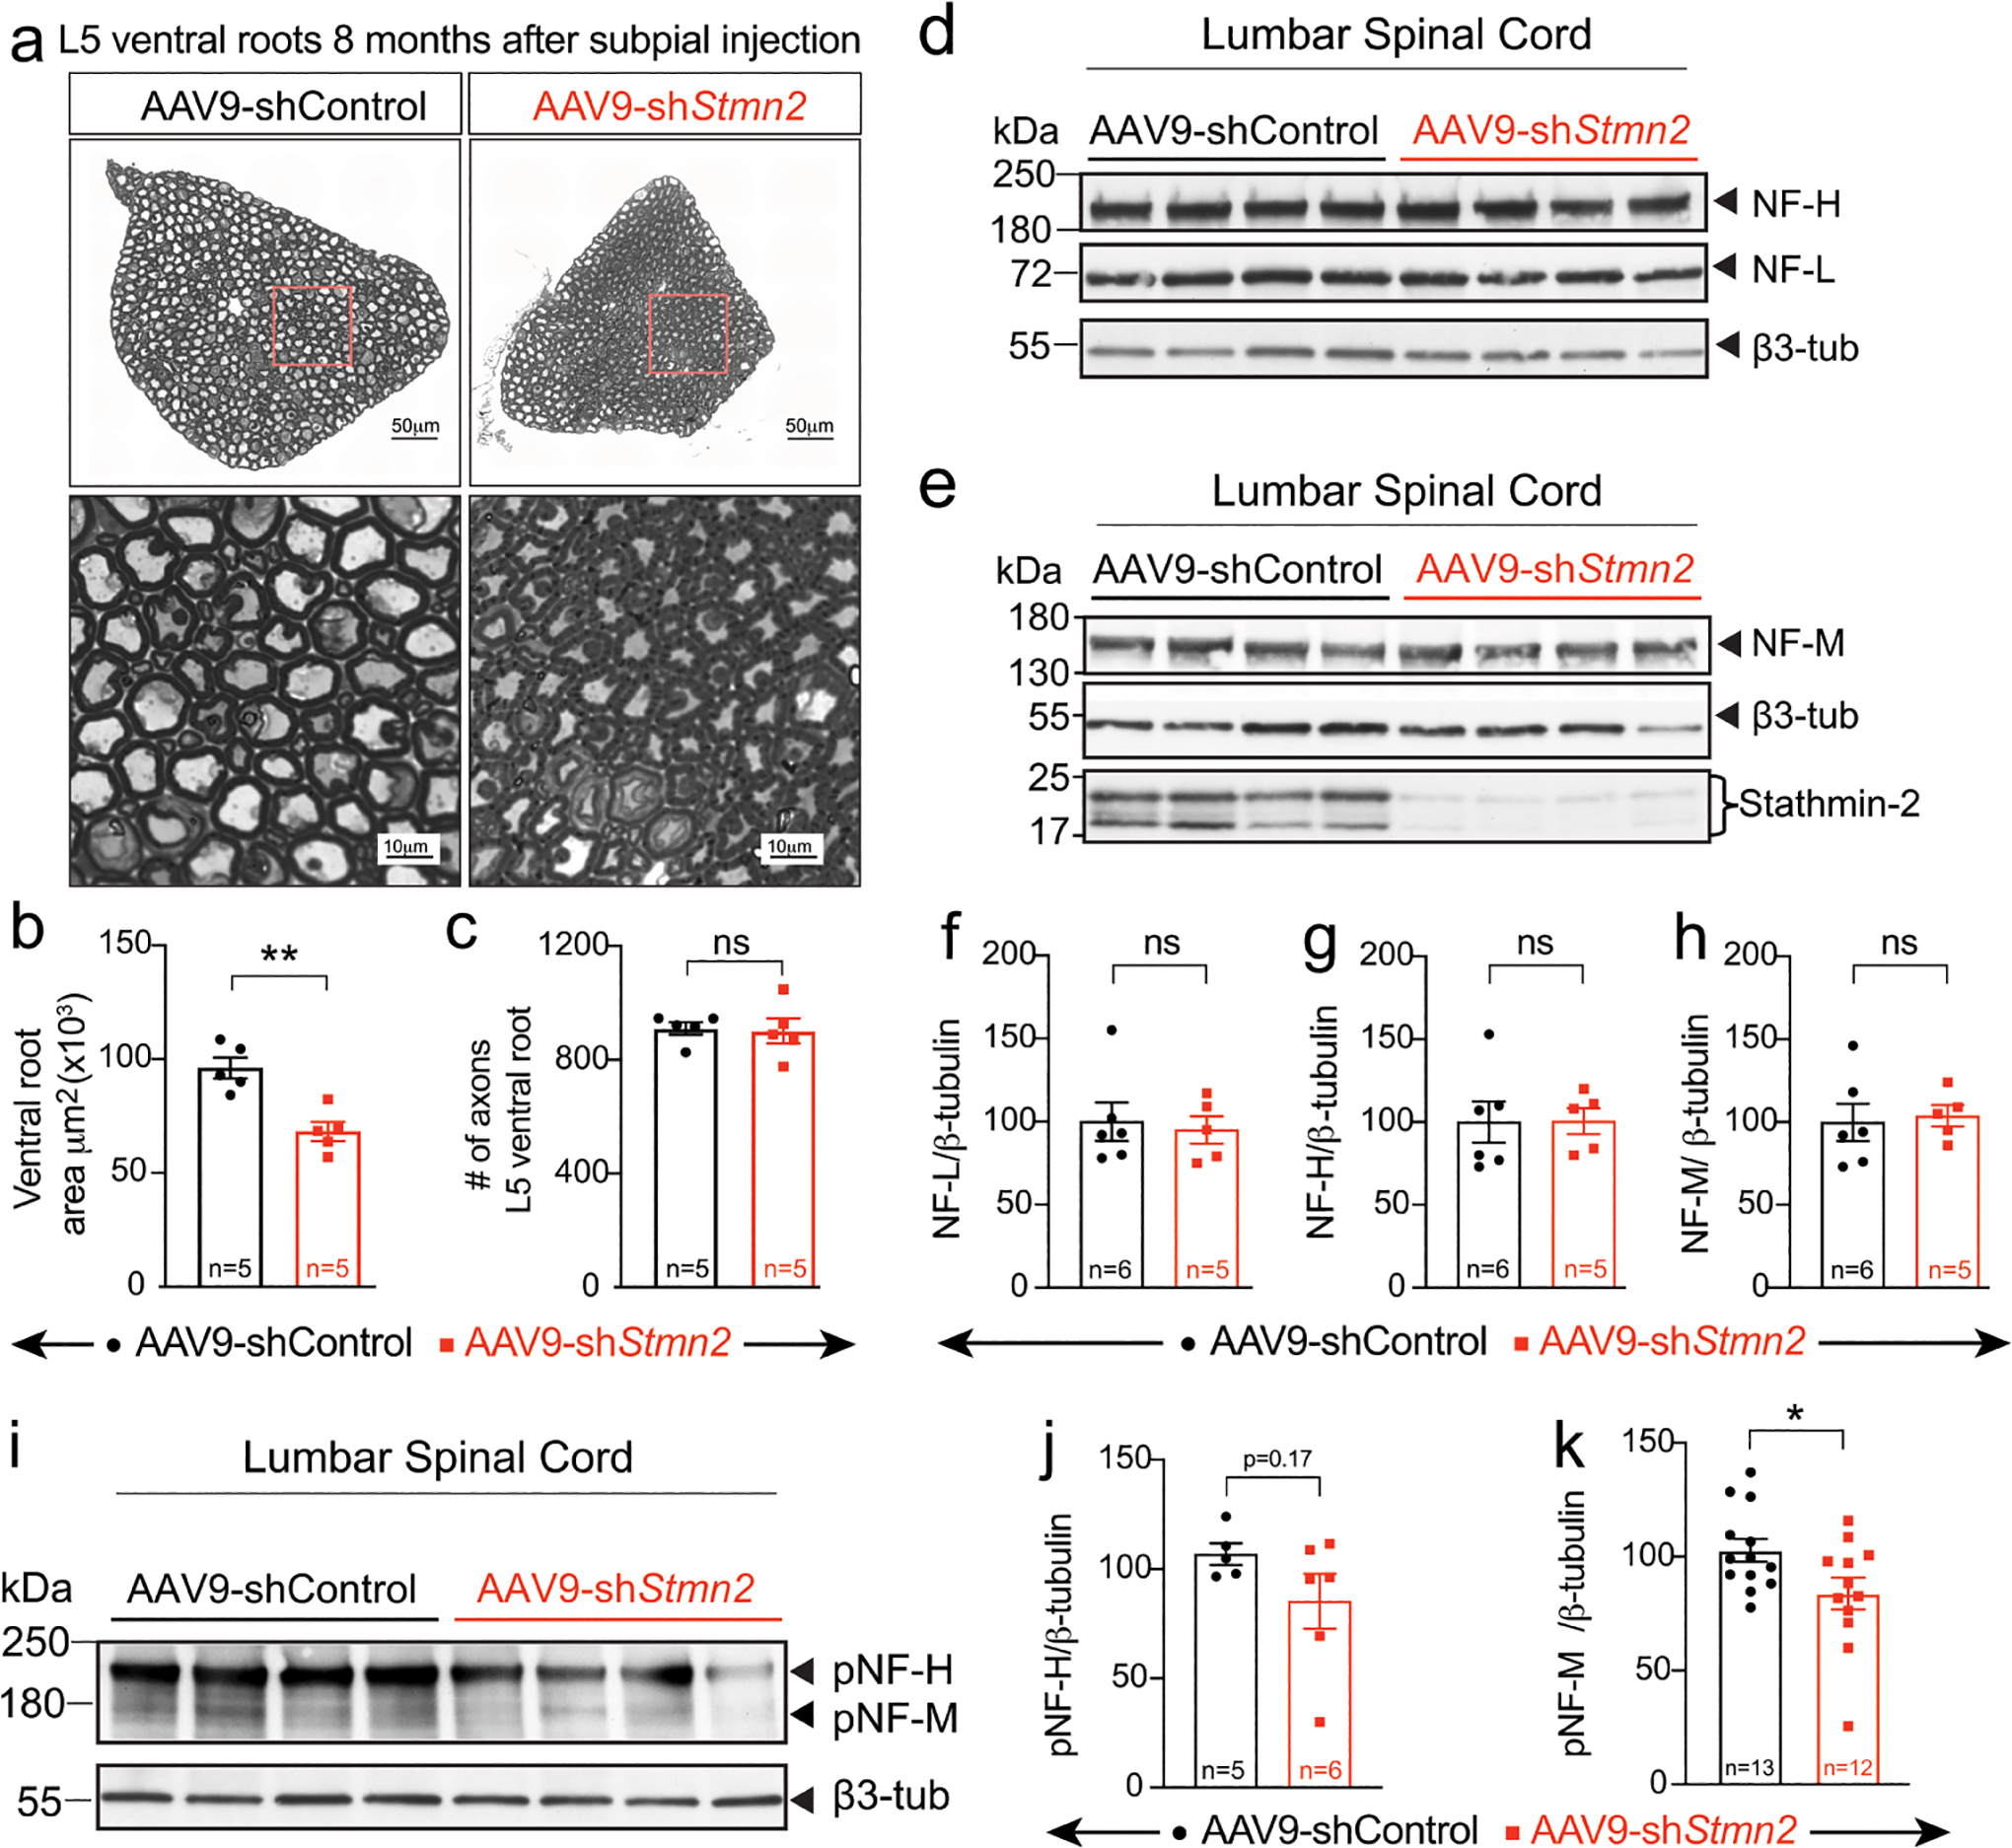
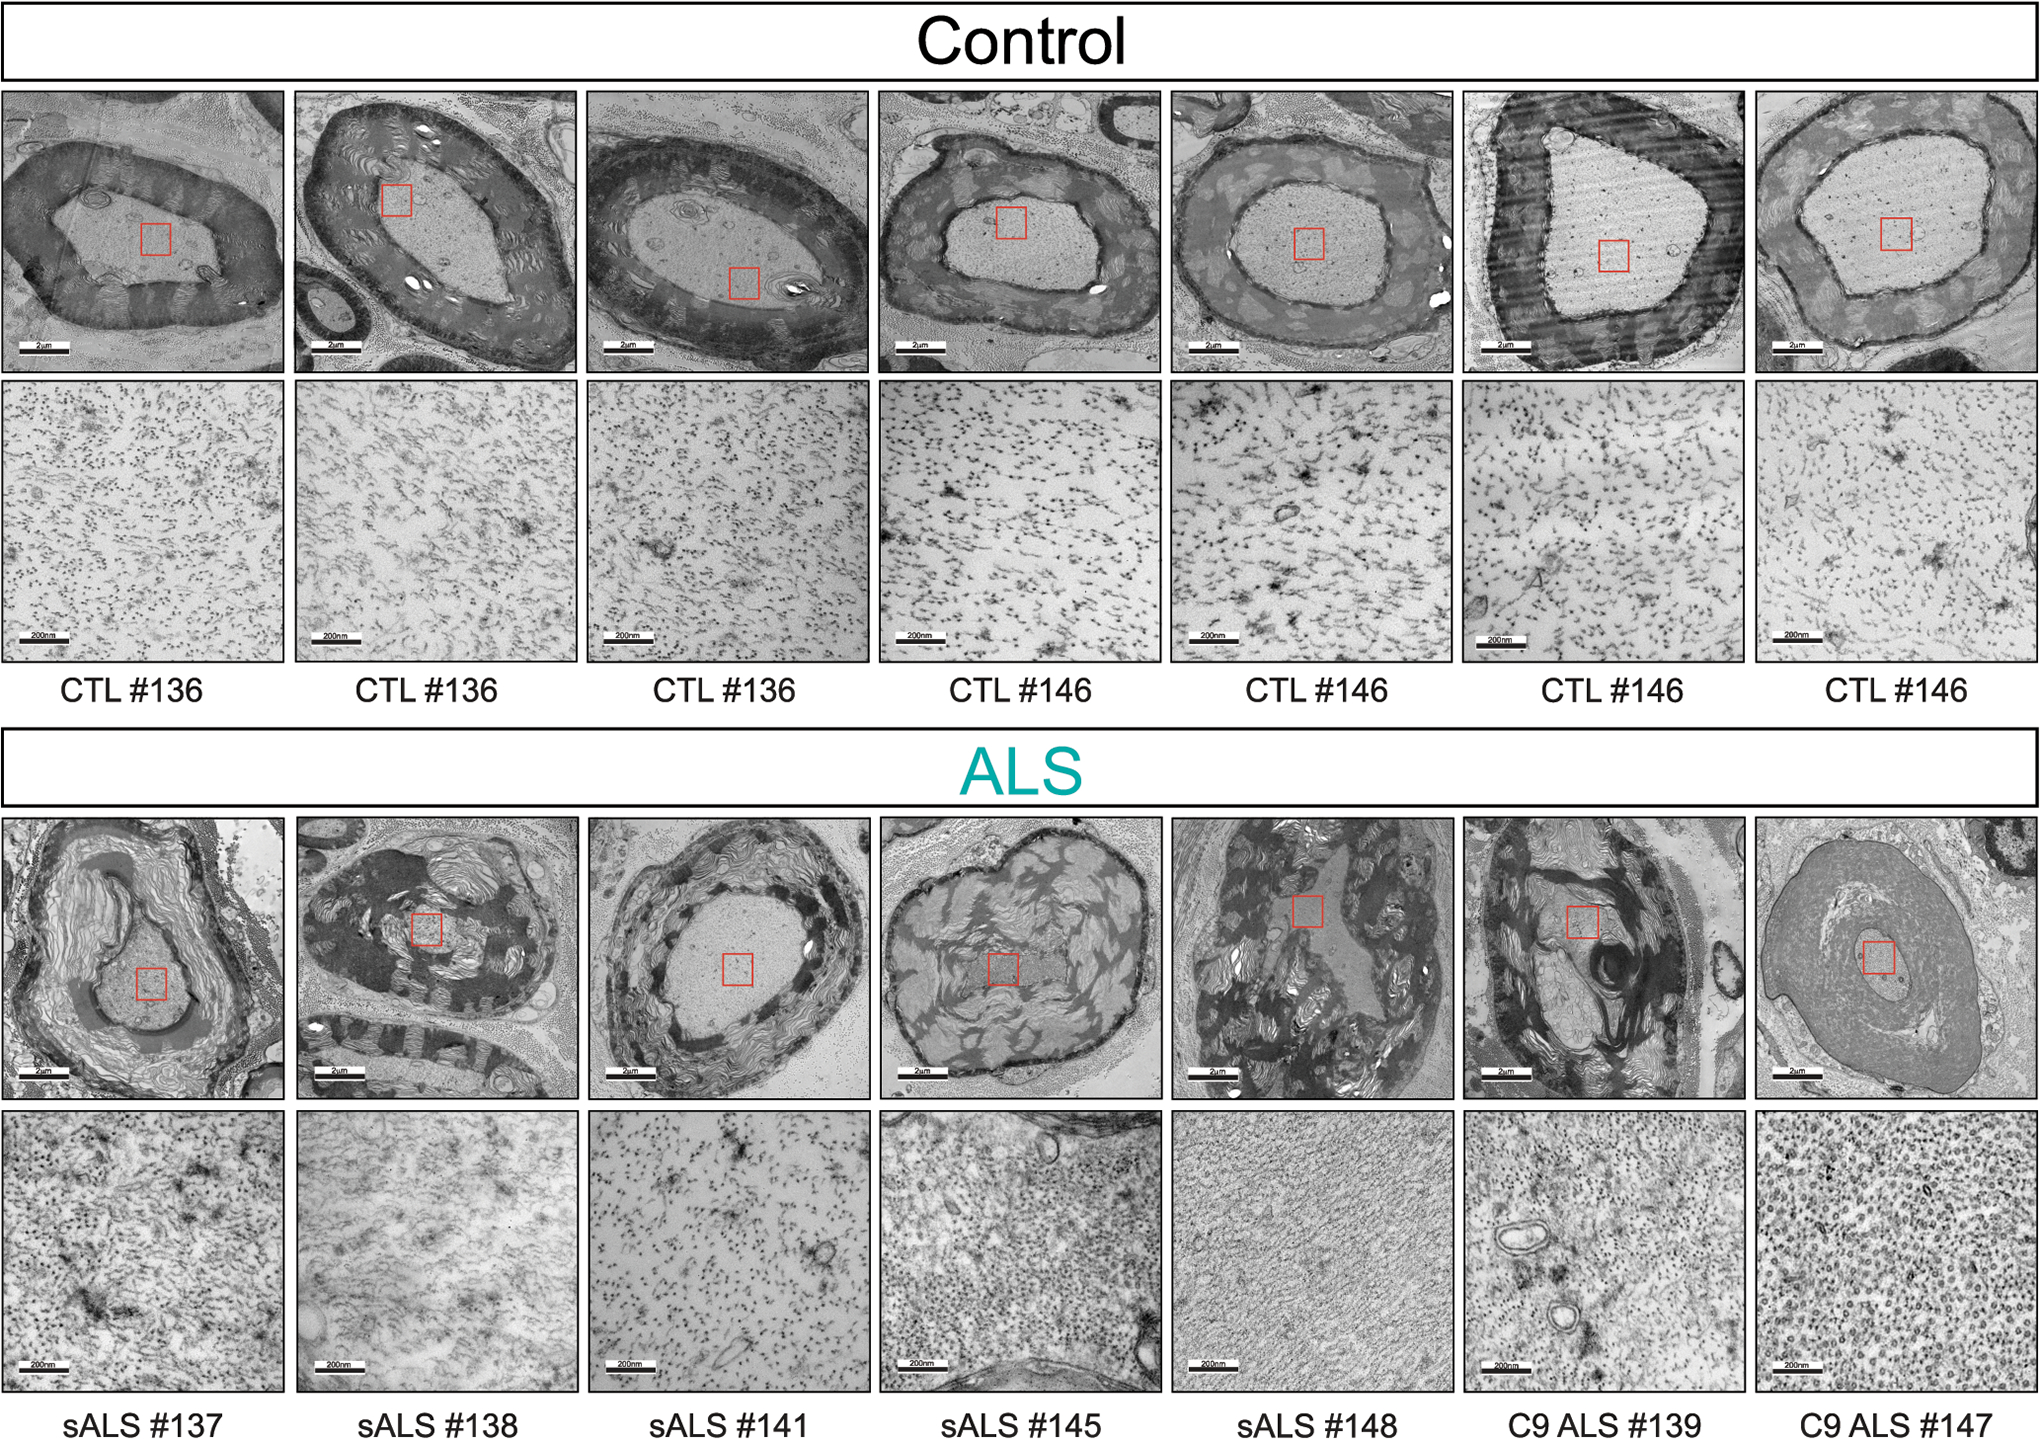
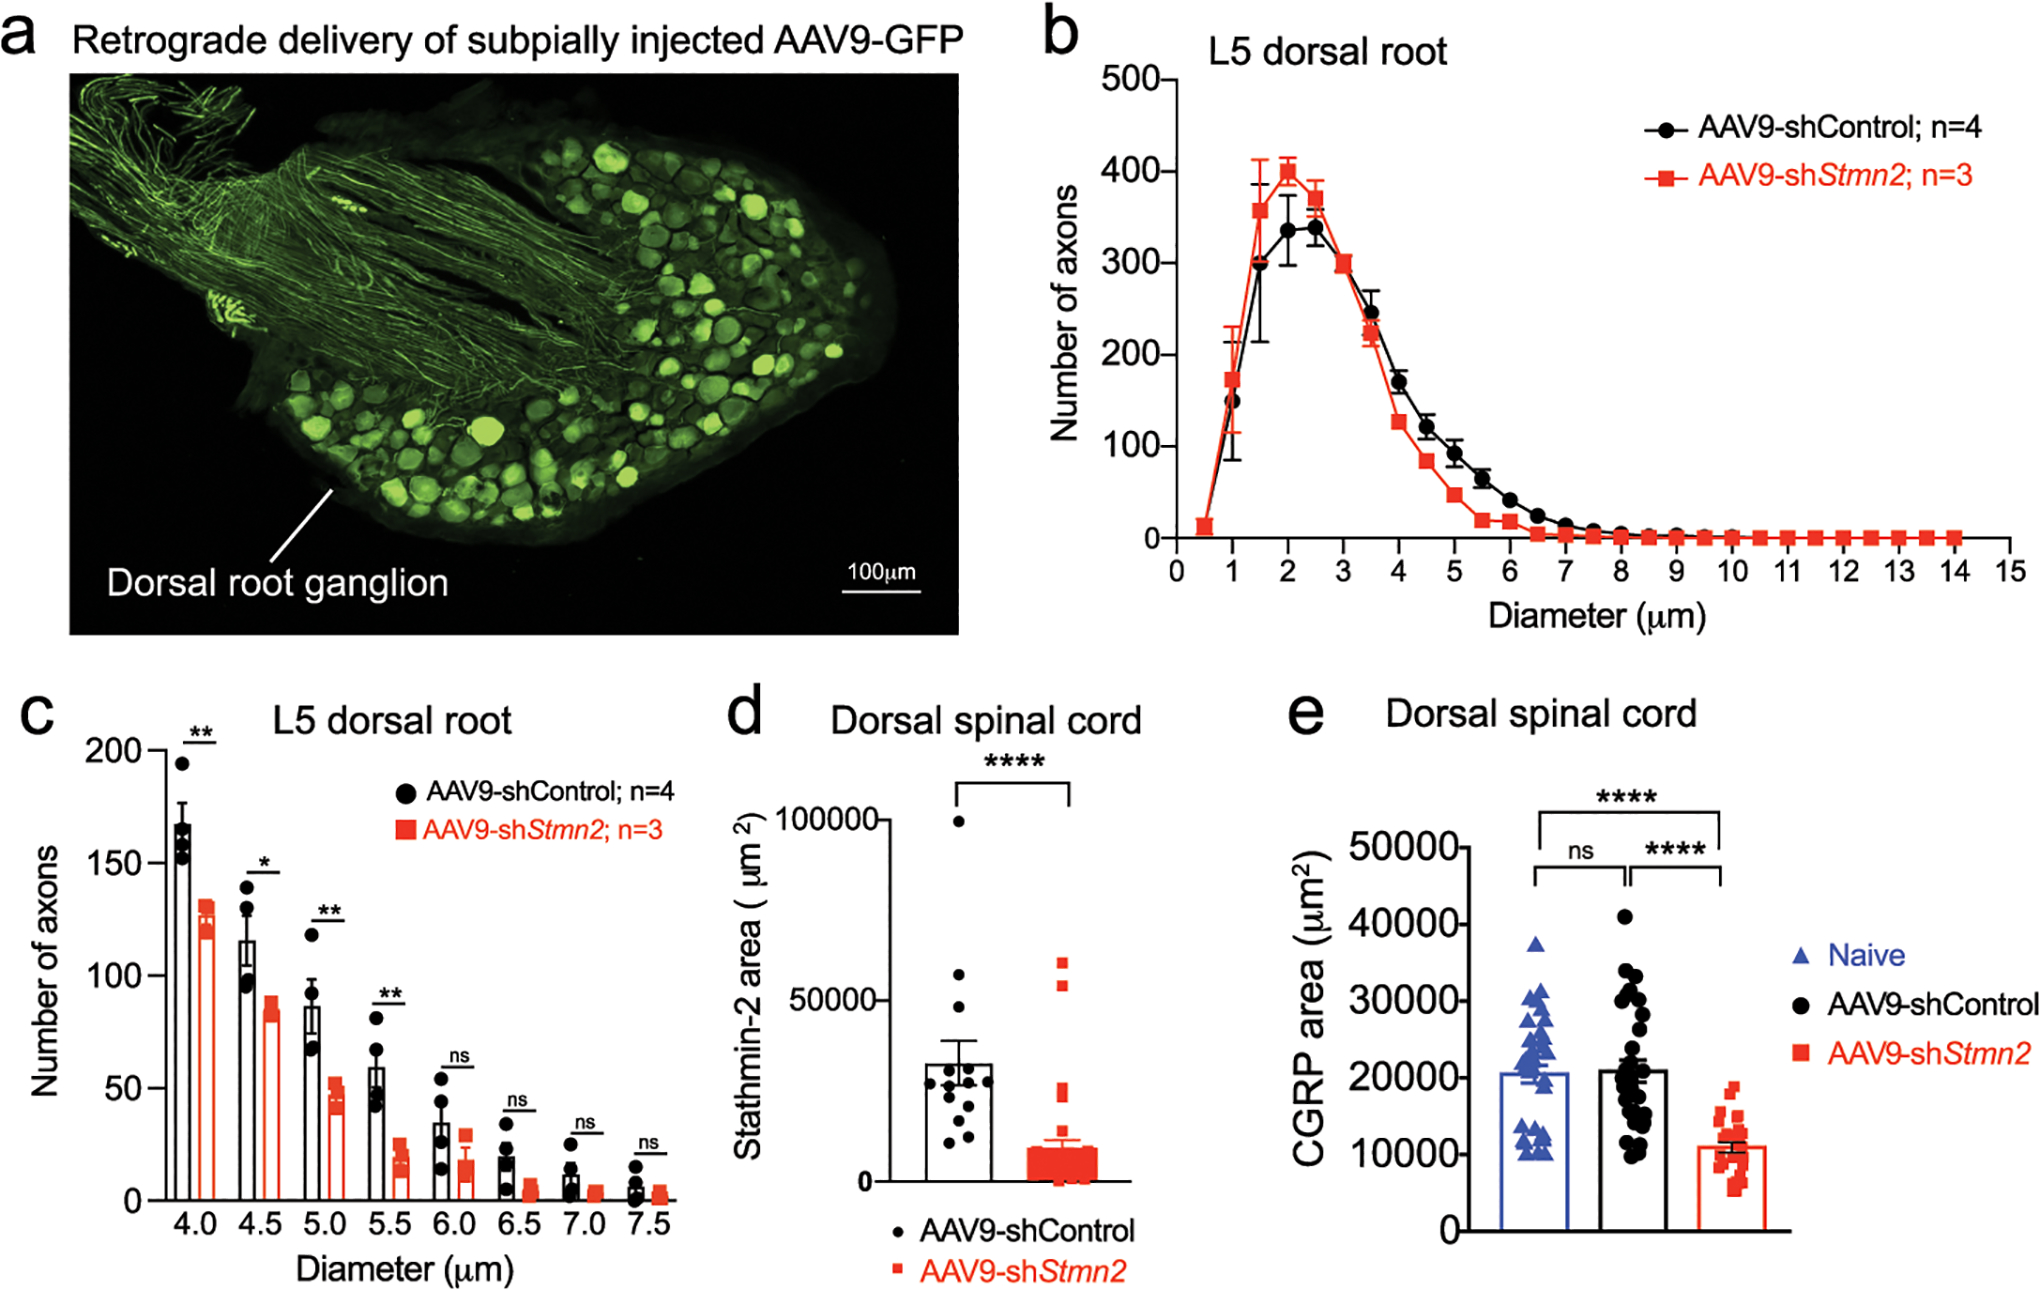
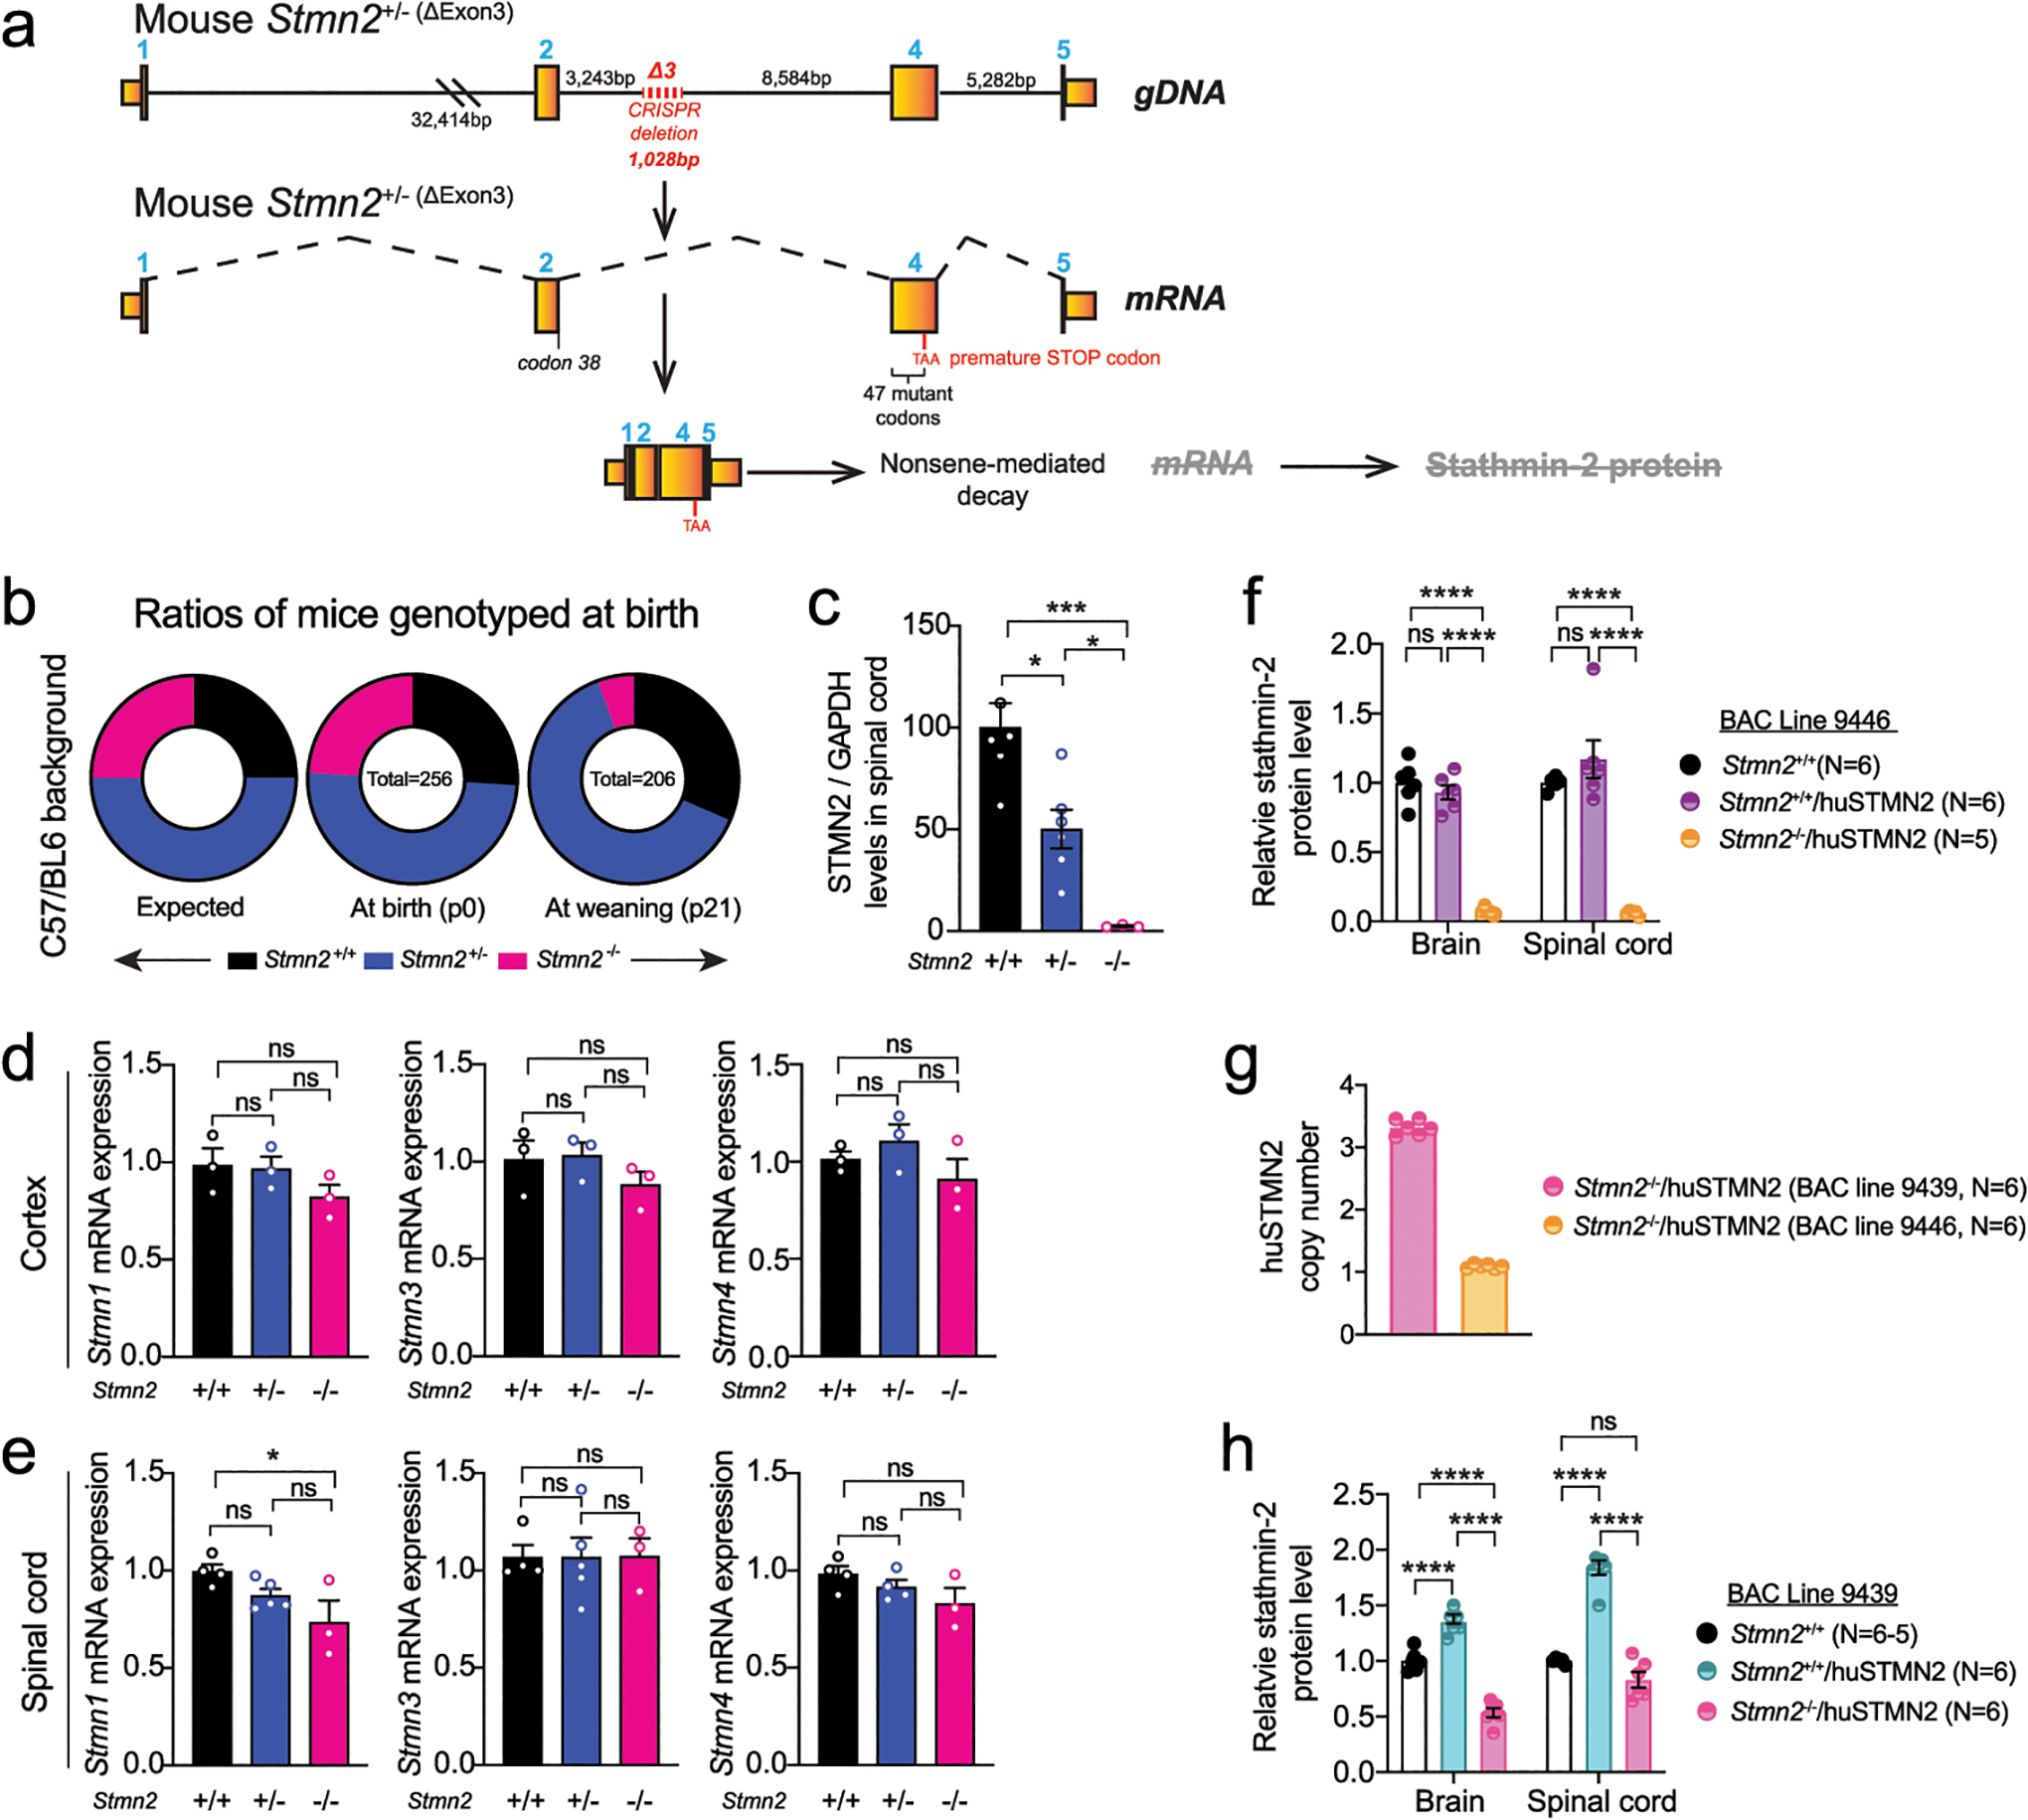
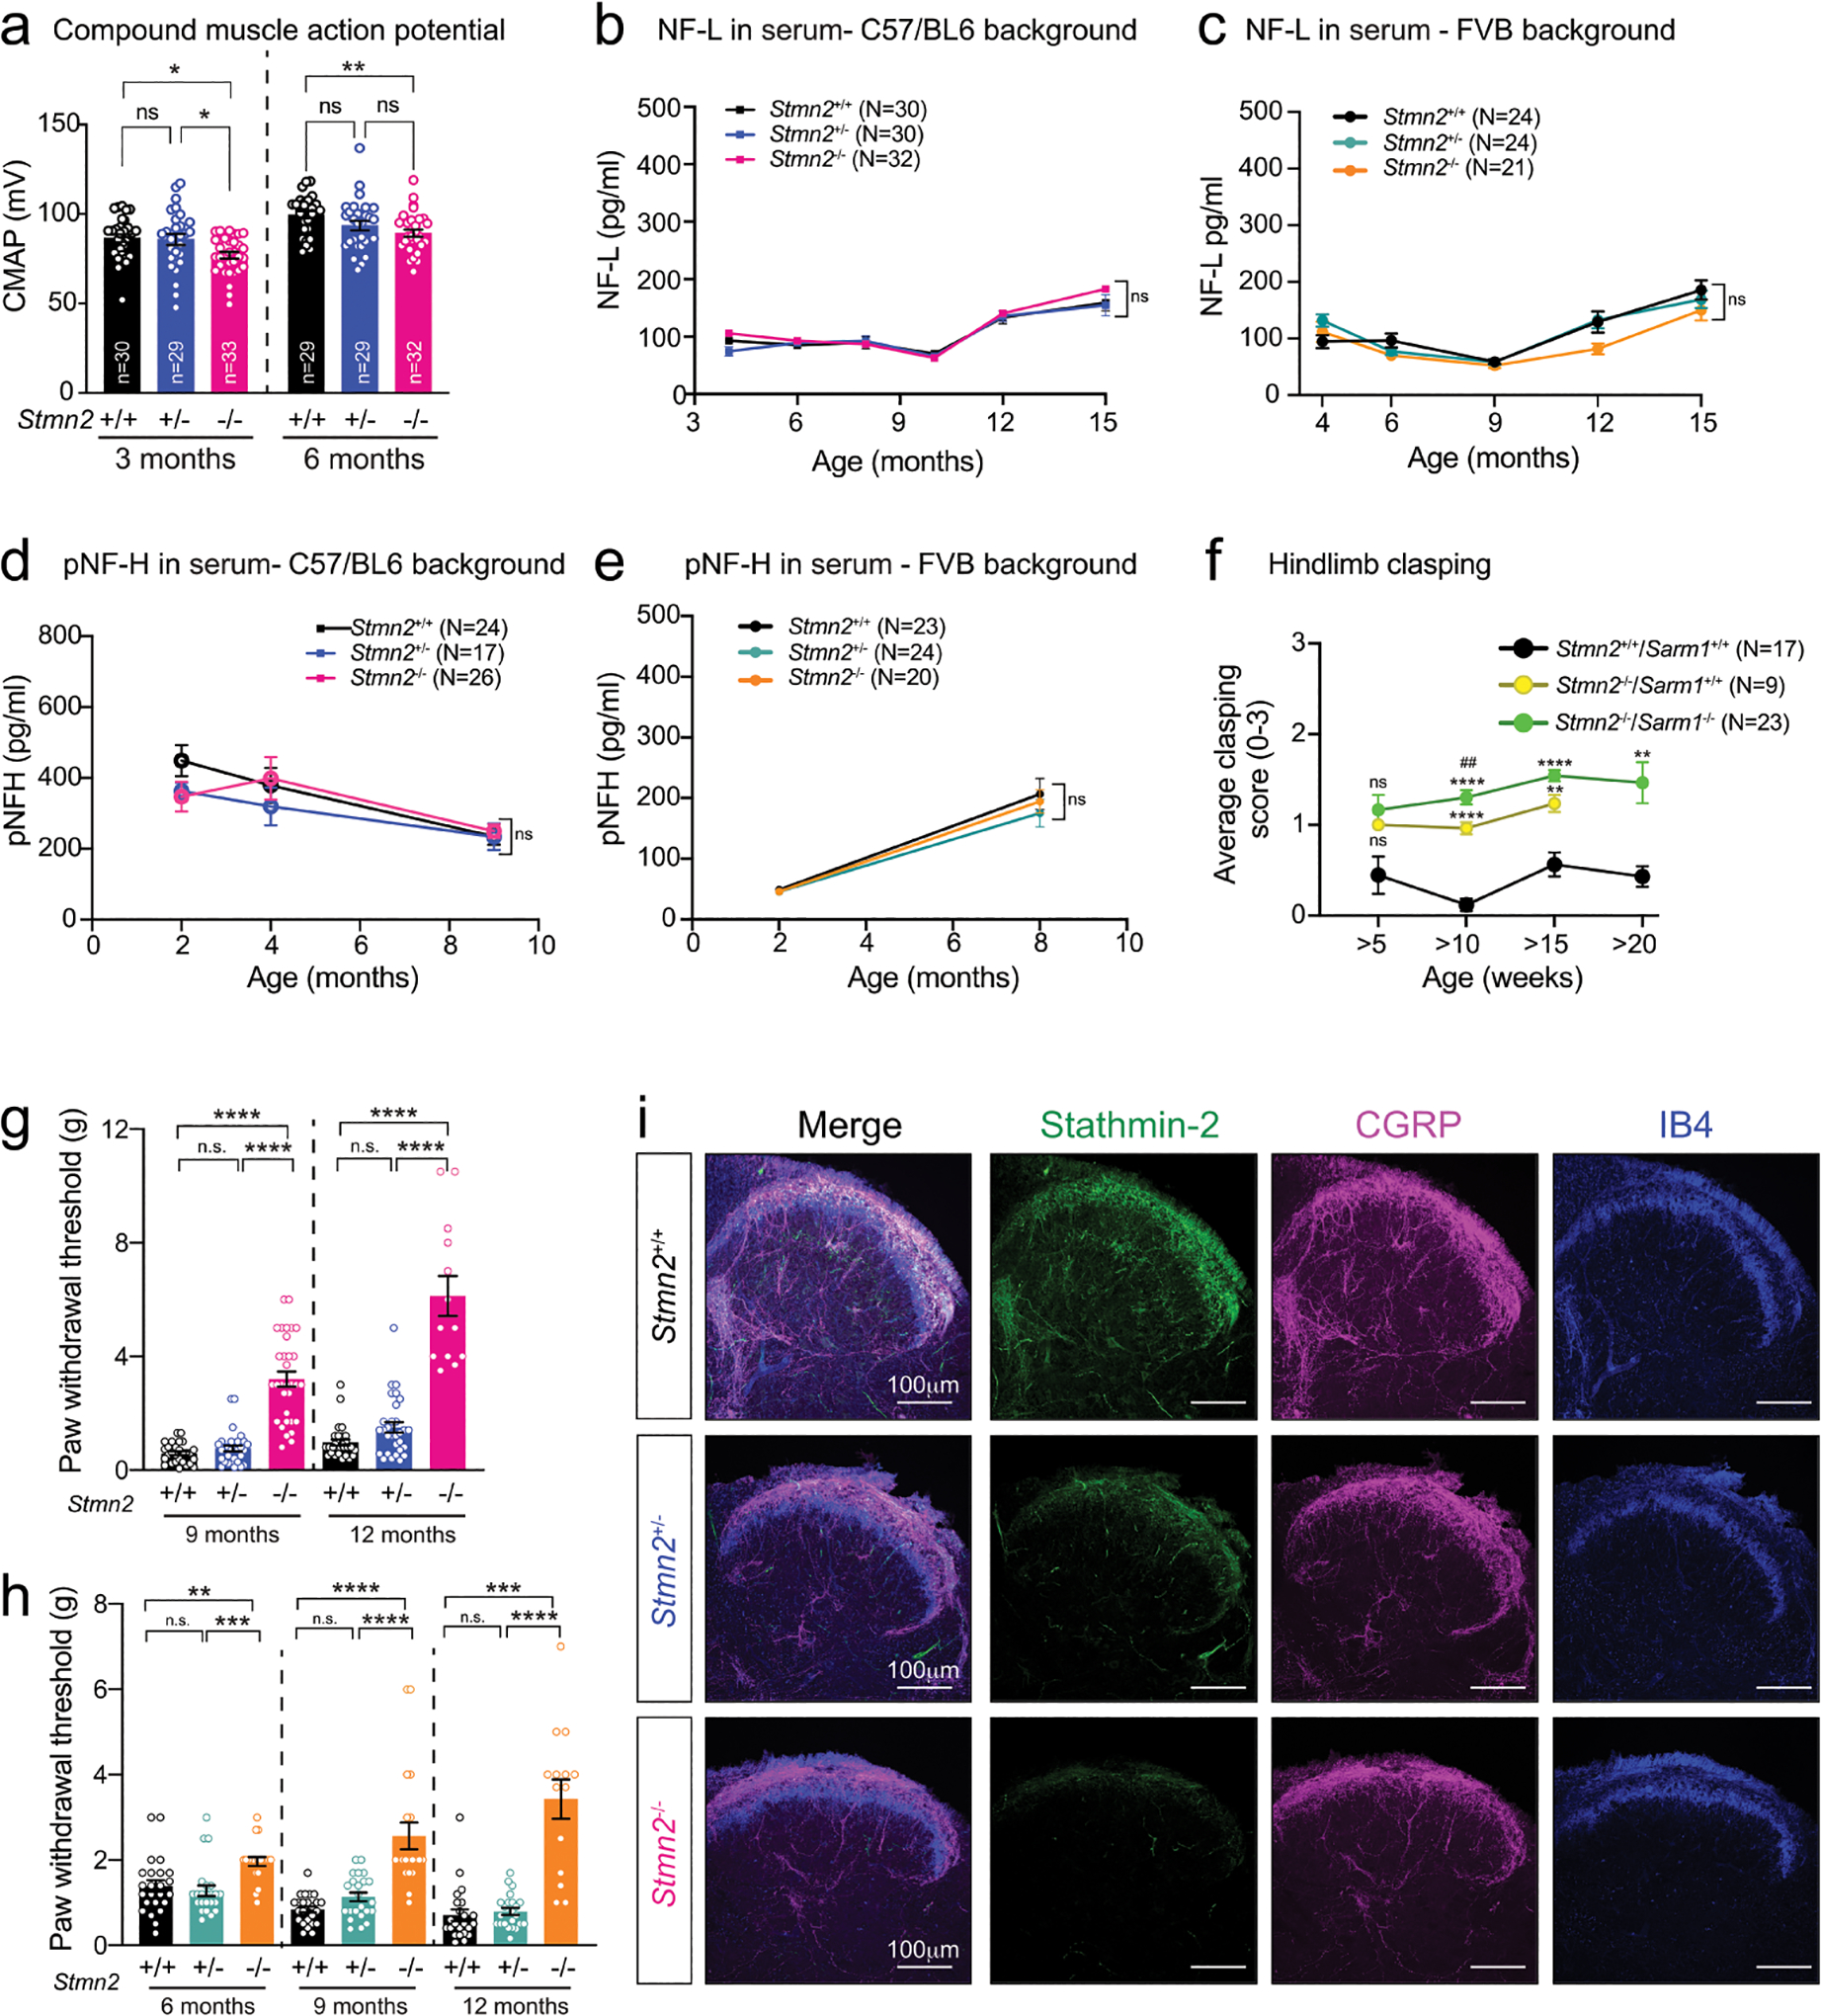
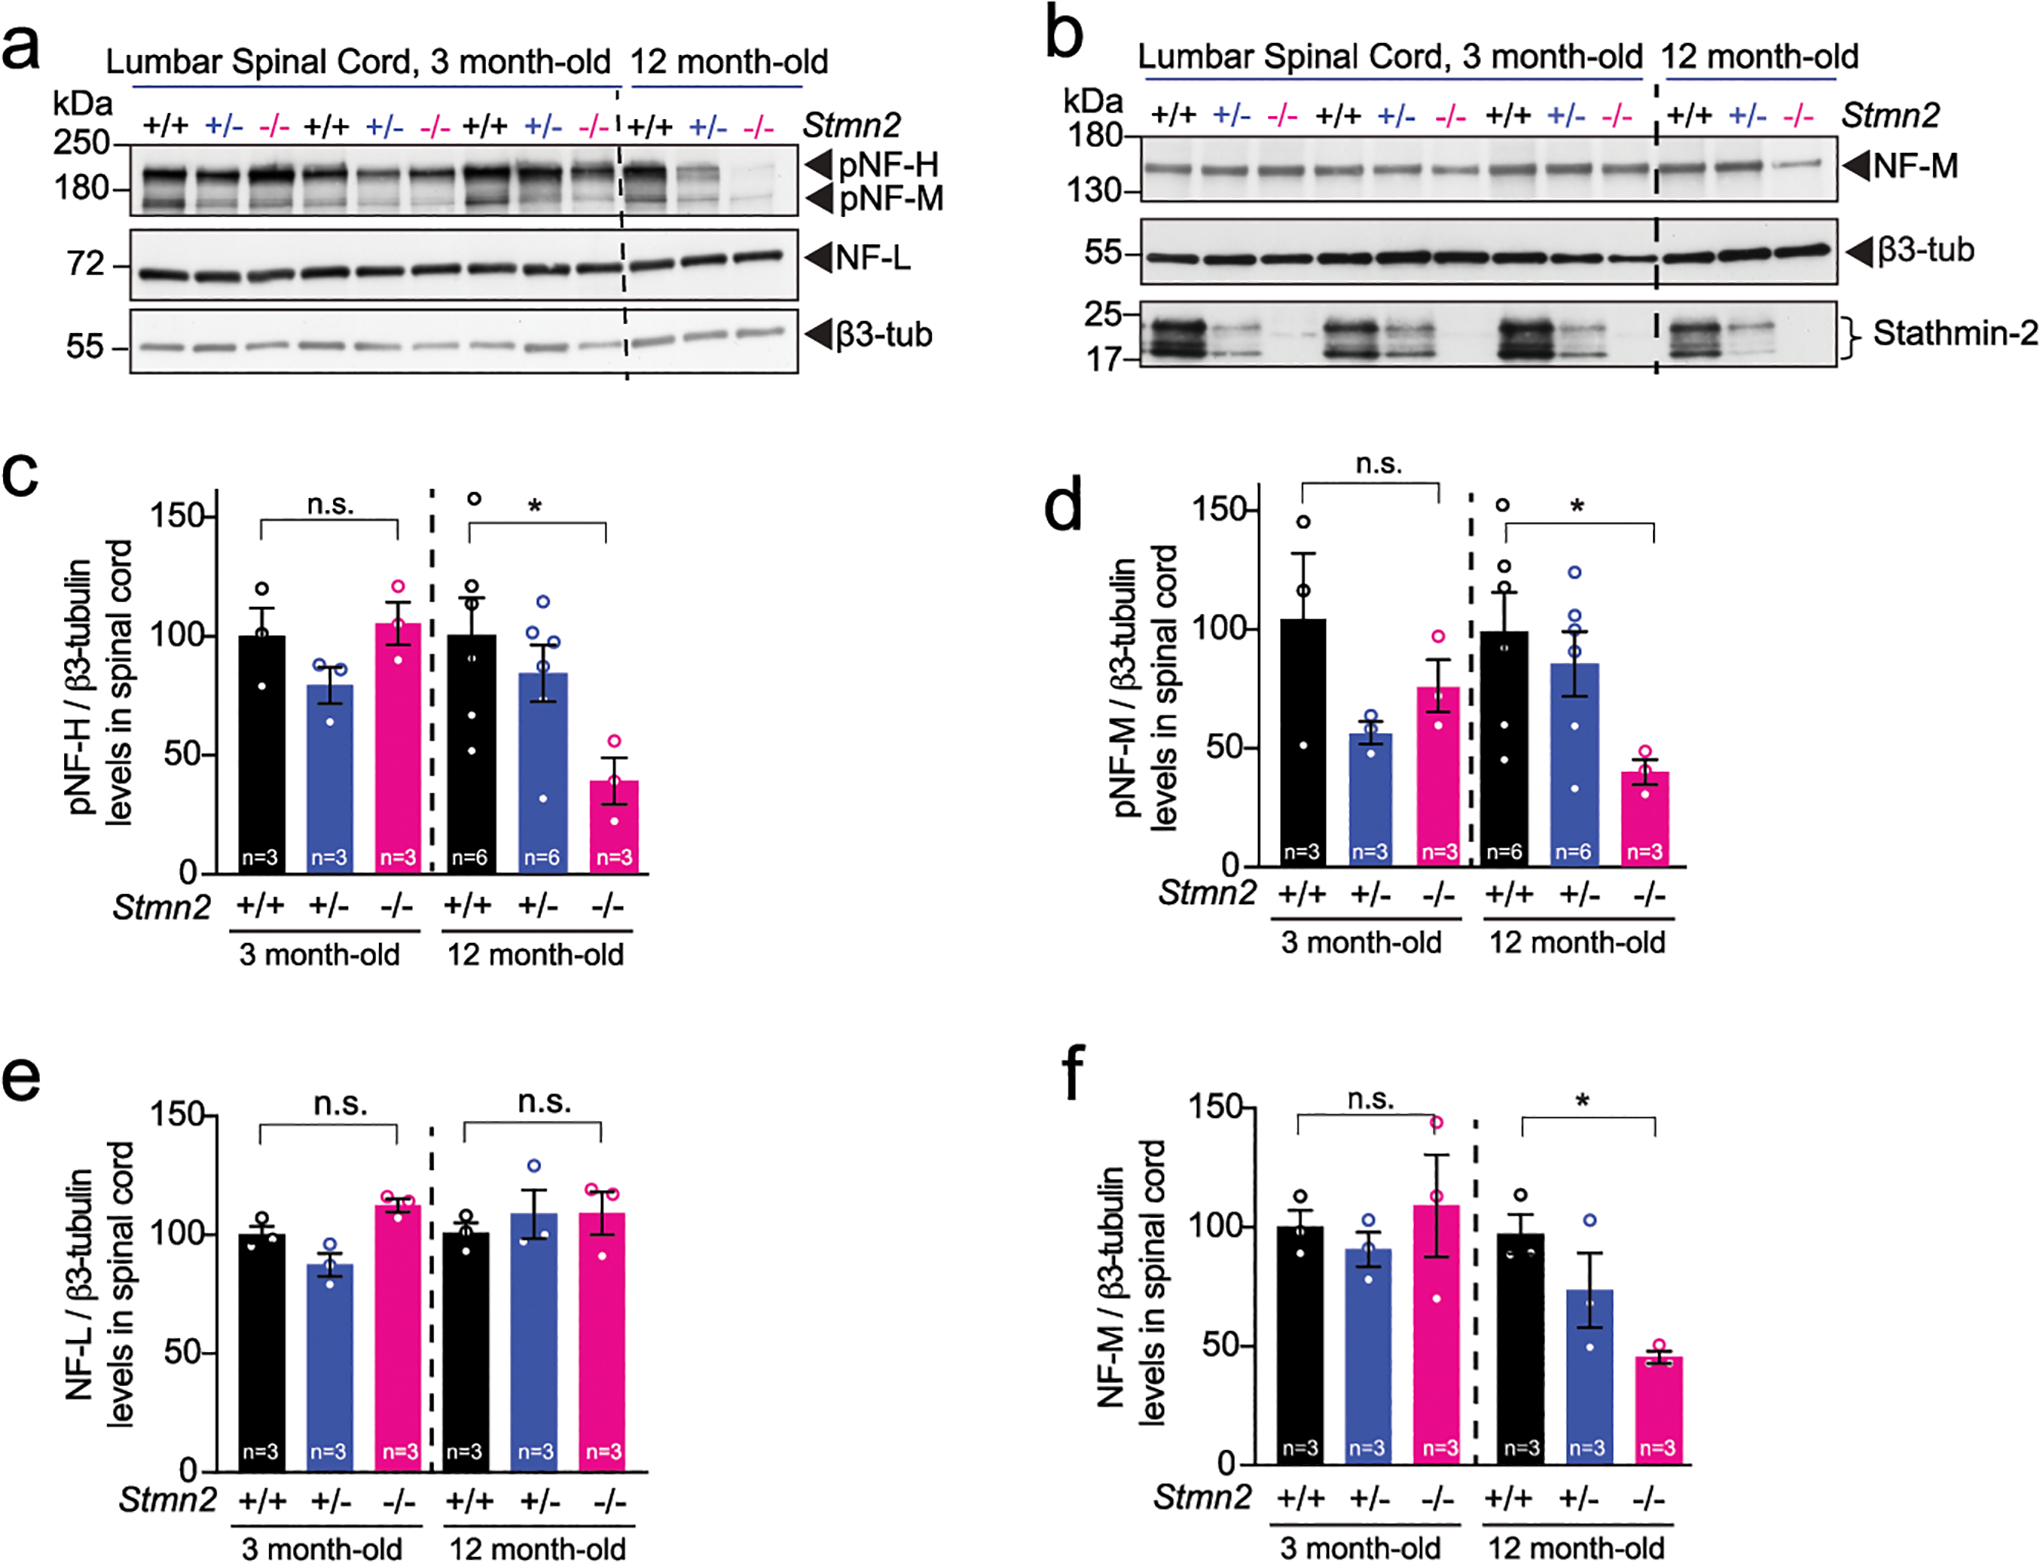
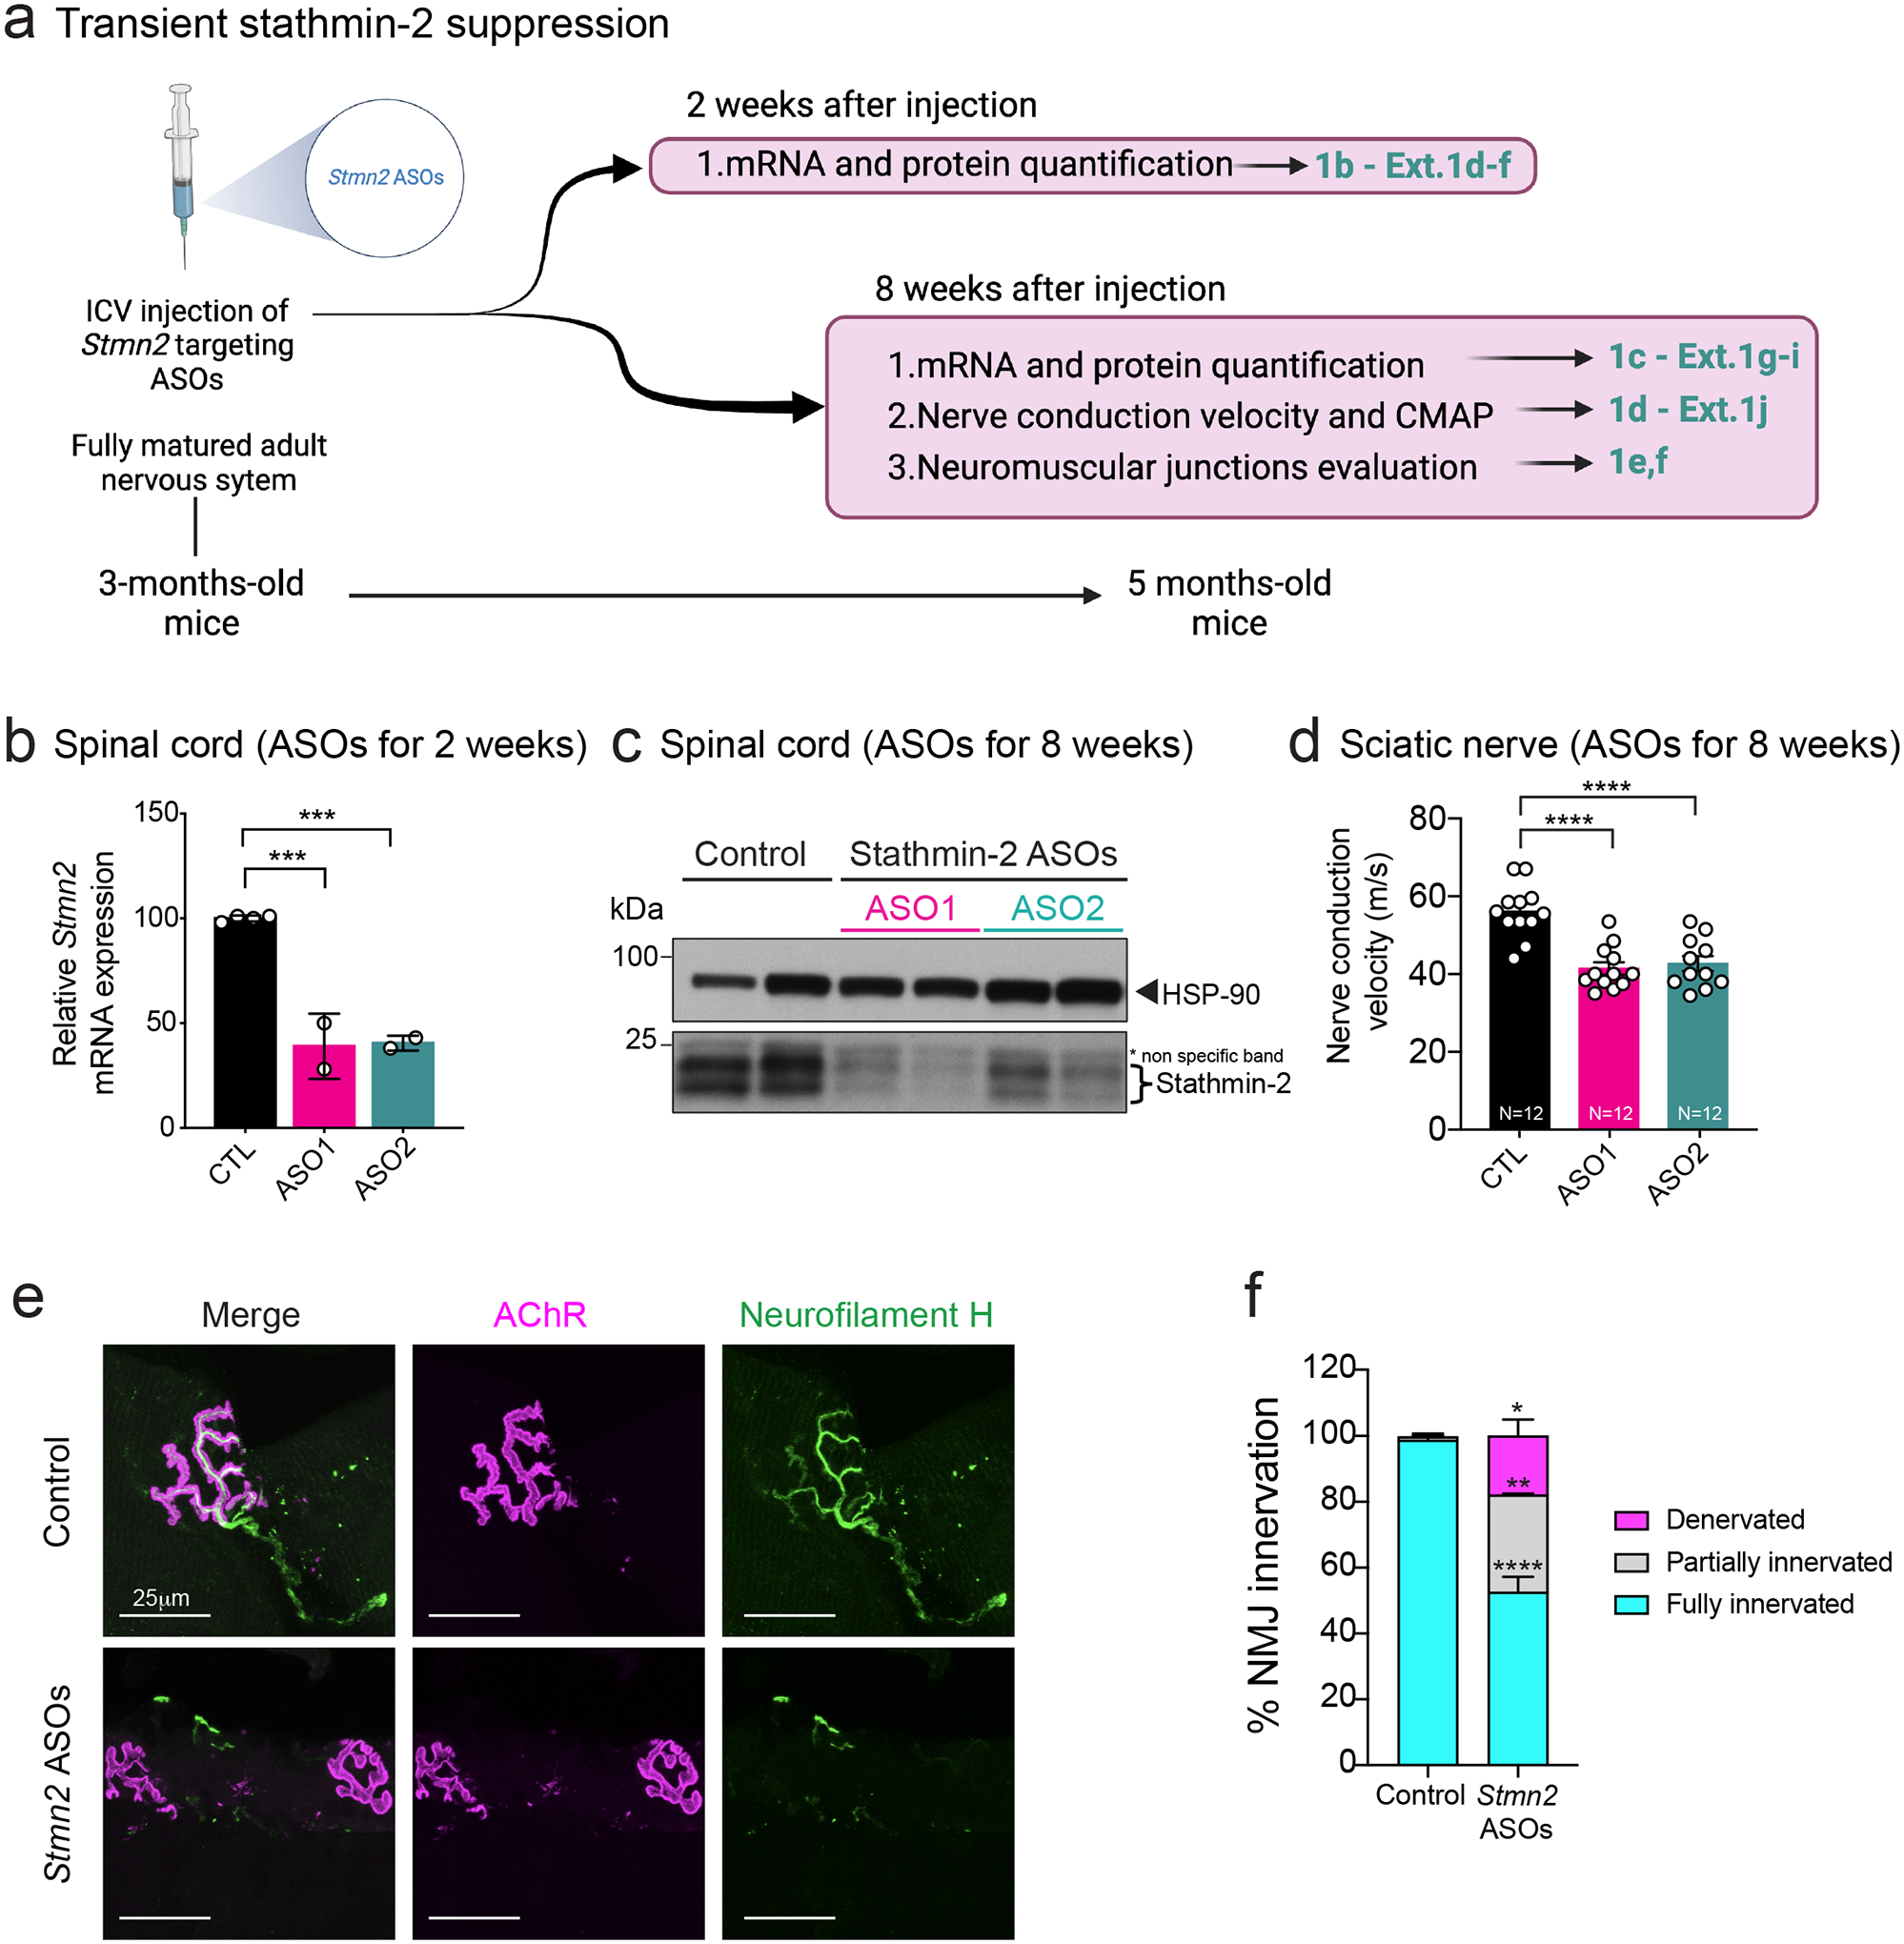
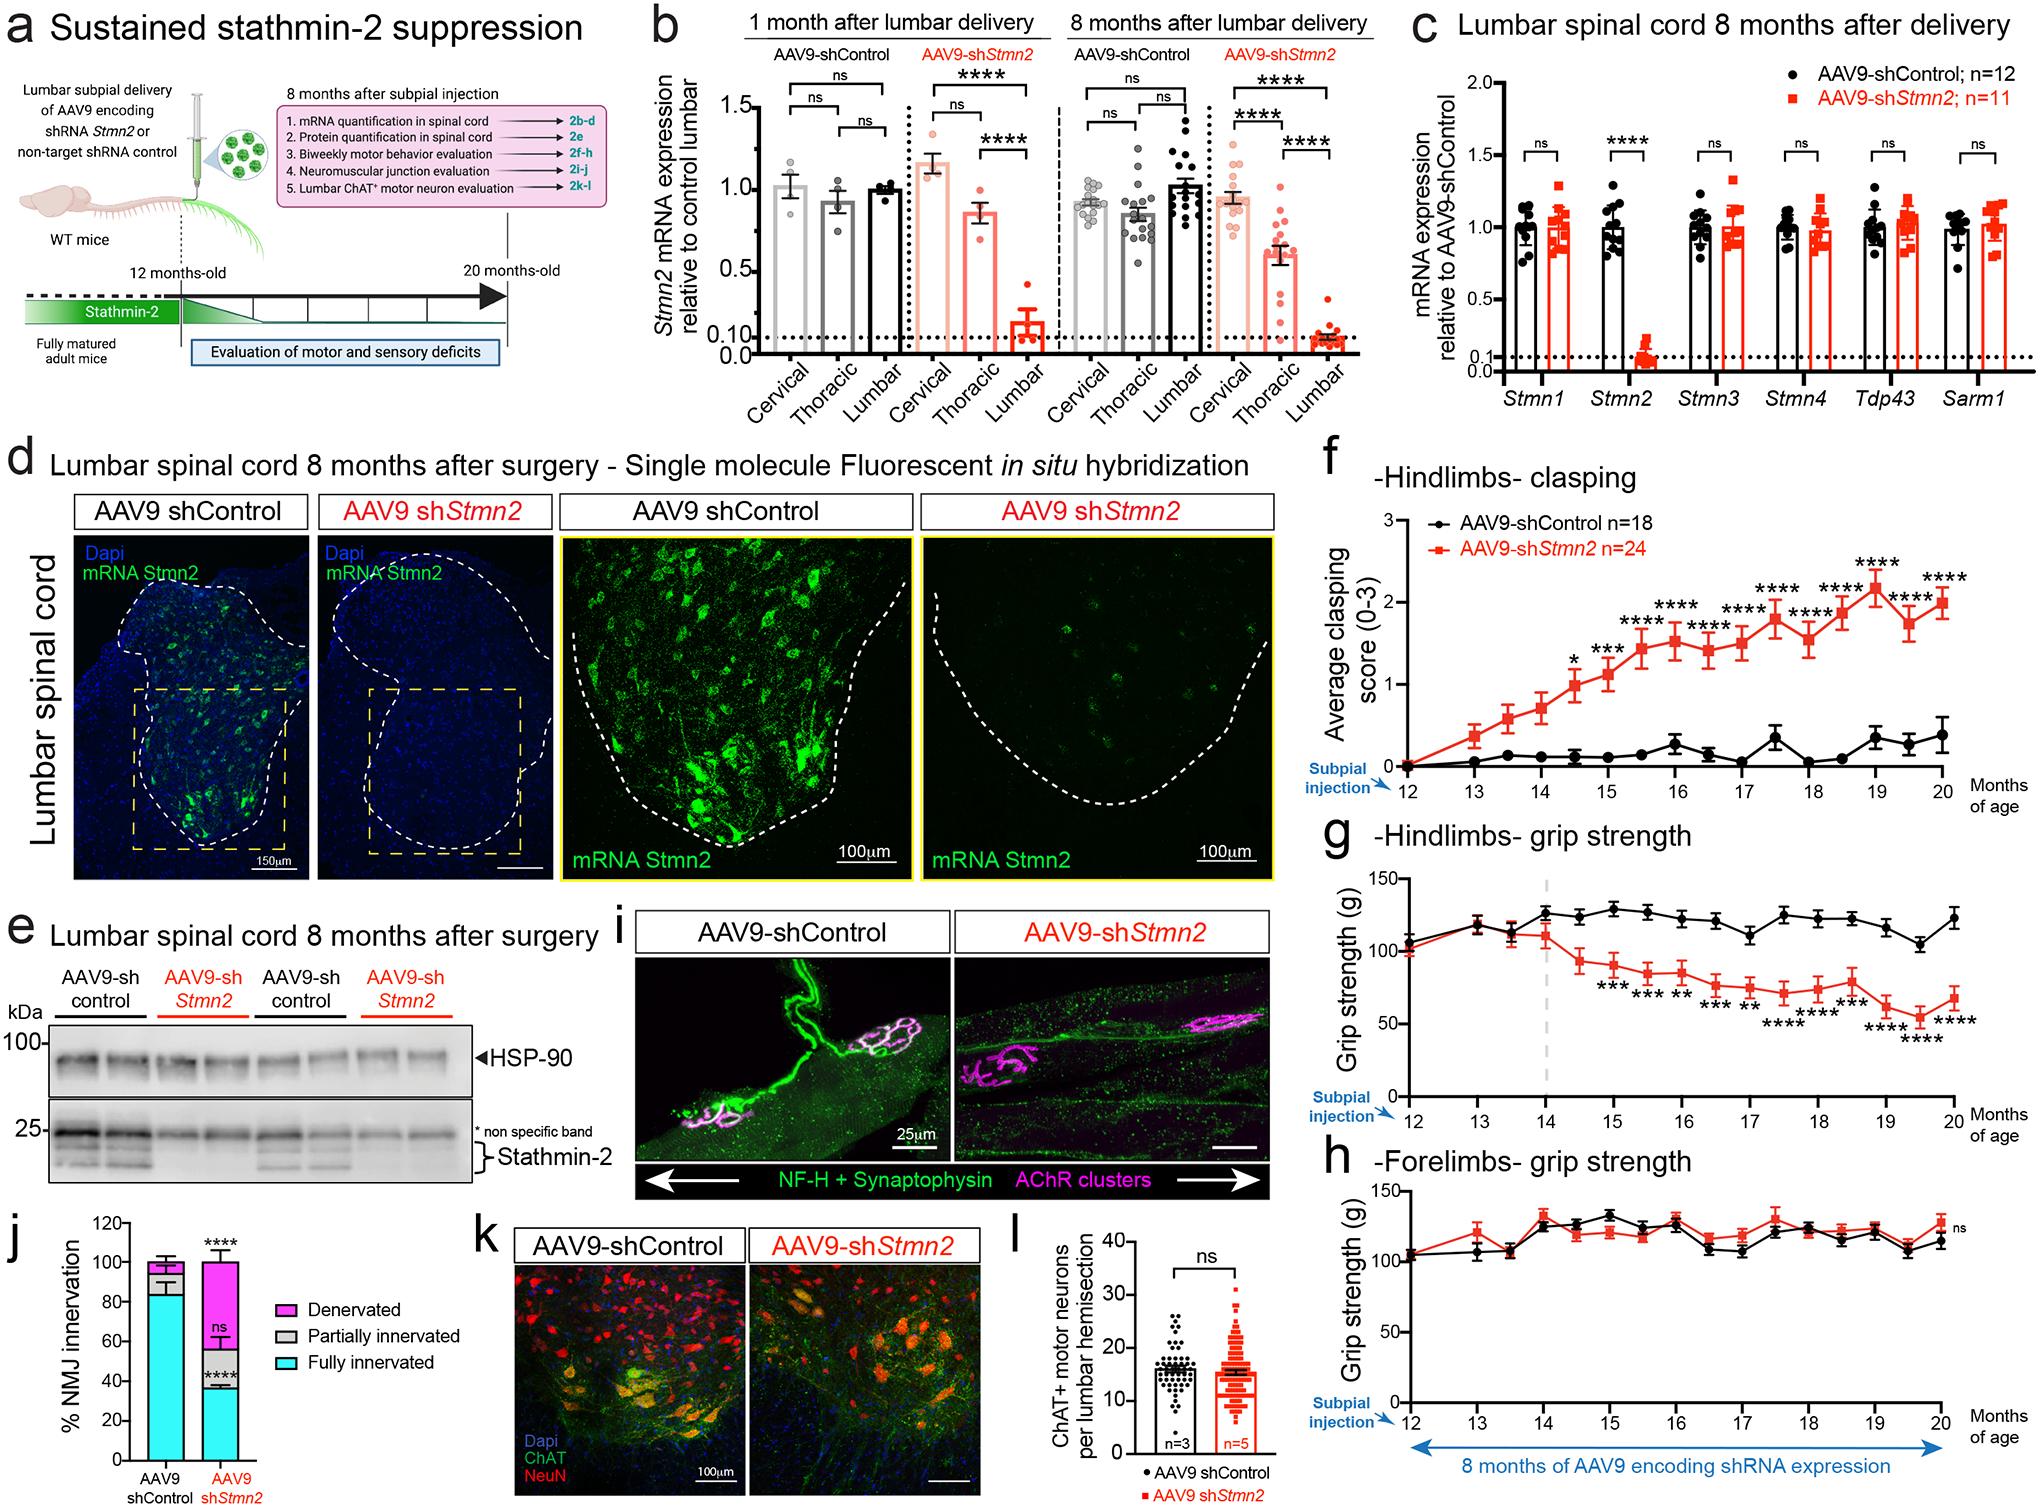
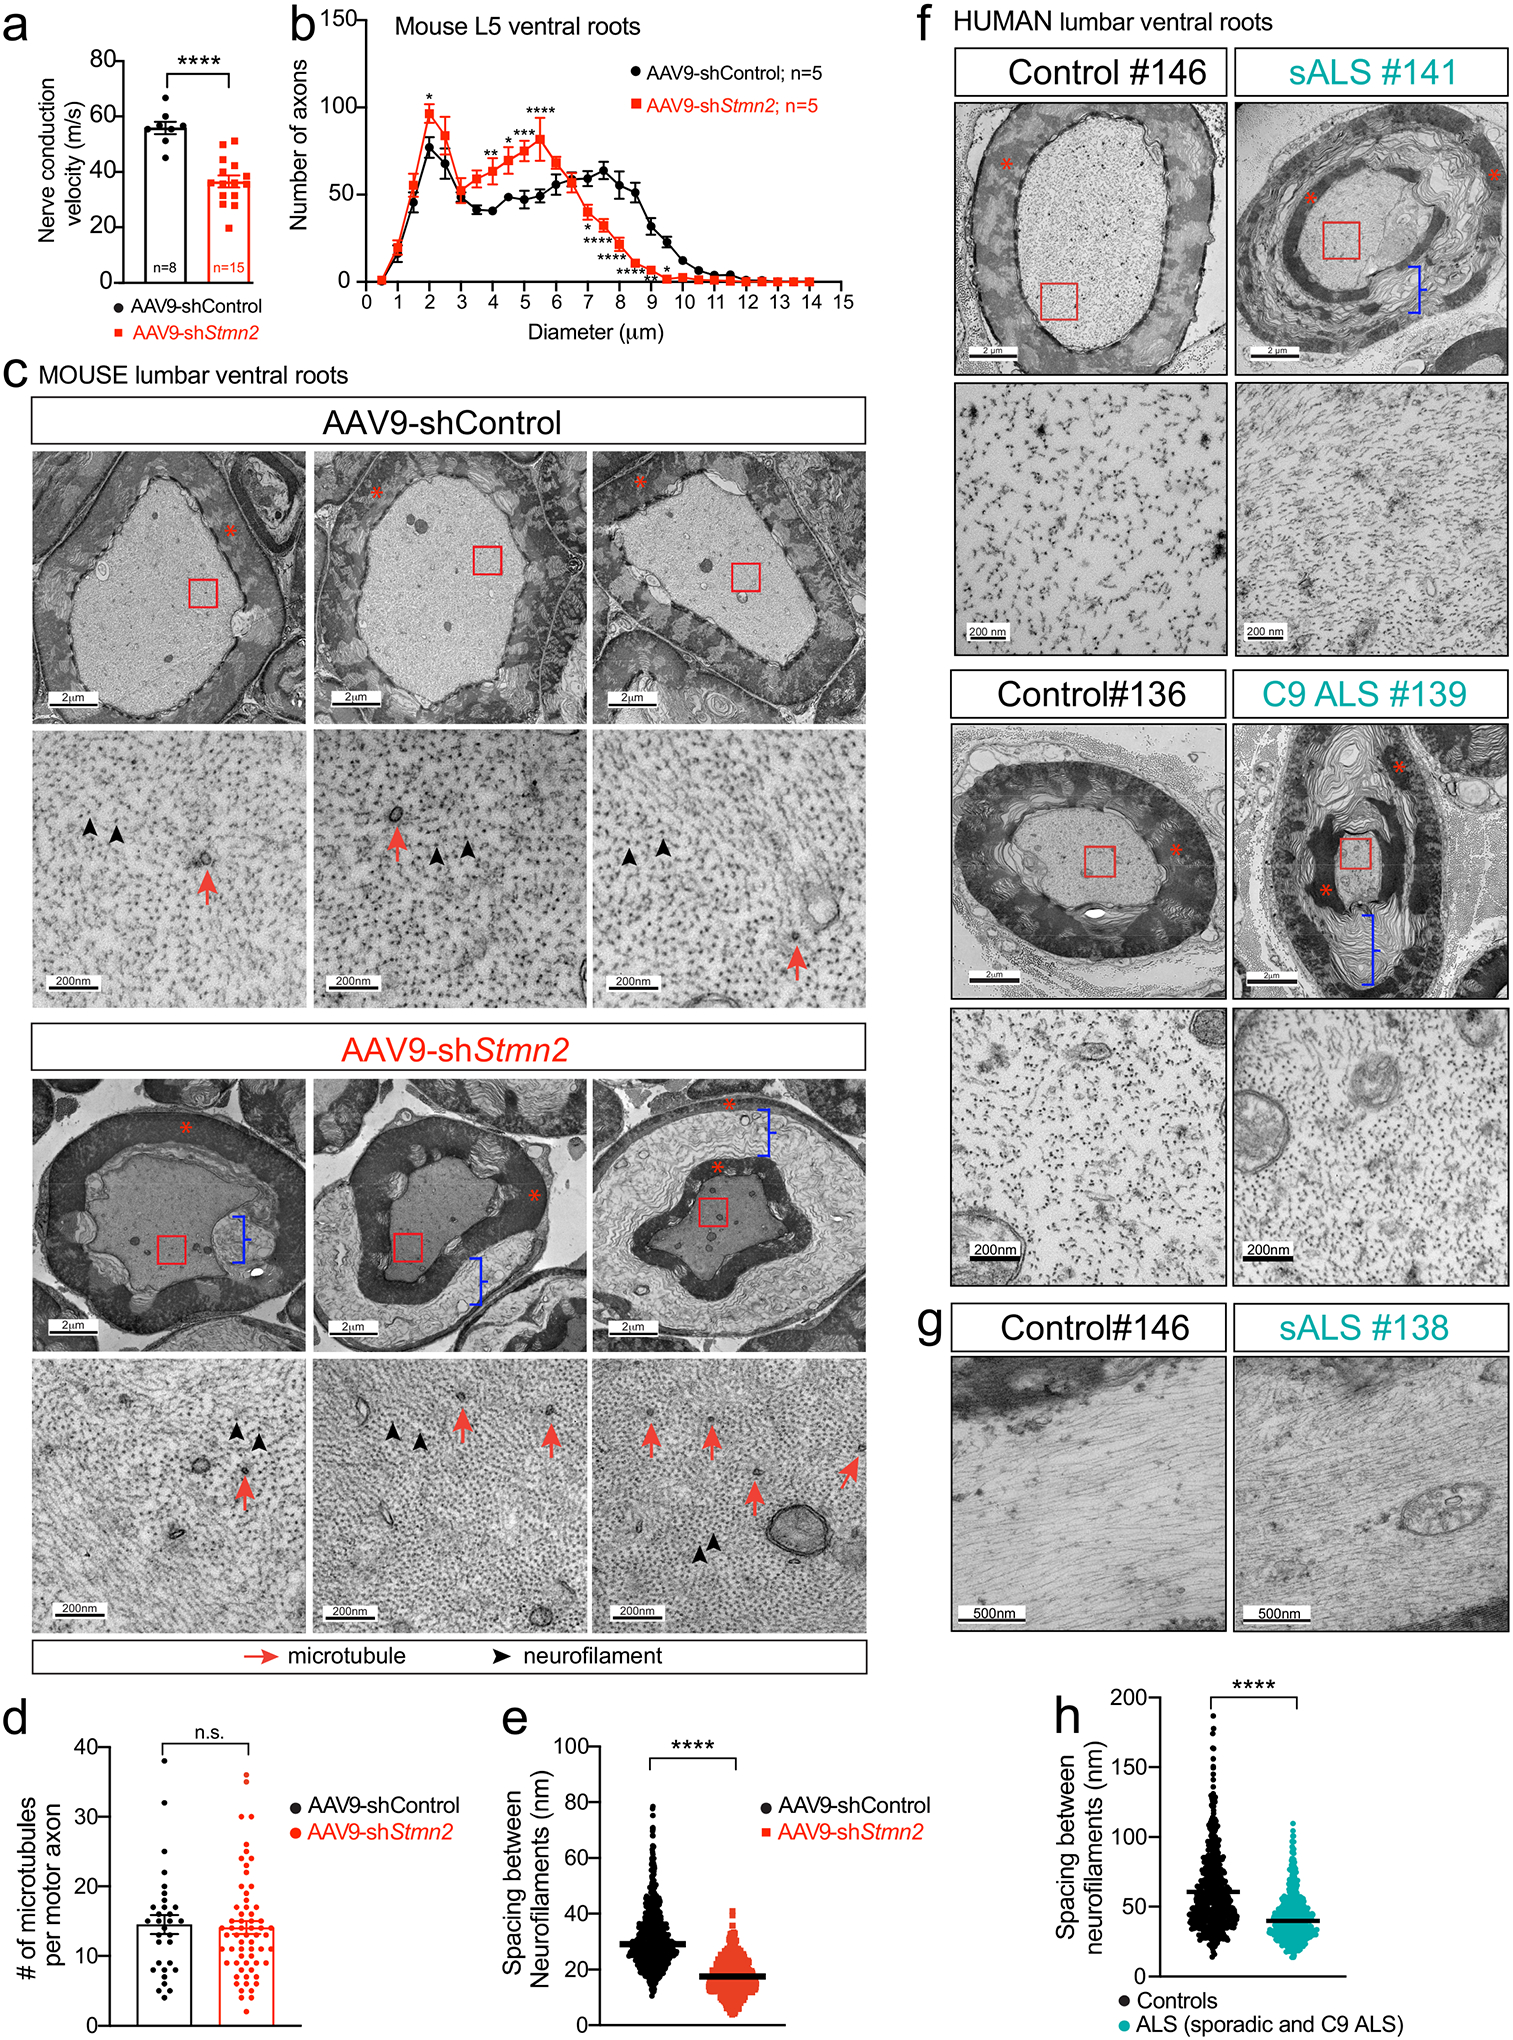
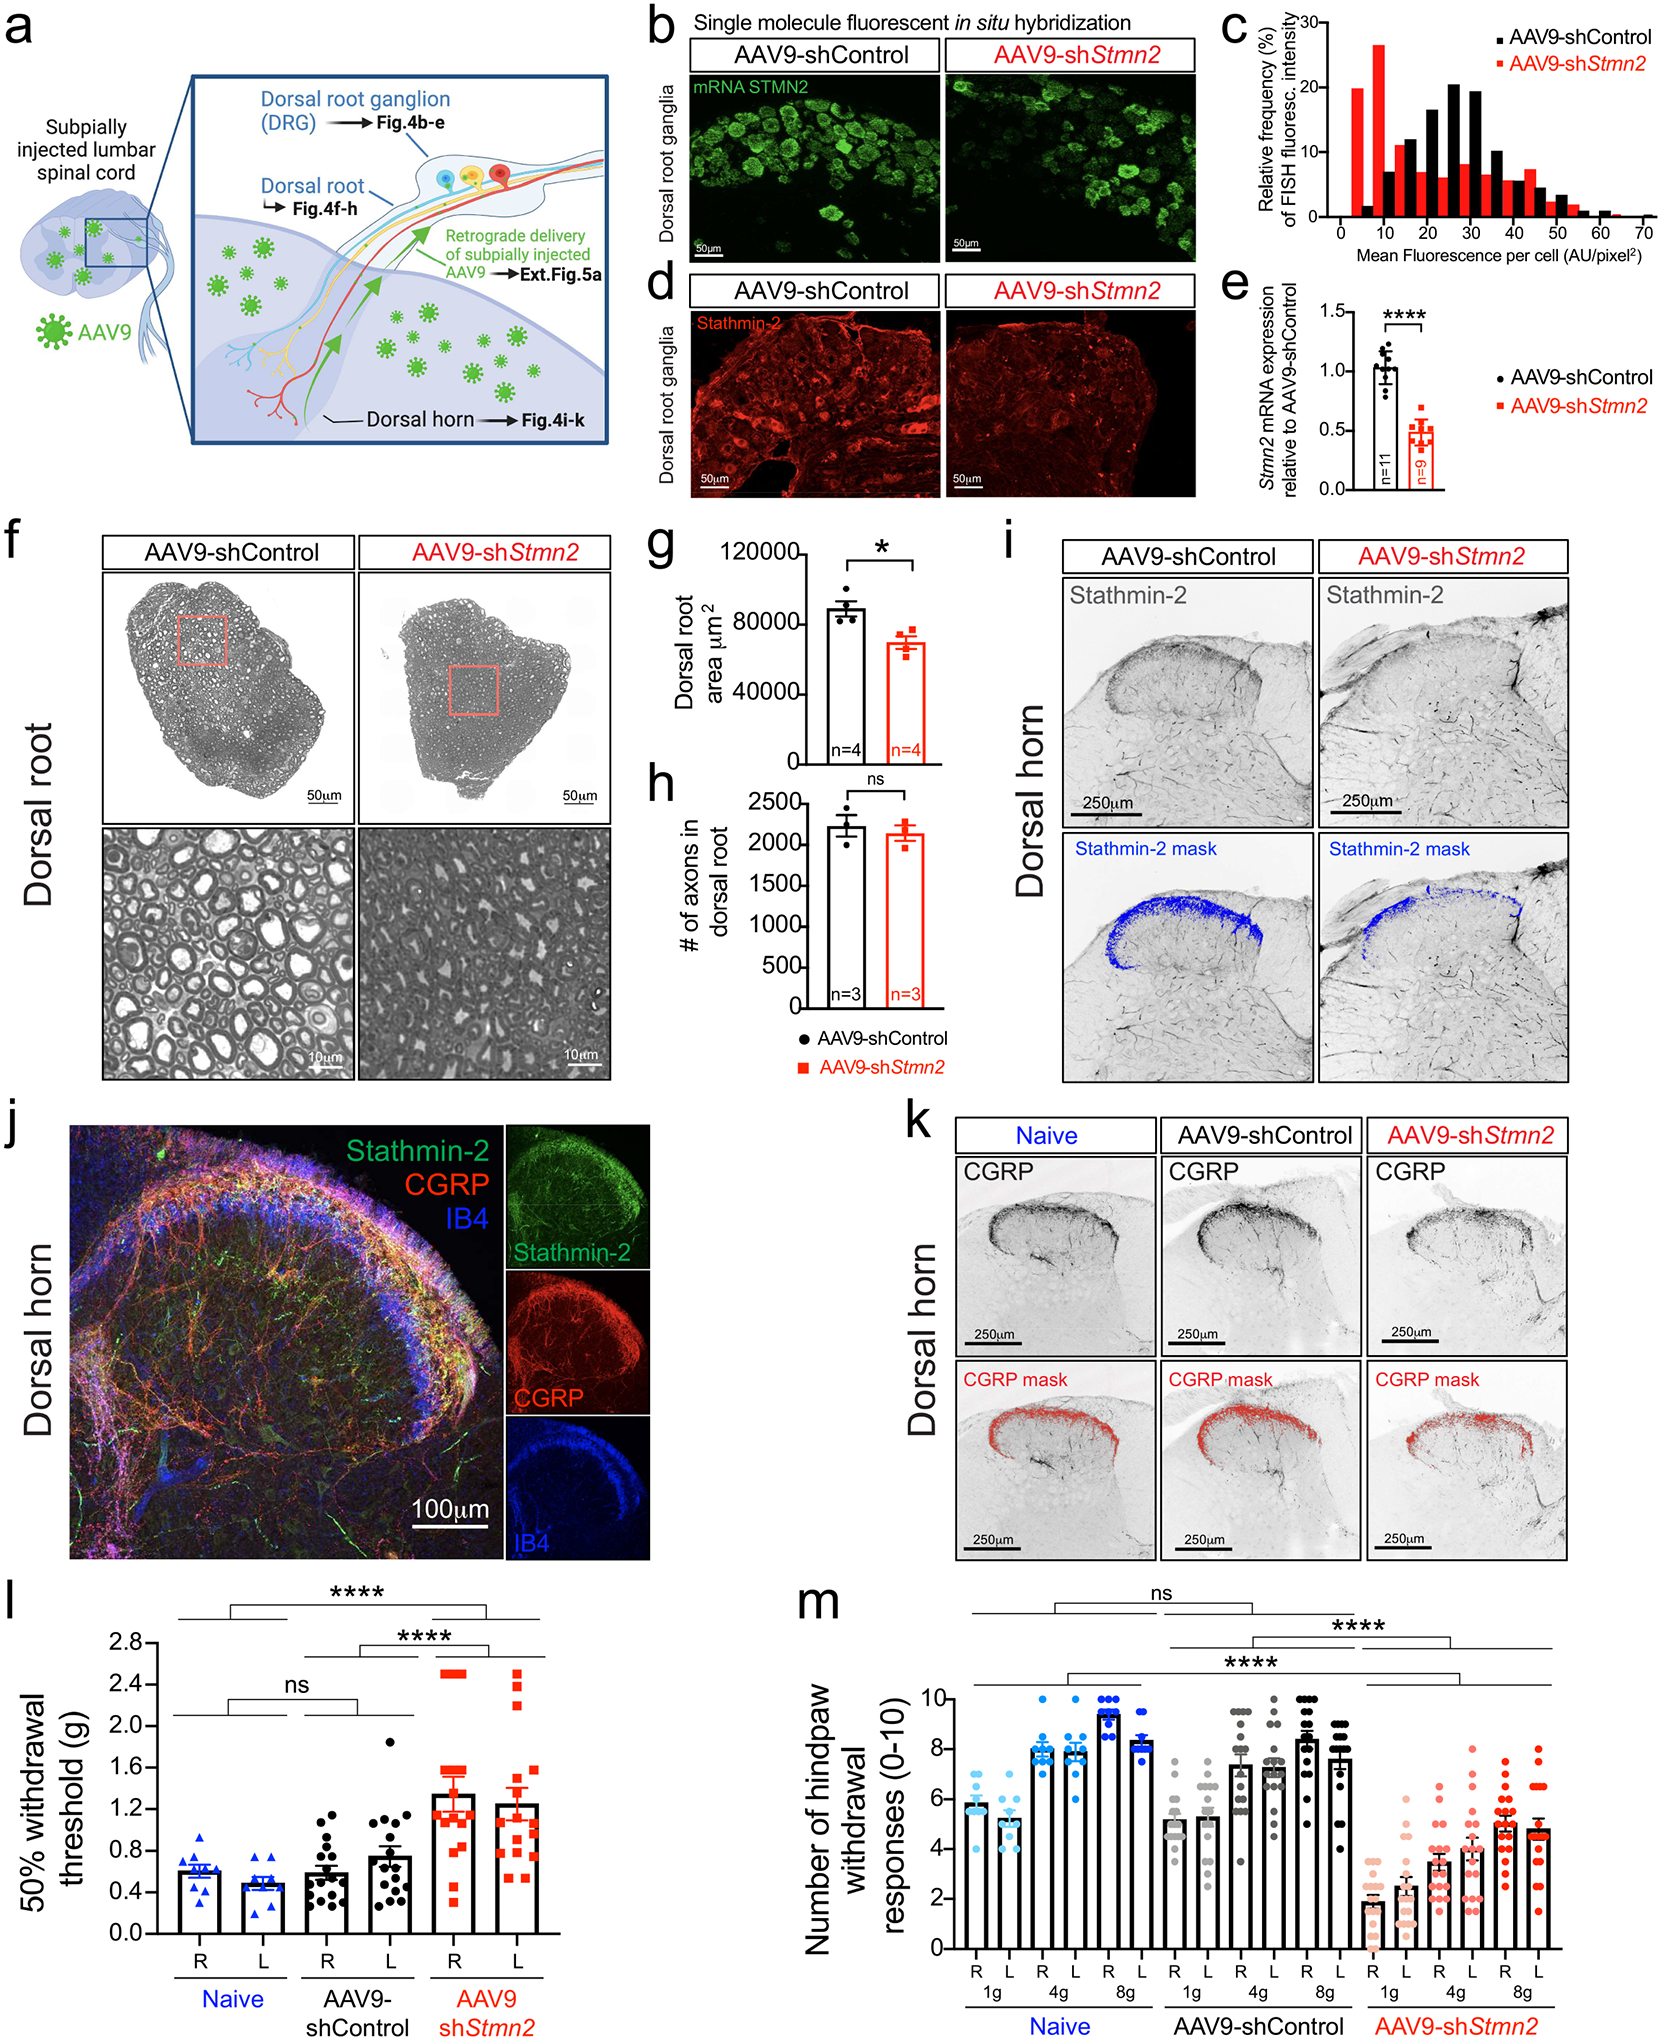
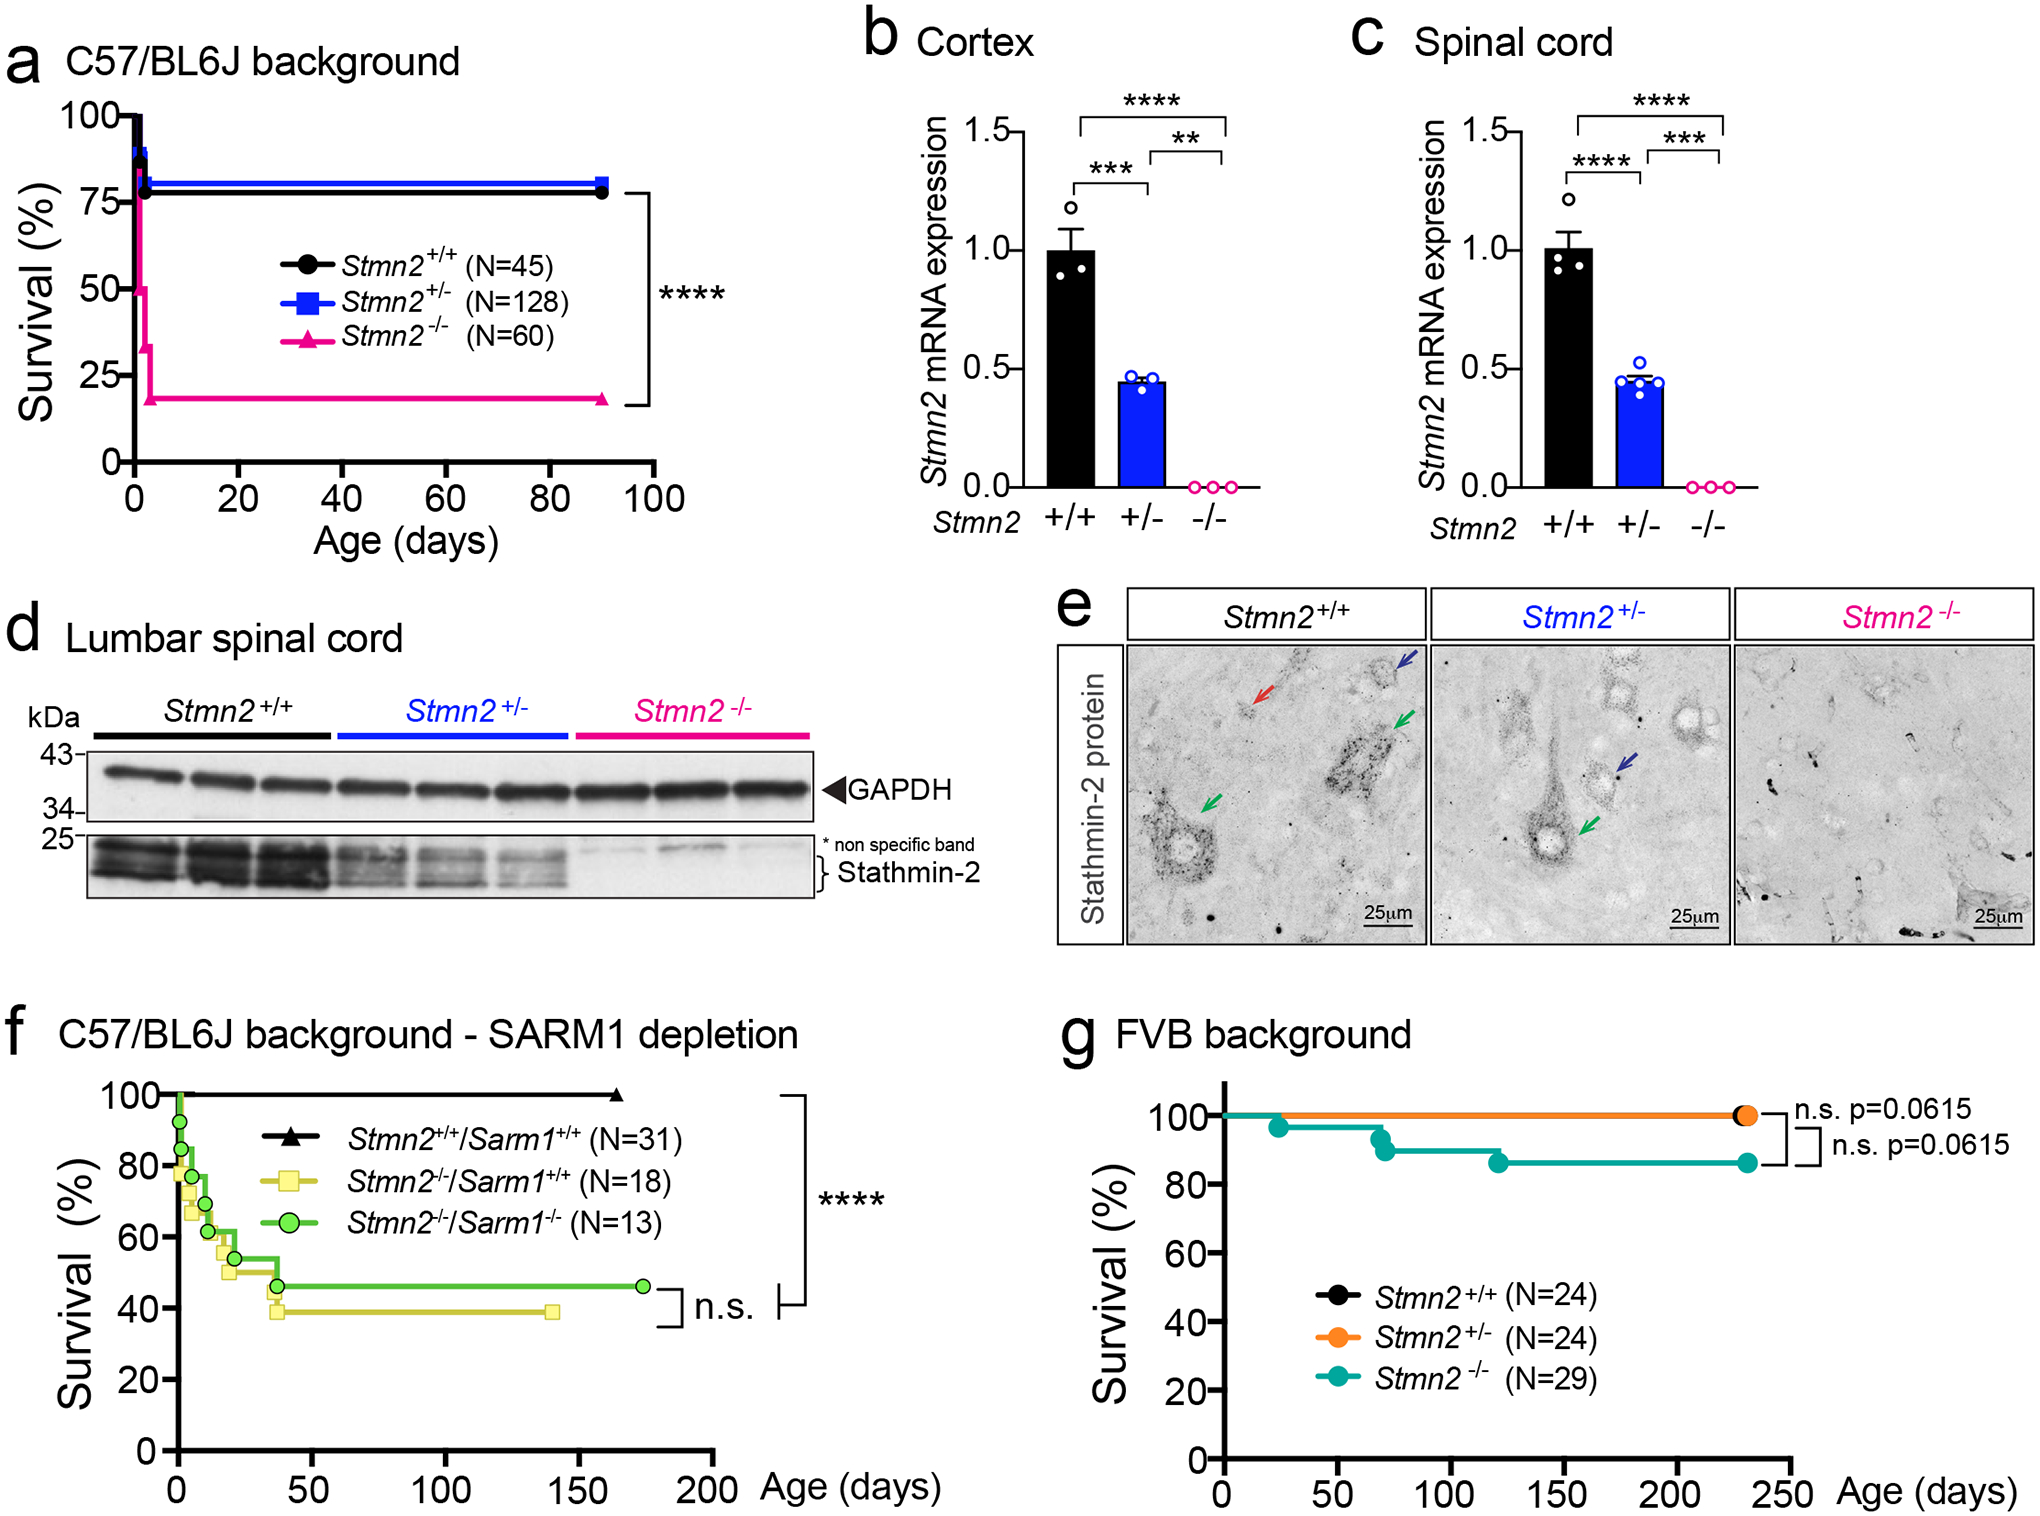
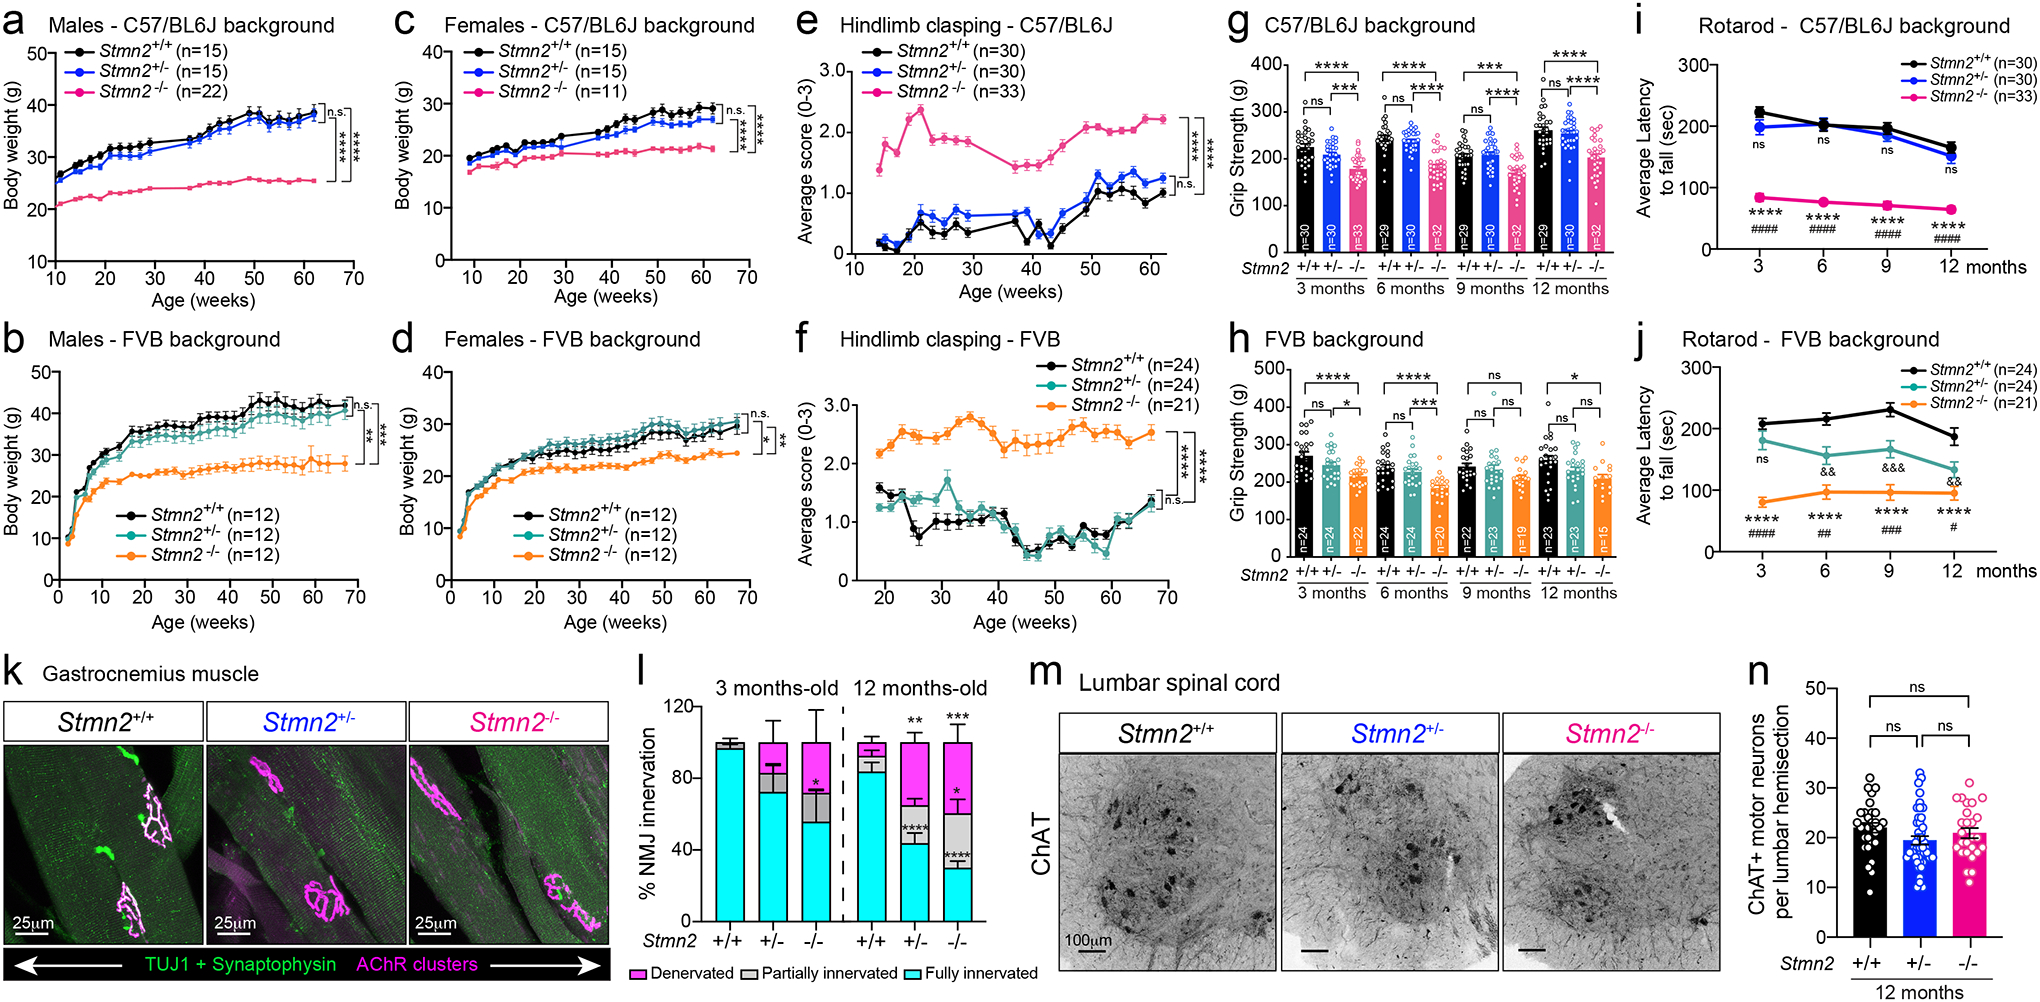
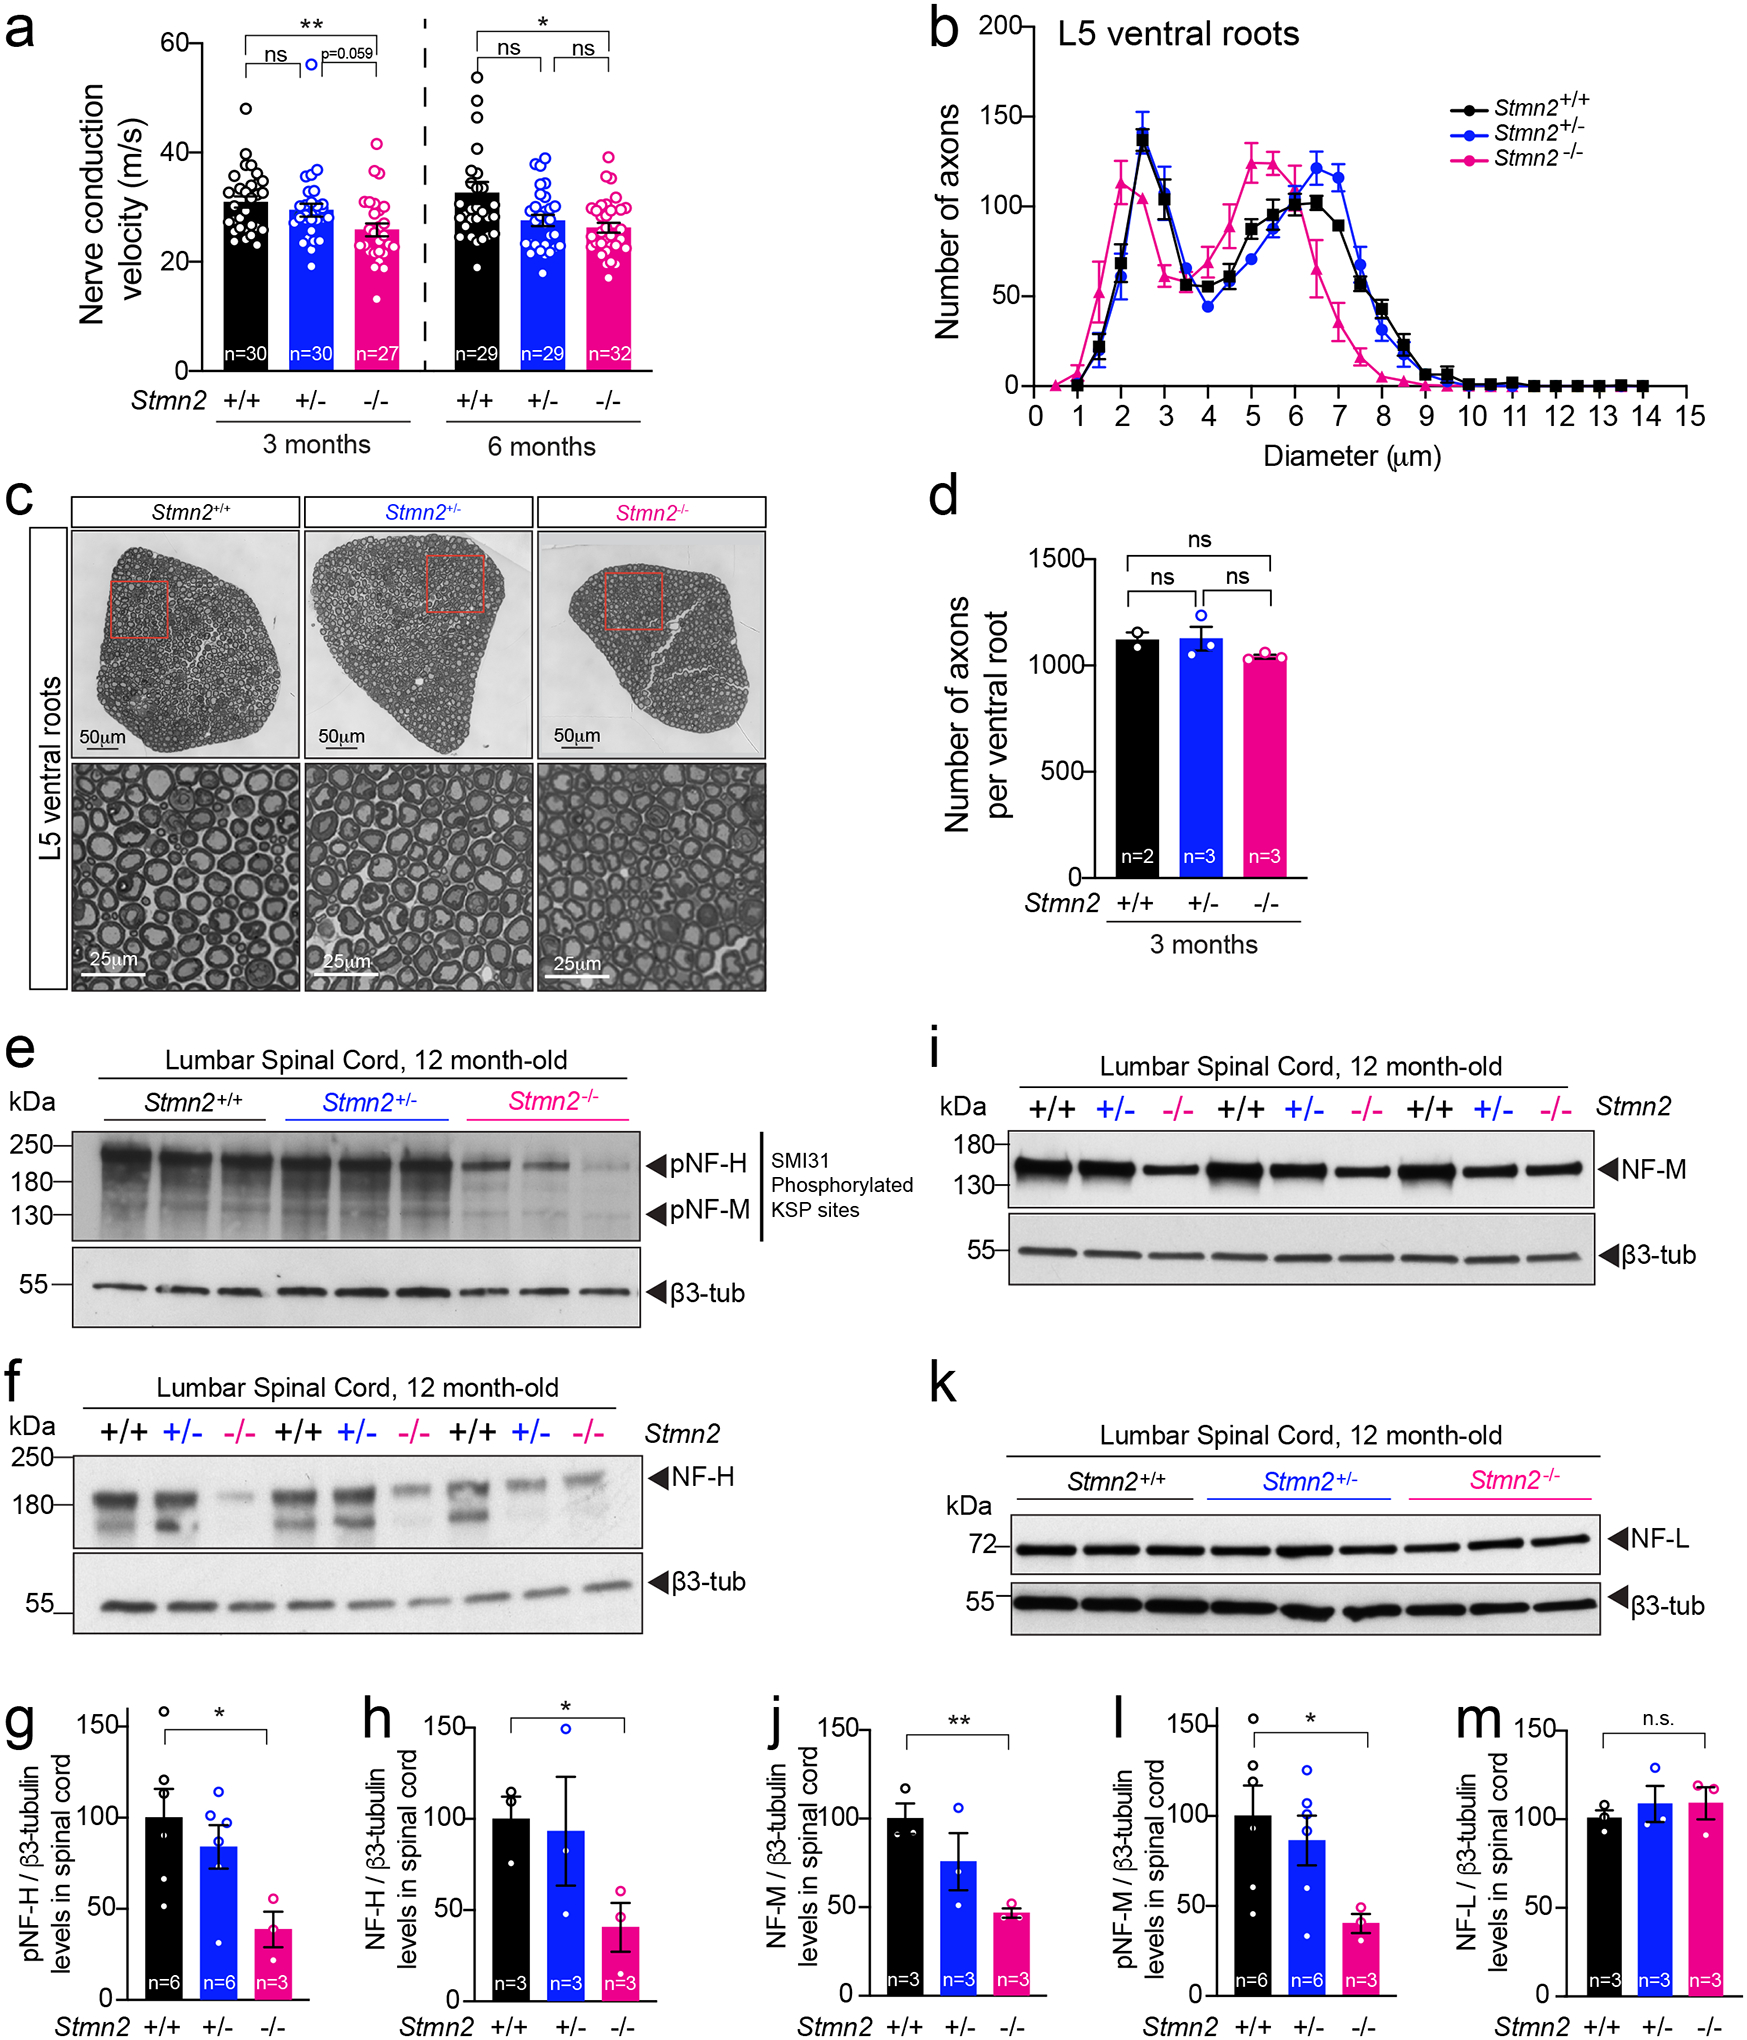
The mRNA transcript of the human STMN2 gene, encoding for stathmin-2 protein (also called SCG10), is profoundly impacted by TAR DNA-binding protein 43 (TDP-43) loss of function. The latter is a hallmark of several neurodegenerative diseases, including amyotrophic lateral sclerosis (ALS). Using a combination of approaches, including transient antisense oligonucleotide-mediated suppression, sustained shRNA-induced depletion in aging mice, and germline deletion, we show that stathmin-2 has an important role in the establishment and maintenance of neurofilament-dependent axoplasmic organization that is critical for preserving the caliber and conduction velocity of myelinated large-diameter axons. Persistent stathmin-2 loss in adult mice results in pathologies found in ALS, including reduced interneurofilament spacing, axonal caliber collapse that drives tearing within outer myelin layers, diminished conduction velocity, progressive motor and sensory deficits, and muscle denervation. These findings reinforce restoration of stathmin-2 as an attractive therapeutic approach for ALS and other TDP-43-dependent neurodegenerative diseases.


Conflict of interest statement

Competing Interests Statement

C.F.B., M.B.-H., K.L., P.J.-n., and F.R. are employees of Ionis Pharmaceuticals. D.W.C. is a consultant for Ionis Pharmaceuticals. Z.M. and D.W.C. have a relevant patent. C.L.-T serves on the scientific advisory board of SOLA Biosciences, Libra Therapeutics, Arbor Biotechnologies and Dewpoint Therapeutics and has received consultant fees from Mitsubishi Tanabe Pharma Holdings America and Applied Genetic Technologies Corporation. All other authors declare no competing interests.

Figures

Extended Data Figure 1:
Extended Data Figure 1:. Intraventricular ASO delivery efficiently reduces stathmin-2 expression in mouse cortex and spinal cord
(a-b) Stmn2 mRNA levels detected by FISH (a), and immunofluorescence confocal image immunolabeled for stathmin-2 protein (b), from 12-month-old WT mice spinal cord hemisections. Green arrows: α-motor neurons; blue arrows: γ-motor neurons; red arrows: interneurons. (c) Immunofluorescence confocal image of 12-month-old WT mice gastrocnemius muscle revealing stathmin-2 presence at the neuromuscular junction. (a-c) At least n=3 animals per condition were imaged with similar results. (d,e) Quantification of Stmn2 mRNA levels by qPCR (d) and immunoblots (e) showing stathmin-2 protein levels in mice cortex 2 weeks after the ICV injection of non-targeting (n=4 animals) or Stmn2 targeting ASOs (n=2 animals/per ASO). HSP-90 was used as a loading control in the immunoblotting. Statistics by two-sided, one-way ANOVA Dunnett’s multiple comparison test (P < 0.0001). (f) Immunoblots showing stathmin-2 protein levels in mouse spinal cord 2 weeks after the ICV injection of non-targeting or Stmn2 targeting ASOs. HSP-90 was used as a loading control. *Indicates non-specific band. (g) Quantification of Stmn2 mRNA levels by qPCR in mouse spinal cord 8 weeks after the ICV injection of non-targeting (n=4 animals) or Stmn2 targeting ASOs (n=4 animals/per ASO). Gapdh was used as an endogenous control gene. *** P = 0.0002 and **** P < 0.0001 (h,i) Quantification of Stmn2 mRNA levels by qPCR, (P < 0.0001) (h), and immunoblots (i) showing stathmin-2 protein levels in mice cortex 8 weeks after the ICV injection of non-targeting (n=4 animals) or Stmn2 targeting ASOs (n=4 animals/per ASO). HSP-90 was used as a loading control in the immunoblotting. Gapdh was used as an endogenous control gene. (j) Compound muscle action potential (CMAP) measurements in muscles of WT mice treated with non-targeting (n=4 animals) or Stmn2 targeting ASOs (n=4 animals/per ASO) for 8 weeks. (g,h,j) Statistics by two-sided, one-way ANOVA Dunnett’s multiple comparison test. All panels: Each data point represents an individual mouse. Error bars plotted as SEM. ****, P <0.0001; ***, P < 0.001; **, P < 0.01; *, P <0.05; ns, P >0.05.
Extended Data Figure 2:
Extended Data Figure 2:. Sustained stathmin-2 depletion induces axonal withdrawal from neuromuscular junctions without compromising motor neuron survival
(a) Representative confocal image of gastrocnemius muscle stained for stathmin-2 (blue), muscle AChR clusters using α-bungarotoxin (red), direct imaging of clover in the 488-wavelength (green) representing viral expression, and neurofilament-H (white). At least n=3 animals were imaged with similar results. (b) Representative image of lumbar spinal cord of non-injected (left) and 2 months after subpial injection with AAV9 expressing green fluorescent protein (GFP) (right) with the respective high magnification images of the ventral spinal cord regions, below each panel. At least n=3 animals were imaged with similar results. (c) Measurement in lumbar spinal cord segments at 8-months post injection of control or Stmn2 targeting AAV9 of potential off-target genes by qRT-PCR. N=12 animals with AAV9-shControl and n=11 animals with AAV9-shStmn2. Gapdh was used as an endogenous control gene. Statistics by two-sided, unpaired t-tests. (d) Immunoblots to determine stathmin-2 protein level in mouse lumbar spinal cord 1-month after subpial injection of a Stmn2 reducing AAV9 or control shRNA. HSP-90 was used as a loading control. *Indicates non-specific band. (e) Mouse lumbar spinal cord immunofluorescence micrographs visualized with stathmin-2 antibody 8 months after subpial injection into the lumbar spinal cord of non-targeting control or Stmn2-reducing AAV9. (f) Bi-weekly measurements of mouse body weight after subpial injection of AAV9 encoding either non-targeting or Stmn2-targeting shRNA. Statistics by two-sided, two-way ANOVA and Sidak’s multiple comparison test. (g) Representative images of entire gastrocnemius muscles from mice 8 months after subpial delivery of AAV9 encoding either a non-targeting or an Stmn2-shRNA AAV9. (h-j) Representative immunofluorescence images of mouse lumbar spinal cord stained with the microglial and astrocytic markers IBA1 and GFAP (h) and quantification of microgliosis (i) and astrogliosis (j), 8 months after subpial delivery of a non-targeting control (n=4 animals) or Stmn2-targeting AAV9 shRNA (n=4 animals). Statistics by two-sided, unpaired t-tests. All panels: Each data point represents an individual mouse. Error bars plotted as SEM. ns, p>0.05.
Extended Data Figure 3:
Extended Data Figure 3:. Decreased phosphorylation of NF-M and NF-H upon sustained Stmn2 suppression
(a) Representative micrographs of motor roots and higher magnification images of ventral root motor axon morphology and diameters, 8 months after subpial injection of AAV9 encoding non-targeting or Stmn2 targeting shRNA. (b,c) Quantification of cross-sectional area (n=5 animals/condition) (b) and of the total number of axons per ventral root (n=5 animals/condition) (c). Statistical analysis by two-sided, Mann Whitney t-test, (P = 0.0079). (d,e) Levels of total neurofilament heavy (NF-H) and neurofilament light (NF-L) (f) and total neurofilament medium (NF-M) (g) analyzed by immunoblotting spinal cord extracts from WT mice 8 months after subpial injection of either AAV9 encoding a non-targeting (n=6 animals) or Stmn2 targeting shRNA (n=5 animals). β3-tubulin was used as loading control. AAV9-shRNA-mediated suppression of stathmin-2 protein levels was confirmed in all examined samples (e). (f-h) Quantification of the immunoblots in panels d,e. Statistics by two-sided, unpaired t-test. (i) Levels of phosphorylated neurofilament heavy (pNF-H) and medium (pNF-M) subunits analyzed by immunoblotting of spinal cord extracts from WT mice, 8 months after subpial AAV9 encoding a non-targeting or Stmn2 targeting shRNA. β3-tubulin was used as a loading control. (j,k) Quantification of the immunoblots from panel i. N=5 animals with AAV9-shControl and n=6 animals with AAV9-shStmn2 (j), and n=13 animals with AAV9-shControl and n=12 animals with AAV9-shStmn2, (P = 0.036) (k). Statistics by two-sided, unpaired t-test. All panels: Each data point represents an individual mouse. Error bars plotted as SEM. ****, P <0.0001; ***, P < 0.001; **, P < 0.01; *, P <0.05; ns, P >0.05.
Extended Data Figure 4:
Extended Data Figure 4:. Axonal shrinkage, collapse of neurofilament spacing, and tearing of myelin in sporadic ALS and C9-ALS
Representative electron microscopy images of large caliber axon cross sections in the motor roots of postmortem human samples from healthy controls n = 2 (upper panel) and sporadic ALS (sALS, n=5) and C9orf72 ALS patients (C9 ALS, n=2) (lower panel). Increased magnification micrographs of the axoplasm showing altered spacing between neurofilament filaments is shown.
Extended Data Figure 5
Extended Data Figure 5. Reduced stathmin-2 levels by subpial injection alters sensory marker in lumbar spinal cord:
(a) Representative image of lumbar dorsal root ganglion 2 months after subpial injection into lumbar spinal cord and subsequent retrograde delivery of AAV9 expressing green fluorescent protein (GFP). (b-c) Size distribution of axonal diameter of sensory axons innervating the dorsal spinal cord (b), and axon numbers in the 4 μm to 8 μm diameter range in the L5 dorsal root (c). Statistical analysis by two-sided, two-way ANOVA and Sidak’s multiple comparison test. P values range from P = 0.0189 to P = 0.0028. N=4 animals with AAV9-shControl and n=3 animals with AAV9-shStmn2. (d-e) Quantification related to Figure 4i,k of positive area for stathmin-2 (n=2 animals injected with AAV9-shControl and n=4 animals injected with AAV9-shStmn2, (P <0.0001) (d), and CGRP (e) in the dorsal spinal cord of age-matched non-injected naïve animals (n=5) or 8 months after subpial injection of AAV9 encoding either non-targeting sequence (n=4) or Stmn2 shRNA (n=4). P <0.0001. Statistical analysis by two-sided, Mann Whitney test (d) and Kruskal-Wallis nonparametric tests (e). All panels: Each data point represents an individual mouse. Error bars plotted as SEM. ****, P <0.0001; ***, P < 0.001; **, P < 0.01; *, P <0.05; ns, P >0.05.
Extended Data Figure 6:
Extended Data Figure 6:. Stathmin-2 related genes remain unchanged upon stathmin-2 loss
(a) Diagram of genome editing design by CRISPR-Cas9-mediated excision of mouse Stmn2 exon 3 that leads to complete absence of stathmin-2 protein. (b) Ratios of mice expected, genotyped at birth (p0) and alive at weaning age (p21) from Stmn2+/− to Stmn2+/− crossing in C57/BL6J background. (c) Stathmin-2 protein quantification from the immunoblots in Fig. 5d normalized by GAPDH level. N=6 animals per Stmn2+/+ and Stmn2+/−; n=3 animals per Stmn2−/−. Statistical analysis by two-sided, one-way ANOVA post hoc Tukey’s multiple comparison test. * P = 0.0103; * P = 0.041; *** P = 0.0003. (d,e) Measurement of mouse Stmn-1, −3 and −4 mRNA levels extracted from 12-month-old cortex (d) and spinal cord (e) of Stmn2+/+, Stmn2+/− Stmn2−/− mice. Gapdh was used as an endogenous control gene. N=3 animals per genotype (d), and n= 3–5 per genotype (e). Statistical analysis by two-sided one-way ANOVA post hoc Tukey’s multiple comparisons test. (f) Stathmin-2 protein quantification from brain and spinal cord extract of Stmn2+/+, Stmn2+/+/huSTMN2 and Stmn2−/−/huSTMN2 (BAC line 9439) by immunoblotting. N=5 animals per genotype. (g) huSTMN2 transgene copy numbers measured in BAC transgenic lines 9439 and 9446. N=6 animals per genotype. (h) Stathmin-2 protein quantification from brain and spinal cord extract of Stmn2+/+, Stmn2+/+/huSTMN2 and in Stmn2−/−/huSTMN2 (BAC line 9446) by immunoblotting. N=6 animals per genotype. (f,h) Statistical analysis by two-sided, two-way ANOVA post hoc Tukey’s multiple comparisons test, (P <0.0001). All panels: Each data point represents an individual mouse. Bar graphs represent mean values. Error bars plotted as SEM. ****, P <0.0001; ***, P < 0.001; **, P < 0.01; *, P <0.05; ns, P >0.05.
Extended Data Figure 7:
Extended Data Figure 7:. Absence of stathmin-2 results in motor deficits regardless of the genetic background
(a) Compound muscle action potential (CMAP) measurements in gastrocnemius muscle of mice. Statistics by two-sided, one-way ANOVA post hoc Tukey’s multiple comparisons test. P = 0.0131; P = 0.0252 at 3 months; P = 0.0045. (b-c) Neurofilament light (NF-L) levels in serum at different time-points in Stmn2+/+, Stmn2+/− and Stmn2−/− mice in the C57/BL6J (b) and FVB (c) backgrounds. (d-e) Phosphorylated neurofilament heavy (pNF-H) levels in serum at different time-points in Stmn2+/+, Stmn2+/− and Stmn2−/− mice in the C57/BL6J (d) and FVB (e) backgrounds. (b-e) Statistics by two-sided, two-way ANOVA post hoc Tukey’s multiple comparison test. (f) Hindlimb clasping test of Stmn2+/+/Sarm1+/+, Stmn2+/+/Sarm1−/− and Stmn2−/−/Sarm1−/− mice in C57/BL6J background for 20 weeks. Statistics by two-sided, two-way ANOVA post hoc Tukey’s multiple comparison test. **P = 0.0018; **** P <0.0001 when comparing to Stmn2+/+/Sarm1+/+. ## P = 0.0069 when comparing between Stmn2+/+/Sarm1−/− and Stmn2−/−/Sarm1−/−. (g-h) Von Frey analysis for the sensory response in hindlimbs of Stmn2+/+, Stmn2+/− and Stmn2−/− mice in C57/BL6J background at 9 and 12 month of age, (P <0.0001) (g), and in FVB background at 6, 9 and 12 month of age. P value range from P = 0.0037 to P <0.0001 (h). Statistics by two-sided, one-way ANOVA Kruskal-Wallis with Dunn’s multiple comparison test. Number of animals used were n=28 for Stmn2+/+; n=30 for Stmn2+/− and n=32 for Stmn2−/− at 9 months, and n=29 for Stmn2+/+; n=30 for Stmn2+/− and n=13 for Stmn2−/− at 12 months (g). Number of animals used were n=24 for Stmn2+/+; n=23 for Stmn2+/− and n=20 for Stmn2−/− at 6 months and 9 months; n=23 for Stmn2+/+; n=23 for Stmn2+/− and n=14 for Stmn2−/− at 12 months (h). (i) Lumbar spinal cord dorsal section of Stmn2+/+, Stmn2+/− and Stmn2−/− mice immunostained for stathmin-2 (green), CGRP (magenta) and isolectin B4 (IB4) in blue. N=3 animals/genotype were imaged. (a,g,h) Each data point represents an individual mouse. All panels: Error bars plotted as SEM. ****, P <0.0001; ***, P < 0.001; **, P < 0.01; *, P <0.05; ns, P >0.05.
Extended Data Figure 8:
Extended Data Figure 8:. Absence of stathmin-2 alters neurofilament composition over time in mice spinal cords
(a) Immunoblotting for phosphorylated neurofilament heavy (pNF-H), phosphorylated neurofilament medium (pNF-M), and neurofilament light (NF-L) analyzed on 3 and 12 months-old Stmn2+/+, Stmn2+/− and Stmn2−/− mice lumbar spinal cord protein extracts. (b) Immunoblotting for neurofilaments medium (NF-M) and stathmin-2 from Stmn2+/+, Stmn2+/− and Stmn2−/− mice lumbar spinal cord protein extracts at 3 and compared to 12 months-old. β3-tubulin was used as an endogenous protein loading control. Stathmin-2 levels of Stmn2+/+, Stmn2+/− and Stmn2−/− at ~21 kDa are also shown. (c-f) Quantifications from immunoblots for pNF-H (c), pNF-M (d), NF-L (e) and NF-M (f) are shown. N=3 animals per genotype were used for 3 months, and n=6 animals for Stmn2+/+ and Stmn2+/− and n=3 animals for Stmn2−/− were used for 12 months. β3-tubulin remained unchanged confirming amount of protein loading control. Statistical analysis by two-sided, unpaired t-test. Each data point represents an individual mouse. Error bars plotted as SEM. P = 0.0381 (c); P = 0.0486 (d); P = 0.0039 (f).
Figure 1:
Figure 1:. ASO-mediated transient stathmin-2 suppression reduces nerve conduction velocity and triggers muscle denervation
(a) Schematic representation of intraventricular (ICV) administration of control or Stmn2 targeting ASOs (ASO1 and ASO2) in 3-month-old wild-type mice. Figure created using Biorender. (b) Quantification of Stmn2 mRNA levels by qRT-PCR 2 weeks after ICV injection. Statistical analysis by two-sided, one-way ANOVA with Dunnett’s multiple comparison test. P = 0.0004 for both pairs. (c) Immunoblot showing stathmin-2 protein levels in mice spinal cord extracts 8 weeks after the ICV injection. Heat shock protein 90 (HSP-90) was used as a loading control. Each lane was loaded with protein extracted from a different animal. (d) Nerve conduction velocity measurement in mice hindlimbs 8 weeks after ICV injection of ASOs. Statistical analysis by two-sided, one-way ANOVA Tukey’s multiple comparisons test. N=12 animals per condition. P < 0.0001 for both pairs. (e-f) Representative confocal images (e) and innervation rate quantification (f) of neuromuscular junctions (NMJs) in the gastrocnemius muscle 8 weeks after delivery of non-targeting or Stmn2 targeting ASOs. At least n=3 animals and 250 NMJs were analyzed per condition. Statistical analysis by two-sided, two-way ANOVA followed by Sidak’s multiple comparisons test. Fully innervated P <0.0001; partially innervated P = 0.0012; denervated P = 0.0144. All panels: Data points represent individual mice. Error bars plotted as SEM. ****, p <0.0001; ***, p < 0.001; **, p < 0.01; *, p <0.05; ns, p>0.05.
Figure 2:
Figure 2:. Focal, chronic, and selective suppression of stathmin-2 by subpial delivery of AAV9 shStmn2 in lumbar spinal cord results in motor deficits
(a) Schematic of experiments evaluating sustained stathmin-2 depletion by AAV9-delivered shRNA subpially delivered into 12-month-old adult wildtype mice. Figure created using Biorender. (b) Measurement of Stmn2 mRNA expression by qRT-PCR in mice after subpial delivery of AAV9-shControl or AAV9-shStmn2 across cervical, thoracic, and lumbar segments at 1- and 8-months post-administration. Statistics by two-sided, one-way ANOVA with Tukey’s multiple comparisons correction. N=4 animals/condition at 1 month. N=18 animals with AAV9-shControl and n=17 animals with AAV9-shStmn2 at 8 months. P < 0.0001. (c) Measurement of mRNA expression for a panel of genes by qRT-PCR in lumbar spinal cord 8 months post-injection of AAV9-shRNAs. Statistics by two-sided, unpaired t-tests. P < 0.0001. (b,c) Gapdh used as an endogenous control gene. Each data point represents an individual mouse. (d) Stmn2 mRNA levels detected by single molecule FISH in mice lumbar spinal cord. (e) Immunoblots of stathmin-2 protein in mice lumbar spinal cord 8 months post-administration of AAV9-shControl (n= 4 animals) or Stmn2 shRNA (n=4 animals). HSP-90 was used as a loading control. *Indicates non-specific band. Each lane was loaded with a different animal. (f-h) Longitudinal analysis of hindlimb clasping (f), grip strength (g), and forelimb grip strength (h) of AAV9-shControl (n=18) or AAV9-shStmn2 (n=24); Statistics by two-sided, two-way ANOVA and Sidak’s multiple comparisons test. p values range from * P = 0.0141 to P < 0.0001. (i) Representative confocal images of gastrocnemius muscle immunostained with synaptophysin and neurofilament-H antibodies for axon terminals (green) and α-bungarotoxin for muscle endplates (magenta), 8 months post-injection of AAV9-shControl or AAV9-shStmn2. (j) Quantification of the neuromuscular innervation status. Statistics by two-sided, two-way ANOVA and Sidak’s multiple comparisons test. N=5 animals/condition. P <0.0001. (k,l) Representative images (k) and quantification (l) of ChAT positive motor neurons at the lumbar spinal cord of mice 8 months post-administration of AAV9-shControl (n=3 animals) or AAV9-shStmn2 (n=5 animals). Statistics by Mann-Whitney’s test. All panels: Error bars plotted as SEM. ****, p <0.0001; ***, p < 0.001; **, p < 0.01; *, p <0.05; ns, p>0.05.
Figure 3:
Figure 3:. Sustained loss of stathmin-2 reduces nerve conduction velocity and provokes axonal collapse by decreasing the spacing between axonal neurofilaments
(a) Nerve conduction velocity on 20-month-old WT mice 8-months after lumbar subpial delivery of control or Stmn2 shRNAs. Each data point represents an individual mouse. Statistics by two-sided, unpaired t-tests. P <0.0001. (b) Size distribution of motor axon diameters in L5 motor roots 8-months post-injection of AAV9-shControl or AAV9-shStmn2. Statistics by two-sided, two-way ANOVA and Sidak’s multiple comparisons test. p values range from * P = 0.0426 to P < 0.0001. (c) (Top) Representative electron microscopy images of large caliber axons in ventral motor roots after subpial AAV9-shStmn2 injection reveal tearing within myelin layers. Higher magnification images (bottom) reveal altered spacing between neurofilament filaments in WT mice 8-months post-injection of AAV9-shStmn2 when compared to AAV9-shControl. Neurofilaments (highlighted by black arrowheads) outnumber microtubules (red arrows) in axoplasm of myelinated ventral axons. (d) Quantification of intra-axonal microtubules per ventral motor axon. Each data point represents an individual axon. 12–17 axons quantified per animal on n=2 AAV9-shControl and n=4 AAV9-shStmn2. Statistics by two-sided Mann Whitney t-test. (e) Quantification of intra-axonal distance between neurofilaments. At least 10 different axons were analyzed per group. N=2 animals on AAV9-shControl; n=4 animals on AAV9-shStmn2. Statistics by two-sided Mann Whitney t-test. P <0.0001 (f-g) Representative electron microscopy images of cross sectional (f) and longitudinal (g) sections of large caliber axons in the motor roots of postmortem human samples from non-neurological controls, sporadic ALS (sALS) and C9 ALS patients. Teared myelin layers are present in sALS and C9 ALS patients’ axons. Increased magnification micrographs of the axoplasm showing altered spacing between neurofilament filaments. (h) Quantification of the distance between neurofilaments in the axoplasm of human ventral roots. 8 different axons per condition derived from n=2 non-neurological controls, n=2 sALS and n=1 C9 ALS patient. Statistics by two-sided Mann Whitney t-test. P <0.0001. (c,f) Red asterisks indicate compacted myelin, blue brackets indicate ripped myelin. All panels: Error bars plotted as SEM. ****, p <0.0001; ***, p < 0.001; **, p < 0.01; *, p <0.05; ns, p>0.05.
Figure 4:
Figure 4:. Reduced stathmin-2 levels in lumbar dorsal root ganglia impair hindlimb sensory system
(a) Schematic of strategy to determine the impact of subpially injected AAV9-encoded shRNAs on the neurons in the dorsal root ganglion (DRG) innervating the dorsal spinal cord. Figure created using Biorender. (b-d) Representative confocal images from at least 3 animals per condition showing Stmn2 mRNA levels by single-molecule FISH (green, b) and its fluorescence distribution (c), and stathmin-2 protein (red, d) in the lumbar DRGs 8-months post-administration of AAV9-shRNAs. (e) Quantification of Stmn2 mRNA levels in DRG at 8-months post-injection, normalized to Gapdh. Statistics by two-sided, unpaired t-tests (P < 0.0001). (f-h) Representative images of cross-sectioned dorsal roots and higher magnification images showing axonal morphology and diameter size (f), quantification of area (g), and total number of sensory axons (h), of WT mice 8 months post-injection. Statistics by two-sided, unpaired t-tests (P = 0.0142). (i) Representative dorsal horns of lumbar spinal cord sections immunolabeled with stathmin-2, highlighted in blue, 8 months post-injection. N=2 animals on AAV9-shControl and n=4 animals with AAV9-shStmn2 were imaged with similar results. (j) Representative confocal micrograph of WT dorsal horn immunostained with stathmin-2 (green), CGRP (red), and IB4 (blue). N=3 wildtype animals were immunostained with similar results. (k) Representative lumbar spinal cord dorsal horn areas immunolabeled with CGRP, highlighted in red. N=5 non-injected (naïve) 20-month-old mice, or n=4 mice 8-months after subpial administration of AAV9-shRNAs were imaged with similar results. (l-m) Quantification of the 50% withdrawal threshold upon von Frey filament-based mechanical stimuli on mice hindlimbs (m) Quantification of hind paw response to increasing von Frey filament force stimuli on mice hindlimbs (l-m) Assays performed at 20 months-of-age when non-injected (naïve; n=9), or 8-months post-administration of AAV9-shControl (n=17) and AAV9-shStmn2 (n=16). Statistics by two-sided, one-way ANOVA Kruskal-Wallis with Dunn’s multiple comparisons test. P < 0.0001. For p values between specific conditions please see Source Data for Figure 4. All panels: Each data point represents an individual mouse. Error bars plotted as SEM. ****, P <0.0001; ***, P < 0.001; **, P < 0.01; *, P <0.05; ns, P >0.05.
Figure 5:
Figure 5:. Stathmin-2 has an important role early after birth, rescued by FVB genetic background but not by Sarm1 ablation
(a) Survival curve of Stmn2+/+, Stmn2+/− and Stmn2−/− mice in a C57/BL6J background. Statistical analysis by Log-rank Mantel-Cox test (P < 0.0001) (b-c) Measurement of murine Stmn2 mRNA levels extracted from cortex (n=3 animals per genotype) (b), and spinal cord (c) of Stmn2+/+, Stmn2+/− and Stmn2−/− mice. Each data point represents an individual mouse. Gapdh was used as an endogenous control gene. Statistical analysis by two-sided, one-way ANOVA post hoc Tukey’s multiple comparisons test. For spinal cords, n=4 animals for Stmn2+/+; n=5 animals for Stmn2+/−; and n=3 animals for Stmn2−/− were used. Range of p values from P = 0.0027 to P < 0.0001 (b) and P = 0.0002 to P < 0.0001 (c). (d) Immunoblot showing levels of the ~21 kDa mouse stathmin-2 protein from n = 3 different animals per genotype. GAPDH was used as a loading control. (e) Confocal micrographs of stathmin-2 immunolabeling at the ventral spinal cord of 12-month-old Stmn2+/+, Stmn2+/− and Stmn2−/− mice. Green arrows: α-motor neurons; blue arrows: γ-motor neurons; red arrows: interneurons. At least n = 3 different animals per genotype were imaged with similar results. (f) Survival curve of Stmn2+/+/Sarm1+/+, Stmn2−/−/Sarm1+/+ and Stmn2−/−/Sarm1−/− mice in a C57/BL6J background. Statistical analysis by Log-rank Mantel-Cox test (P < 0.0001). (g) Survival curve of Stmn2+/+, Stmn2+/− and Stmn2−/− mice in FVB background. Statistical analysis by Log-rank Mantel-Cox Test. All panels: Error bars plotted as SEM. ****, P <0.0001; ***, P < 0.001; **, P < 0.01; *, P <0.05; ns, P >0.05.
Figure 6:
Figure 6:. Absence of stathmin-2 results in motor deficits and muscle denervation without motor neuron loss
(a-b) Body weight from Stmn2+/+, Stmn2+/− and Stmn2−/− male mice in C57/BL6J (a) and FVB backgrounds (b), and (c-d) female mice in C57/BL6J (c) and FVB (d) backgrounds. (e-f) Hindlimb clasping measurements of Stmn2+/+, Stmn2+/− and Stmn2−/− mice in C57/BL6J (e) and FVB (f) backgrounds. (a-f) Each dot represents the mean value per genotype in each time-point. Statistics by two-sided, two-way ANOVA post hoc Tukey’s multiple comparisons test. (g-h) Hindlimb grip strength measurements of Stmn2+/+, Stmn2+/− and Stmn2−/− mice at 3, 6, 9, and 12 months-old in C57/BL6J (g) or FVB (h) backgrounds. Each data point represents an individual mouse. Statistics by two-sided, one-way ANOVA post hoc Tukey’s multiple comparisons. (a-h) P value range from P = 0.0496 to P < 0.0001. Specific p values for each time-point are specified in Source Data for Figure 6. (i-j) Rotarod performance of Stmn2+/+, Stmn2+/− and Stmn2−/− mice at 3, 6, 9, and 12 months in C57/BL6J (i) or FVB (j) backgrounds. Each dot represents mean values per genotype in each time-point. Statistics by two-sided, two-way ANOVA post hoc Tukey’s multiple comparisons. *, #, and & represent statistical tests performed between Stmn2+/+ and −/−; Stmn2+/− and −/−; and Stmn2+/+ and +/−, respectively. (k) Gastrocnemius muscle from 12-month-old Stmn2+/+, Stmn2+/− and Stmn2−/− mice immunolabelled with synaptophysin and β3-tubulin (Tuj1) (green) for axon terminals, and α-bungarotoxin (magenta) for muscle endplates. (l) Innervation frequency quantified using confocal microscopy at 3- and 12-months. Statistics by two-sided, two-way ANOVA post hoc Tukey’s multiple comparisons test. N=3 animals/genotype at 3 months; n=4–5 animals/genotype at 12 months. P value range from P = 0.0396 to P < 0.0001. (m) Representative lumbar spinal cord ventral sections of 12-month-old Stmn2+/+, Stmn2+/− and Stmn2−/− mice immunolabelled with ChAT. (n) Quantification of ChAT positive motor neurons per hemisections. N= 5 animals/genotype. Statistical analysis by one-way ANOVA post hoc Tukey’s multiple comparisons. All panels: Error bars plotted as SEM. ****, P <0.0001; ***, P < 0.001; **, P < 0.01; *, P <0.05; ns, P >0.05.
Figure 7:
Figure 7:. Absence of stathmin-2 reduces nerve conduction velocity and alters axonal radial growth, and neurofilament composition
(a) Nerve conduction velocity of Stmn2+/+, Stmn2+/− and Stmn2−/− at 3 and 6 month of age in the C57/BL6J background. Each data point represents an individual mouse. Corresponding n number specified in the graph. Statistics by two-sided, Kruskal-Wallis post hoc Dunn’s multiple comparisons test. P = 0.0033 and P = 0.0162 at 3 and 6 months, respectively. (b) Size distribution of motor axons in the L5 ventral motor roots of 3-month-old Stmn2+/+, Stmn2+/− and Stmn2−/− mice in the C57/BL6J background. N= 2 for Stmn2+/+; n= 3 animals/genotype for Stmn2+/− and Stmn2−/−. (c) Representative motor roots micrographs and higher magnification images from 3-month-old Stmn2+/+, Stmn2+/− and Stmn2−/− mice in the C57/BL6J background showing reduced axon diameter in Stmn2−/−. (d) Number of total axons per L5 ventral root quantified in Stmn2+/+ (n=2 animals), Stmn2+/− (n=3 animals), and Stmn2−/− (n=3 animals). Statistics by two-sided, Kruskal-Wallis post hoc Dunn’s multiple comparisons test. (e,f) Immunoblotting for phosphorylated forms of neurofilament heavy (pNF-H) and neurofilament medium (pNF-M) (e) and total neurofilament heavy (NF-H) (f) in spinal cord protein extracts of 12 months-old Stmn2+/+, Stmn2+/− and Stmn2−/− mice. (g-h) Quantifications of pNF-H, (P = 0.0381) (g), NF-H, P = 0.0307 (h), and pNF-M, (P = 0.0486) (l), normalized to the amount of β3-tubulin in (e) and (f) respectively. β3-tubulin used as loading control since it remained unchanged upon the same amount of protein loading. Each data point represents an individual mouse. Corresponding n numbers specified in the graphs. Statistics by two-sided, unpaired t-test. (i-k) Immunoblotting for neurofilament medium (NF-M) (i) and neurofilament light (NF-L) (k) in spinal cord protein extracts of 12 months-old Stmn2+/+, Stmn2+/− and Stmn2−/− mice. Quantification for NF-M, (P = 0.0039) (j), and NF-L (m) normalized to the amount of β3-tubulin are shown. Each data point represents an individual mouse. Corresponding n numbers specified in the graphs. Statistics by two-sided, unpaired t-test. All panels: Error bars plotted as SEM. ****, P <0.0001; ***, P < 0.001; **, P < 0.01; *, P <0.05; ns, P >0.05.

References

    1. Rowland LP & Shneider NA Amyotrophic lateral sclerosis. N Engl J Med 344, 1688–1700 (2001). - PubMed
    1. Cleveland DW & Rothstein JD From Charcot to Lou Gehrig: deciphering selective motor neuron death in ALS. Nat Rev Neurosci 2, 806–819 (2001). - PubMed
    1. Fischer LR, et al. Amyotrophic lateral sclerosis is a distal axonopathy: evidence in mice and man. Exp Neurol 185, 232–240 (2004). - PubMed
    1. Killian JM, Wilfong AA, Burnett L, Appel SH & Boland D Decremental motor responses to repetitive nerve stimulation in ALS. Muscle Nerve 17, 747–754 (1994). - PubMed
    1. Dengler R, et al. Amyotrophic lateral sclerosis: macro-EMG and twitch forces of single motor units. Muscle Nerve 13, 545–550 (1990). - PubMed