. 2023 Nov 23;13(1):20625.
doi: 10.1038/s41598-023-48051-2.

Quasi-BIC based all-dielectric metasurfaces for ultra-sensitive refractive index and temperature sensing

Affiliations

Quasi-BIC based all-dielectric metasurfaces for ultra-sensitive refractive index and temperature sensing

Seyedeh Bita Saadatmand et al. Sci Rep. .

Abstract

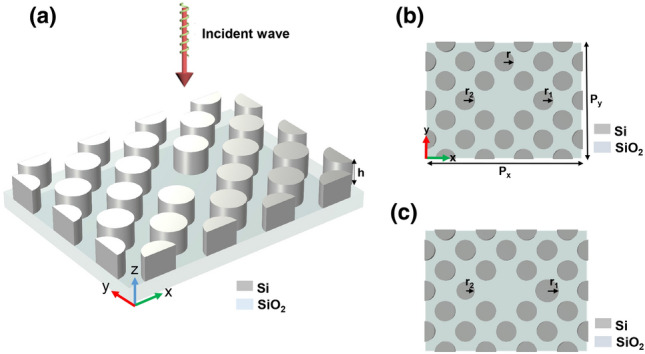
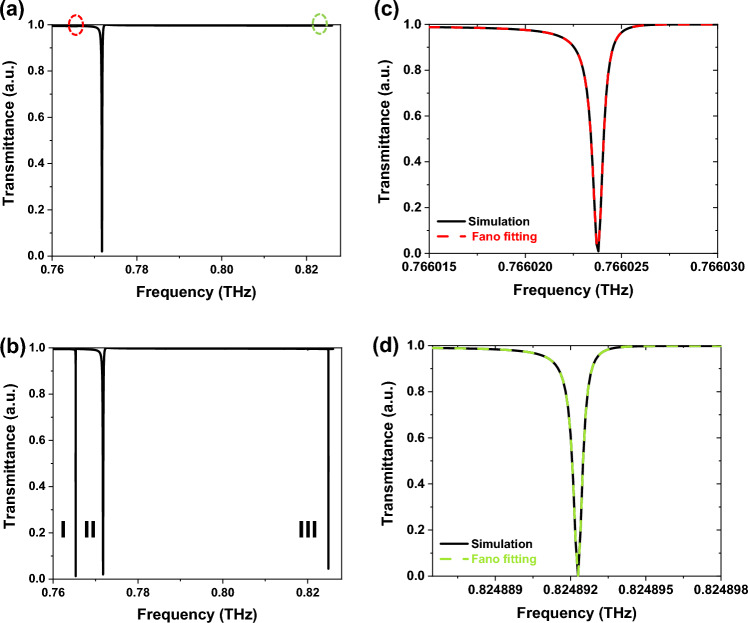
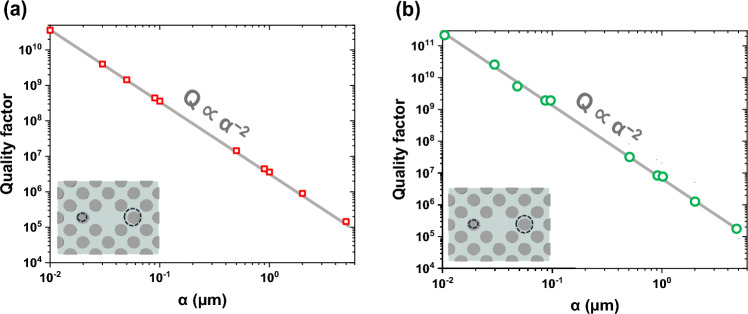
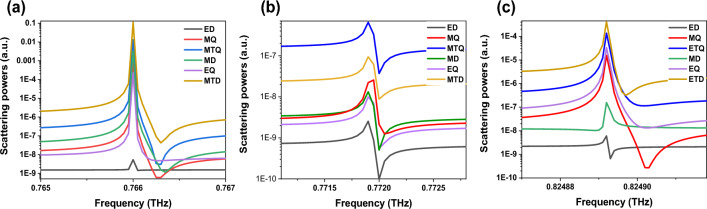
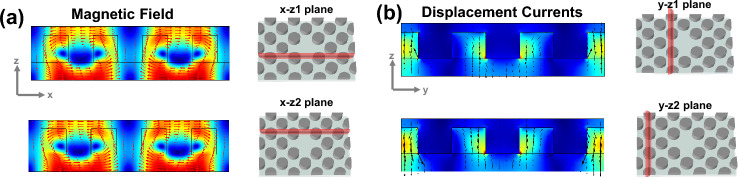
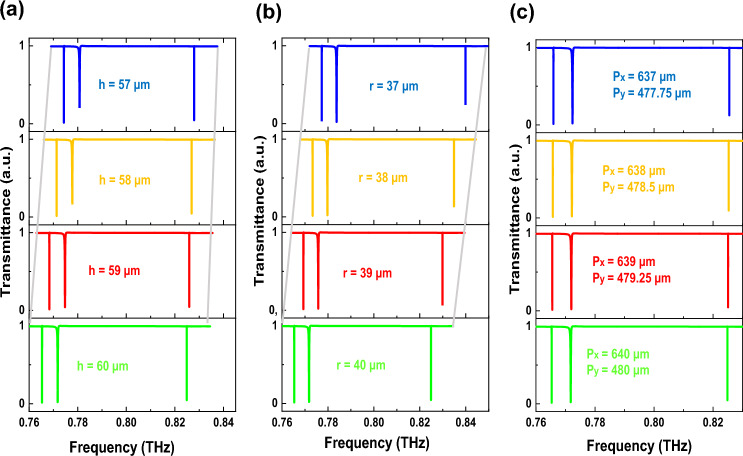
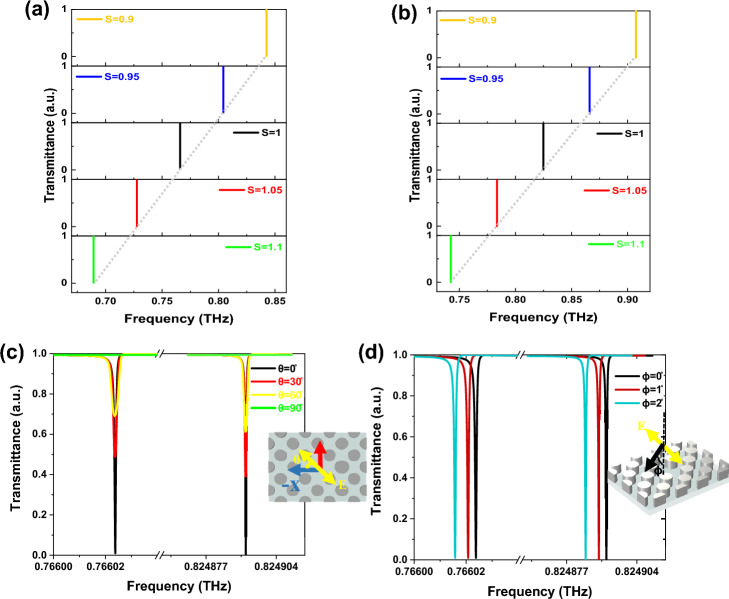
In this paper, an all-dielectric metasurface that measures refractive index and temperature using silicon disks is presented. It can simultaneously produce three resonances excited by a magnetic toroidal dipole, magnetic toroidal quadrupole, and electric toroidal dipole, in the THz region. Asymmetric structures are used to generate two quasi-bound states in the continuum (BIC) resonances with ultra-high-quality factors driven by magnetic and electric toroidal dipoles. We numerically study and show the dominant electromagnetic excitations in the three resonances through near-field analysis and cartesian multipole decomposition. The effects of geometric parameters, scaling properties, polarization angles, incident angles, and silicon losses are also investigated. The proposed metasurface is an excellent candidate for sensing due to the extremely high-quality factor of the quasi-BICs. The results demonstrate that the sensitivities for liquid and gas detection are Sl = 569.1 GHz/RIU and Sg = 529 GHz/RIU for magnetic toroidal dipole, and Sl = 532 GHz/RIU and Sg = 498.3 GHz/RIU for electric toroidal dipole, respectively. Furthermore, the sensitivity for temperature monitoring can reach up to 20.24 nm/°C. This work presents a valuable reference for developing applications in the THz region such as optical modulators, multi-channel biochemical sensing, and optical switches.


Conflict of interest statement

The authors declare no competing interests.

Figures

Figure 1
Figure 1
(a) Schematic of the proposed metastructure, (b) Symmetric, and (c) Asymmetric unit cell with the geometric parameters. Px and Py are equal to 640 µm and 480 µm, respectively. The silicon disks have a thickness of h = 60 µm and a radius of r = 40 µm.
Figure 2
Figure 2
Transmittance curves with an asymmetric parameter (a) α = 0 µm, and (b) α = 2 µm. Three modes are shown by modes I, II, and III, respectively. (c,d) Fano fitting of mode I and mode III at α = 2 µm. The simulation results are shown in solid curves, while the results of the Fano fitting are shown in dashed curves.
Figure 3
Figure 3
Quality factors of the (a) mode I, and (b) mode III for different asymmetry parameters. The red and green points are obtained by the finite element method, and the black line is fitted to show that the Q-factor and α of modes I and III follow the inverse quadratic law as Q ∝ α −2.
Figure 4
Figure 4
The scattering powers of multipole decomposition for (a) mode I, (b) mode II, and (c) mode III. MTD is dominant in mode I, MTQ is dominant in mode II, and ETD has the main contributions in mode III.
Figure 5
Figure 5
Cross-sectional patterns of displacement currents (black arrows), electric (white arrows), and magnetic (red arrows) fields in the x–y plane for the asymmetric structure for (a) mode I, (b) mode II, and (c) mode III.
Figure 6
Figure 6
(a) The magnetic field patterns in x-z1 and x-z2 planes, and (b) The displacement currents in y-z1 and y-z2 planes. The red and black arrows demonstrate the flow direction of the magnetic field and displacement currents, respectively.
Figure 7
Figure 7
Transmittance curves of the proposed structure (α = 2 μm) with various (a) heights, (b) radius, and (c) periods. Adjusting the geometrical parameters leads to tuning the resonance frequency without noticeably affecting their Q-factor.
Figure 8
Figure 8
Transmittance curves (a) under different scalable factor S for mode I, and (b) mode III. The q-BICs exhibit linear redshifts as the scalable factor slowly increases, whereas their linewidth is approximately unchanged, indicating that S can be changed to tune the resonance frequencies. (c) Transmittance curves with different incident wave polarization directions (θ = 0 to 90°). As the θ rises from 0 to 90 degrees, the transmittance dips of modes I and III slowly broaden with no wavelength shifts, and (d) Transmittance curves with different incident wave angles (ɸ = 0 to 2°). The polarization angle and incident angle directions are shown in the insets of (c) and (d). The q-BIC resonances exhibit a redshift when the incident angle ranges from 0° to 2°
Figure 9
Figure 9
(a) Transmittance spectra of the q-BIC resonances for various values of silicon losses for α = 2 µm, (b) Dependence of the Q value of the mode III on silicon losses. The transmittance spectrum is found to be nearly unaffected for k ≤ 10−8. However, further increasing the k values, progressively dampens the resonance and degrades the Q-factor due to the Si absorption effect.
Figure 10
Figure 10
(a) Illustration of the suggested metasensor. Transmittance curves versus the refractive indices of gas (refractive index variations ranging from 1 to 1.1) (b) mode I, and (c) mode III. (d) Resonance frequencies versus the surrounding’s refractive index. A redshift in the q-BIC frequencies occurs when the refractive index of the sensing medium increases.
Figure 11
Figure 11
(a) Transmittance curves of mode I for various T. (b) Wavelength shifts of mode I with various T. As the temperature rises, the resonance of mode I displays a considerable redshift.

References

    1. Fischer BM, et al. Terahertz time-domain spectroscopy and imaging of artificial RNA. Opt. Express. 2005;13(14):5205–5215. doi: 10.1364/OPEX.13.005205. - DOI - PubMed
    1. Bockelt A, López JP, Vidal B. All-fiber centralized architecture for parallel terahertz sensors. IEEE Trans. Terahertz Sci. Technol. 2014;5(1):137–144. doi: 10.1109/TTHZ.2014.2373313. - DOI
    1. Tang M, et al. Rapid and label-free metamaterial-based biosensor for fatty acid detection with terahertz time-domain spectroscopy. Spectrochim. Acta A Mol. Biomol. Spectrosc. 2020;228:117736. doi: 10.1016/j.saa.2019.117736. - DOI - PubMed
    1. Beruete M, Jáuregui-López I. Terahertz sensing based on metasurfaces. Adv. Opt. Mater. 2020;8(3):1900721. doi: 10.1002/adom.201900721. - DOI
    1. He Z, et al. Graphene-based metasurface sensing applications in terahertz band. Results Phys. 2021;21:103795. doi: 10.1016/j.rinp.2020.103795. - DOI