. 2024 Apr;8(4):427-442.
doi: 10.1038/s41551-023-01133-y. Epub 2023 Nov 23.

Immune-privileged tissues formed from immunologically cloaked mouse embryonic stem cells survive long term in allogeneic hosts

Affiliations

Immune-privileged tissues formed from immunologically cloaked mouse embryonic stem cells survive long term in allogeneic hosts

Jeffrey Harding et al. Nat Biomed Eng. 2024 Apr.

Abstract

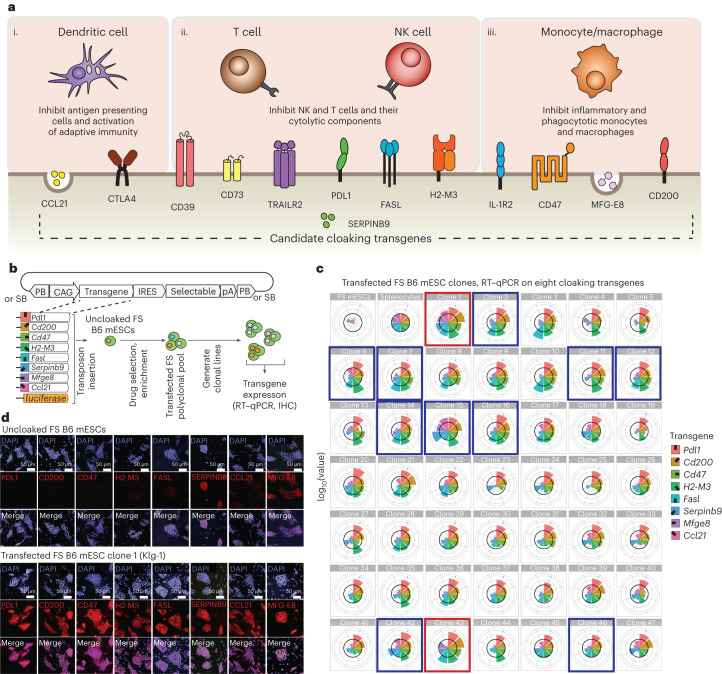
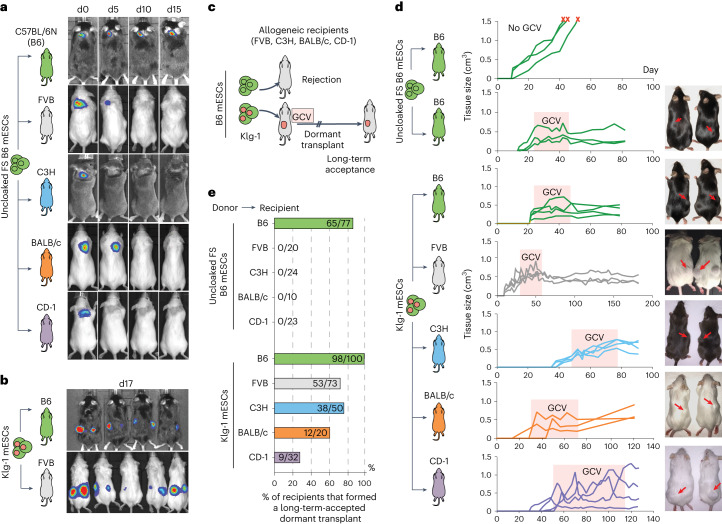
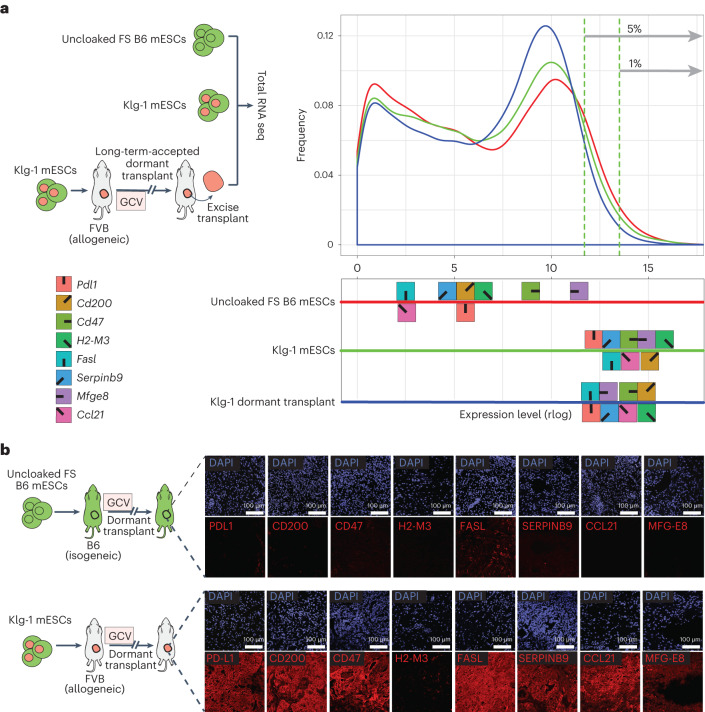
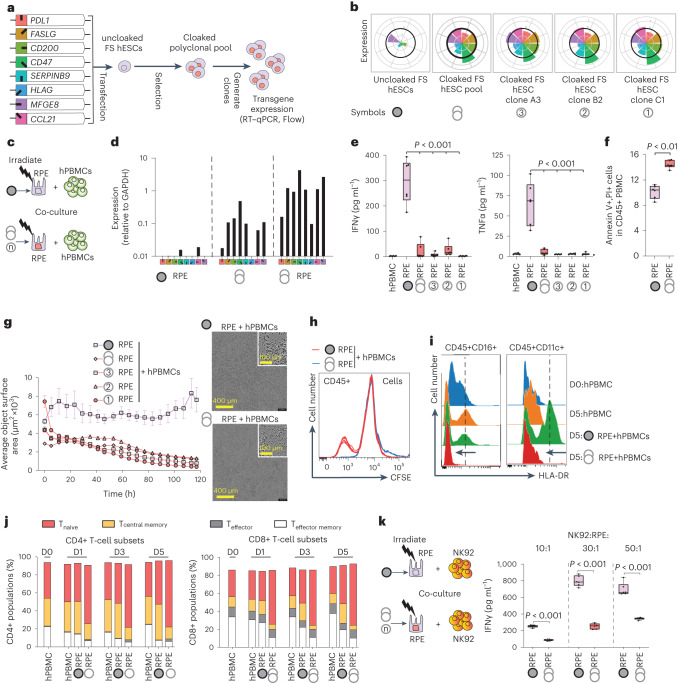
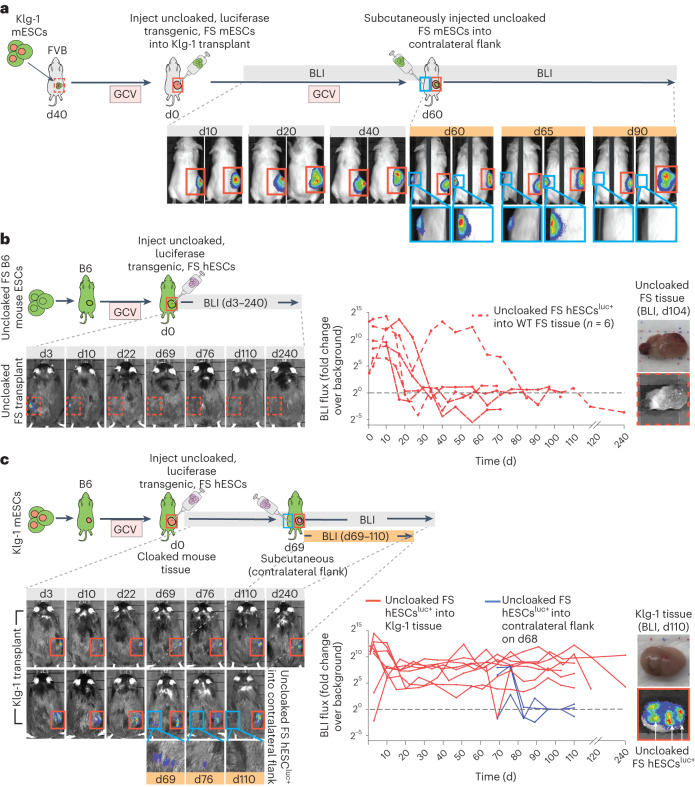
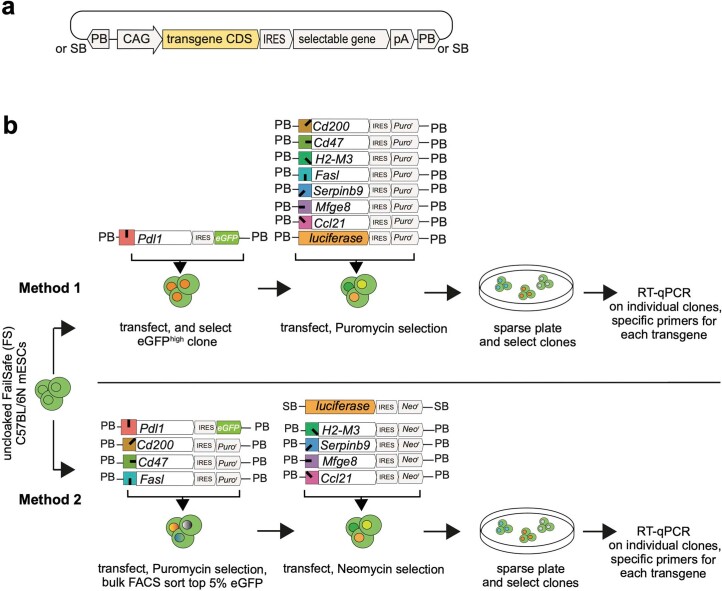
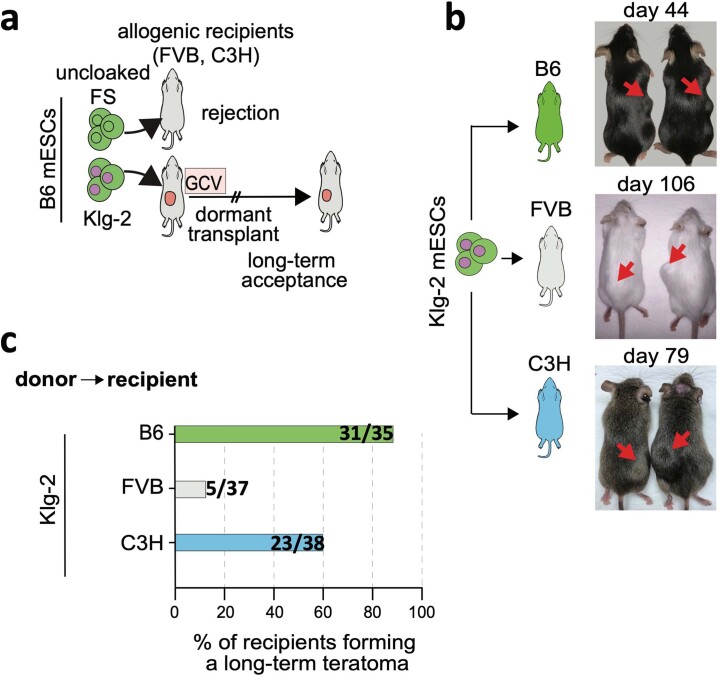
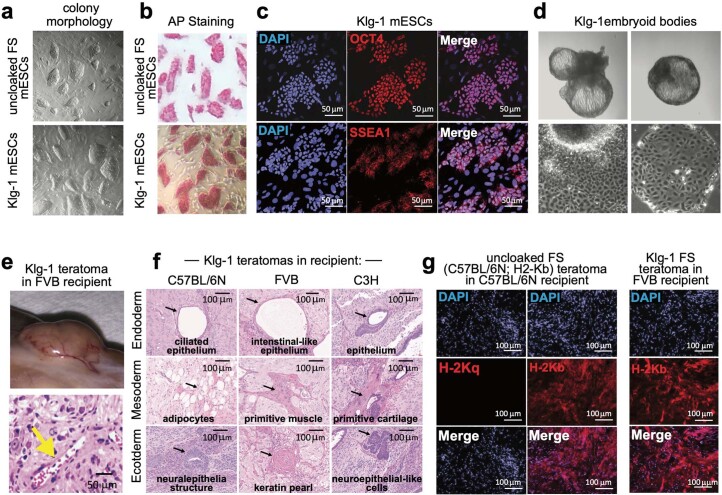
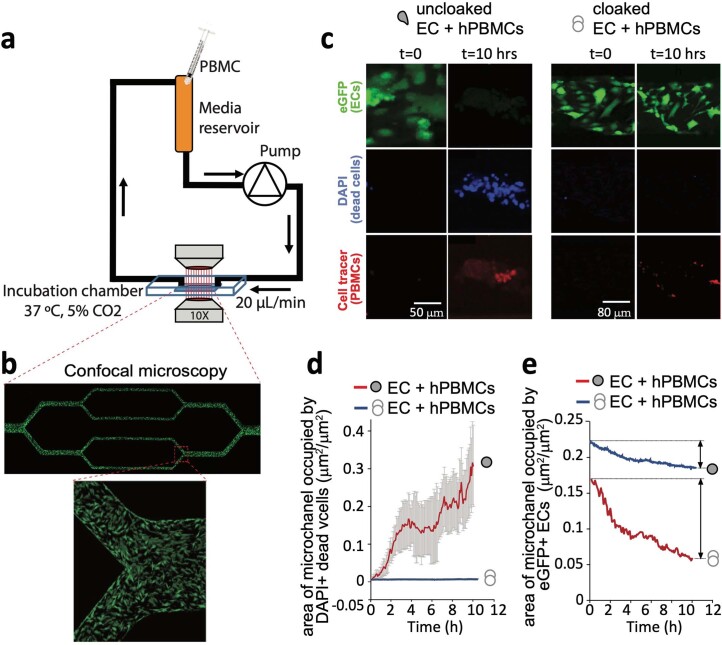
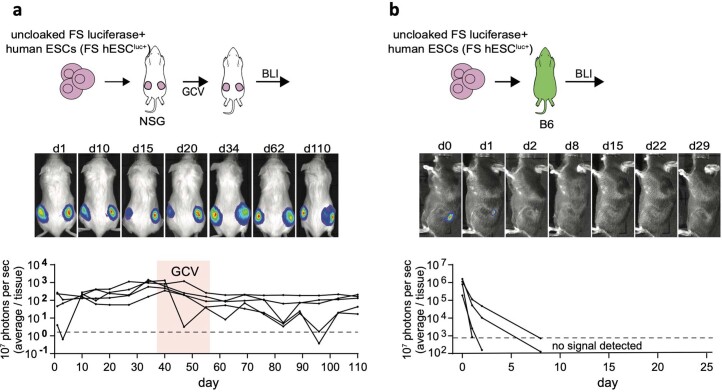
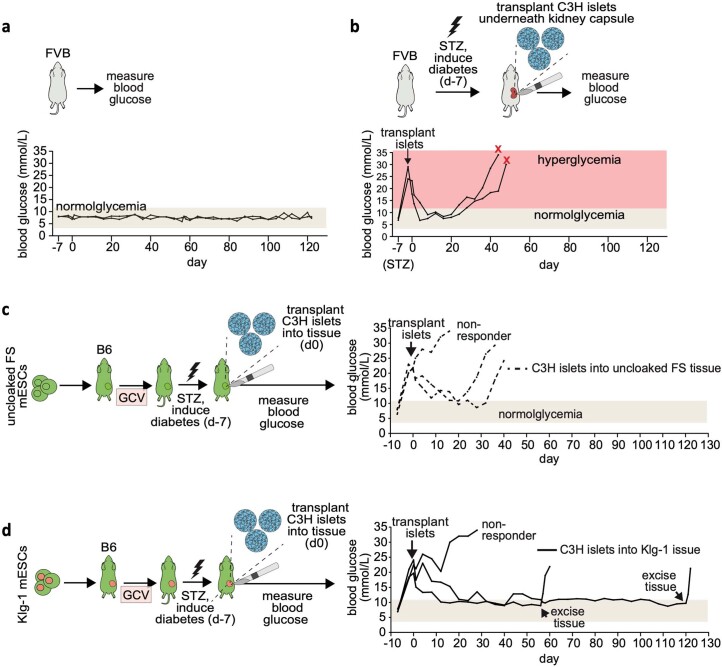
The immunogenicity of transplanted allogeneic cells and tissues is a major hurdle to the advancement of cell therapies. Here we show that the overexpression of eight immunomodulatory transgenes (Pdl1, Cd200, Cd47, H2-M3, Fasl, Serpinb9, Ccl21 and Mfge8) in mouse embryonic stem cells (mESCs) is sufficient to immunologically 'cloak' the cells as well as tissues derived from them, allowing their survival for months in outbred and allogeneic inbred recipients. Overexpression of the human orthologues of these genes in human ESCs abolished the activation of allogeneic human peripheral blood mononuclear cells and their inflammatory responses. Moreover, by using the previously reported FailSafe transgene system, which transcriptionally links a gene essential for cell division with an inducible and cell-proliferation-dependent kill switch, we generated cloaked tissues from mESCs that served as immune-privileged subcutaneous sites that protected uncloaked allogeneic and xenogeneic cells from rejection in immune-competent hosts. The combination of cloaking and FailSafe technologies may allow for the generation of safe and allogeneically accepted cell lines and off-the-shelf cell products.


Conflict of interest statement

A.N. is an inventor on the patent covering the FailSafe technology (PCT/CA2016/050256) and is a co-founder and shareholder of panCELLa Inc. A.N., J.H. and K.N. are inventors on a patent (PCT/CA2019/051808) covering induction of allograft tolerance using immunomodulatory transgenes. The other authors declare no competing interests.

Figures

Fig. 1
Fig. 1. Generating cloaked mESCs.
a, Candidate immunomodulatory factors and their roles in the innate and adaptive immune pathways involved in rejection of non-self. The underlined factors were selected to generate transgene-containing vectors. b, Schema showing the generation of clonal B6 mESCs that express the selected eight immunomodulatory transgenes via insertion with piggyBac (PB) and Sleeping Beauty (SB) transposon expression vectors. c, Expression level of each inserted transgene by RT–qPCR. Values are shown relative to the corresponding expressions in splenocytes (thick black line on each radial graph) from B6 mice stimulated ex vivo with αCD3ε and αCD28 antibodies. Concentric circles show log10 scale. Untransfected (FS) mESCs (parental line) are shown in upper left corner. Clones outlined in red and blue boxes were later screened for acceptance in allogeneic hosts. Red boxes, clones accepted in allogeneic hosts (clones 1 and 43, renamed Klg-1 and Klg-2, respectively). Blue boxes, clones rejected. d, In vitro antibody staining of all transgene-encoded factors in Klg-1 mESCs.
Fig. 2
Fig. 2. Cloaked mESCs escape immune rejection and survive long term in various immunocompetent and MHC-mismatched recipient strains.
a, Uncloaked FS B6 mESCs were injected subcutaneously into isogeneic (B6) or allogeneic (FVB, C3H, BALB/c or CD-1) recipients and followed for 15 days with BLI. One representative mouse is shown for each condition, but 10–20 were transplanted and followed for each condition. b, Klg-1 mESCs injected into FVB recipients; BLI showed the presence of donor cells 17 days after injection in one representative mouse. c, Assay to test rejection or long-term acceptance of cloaked FS mESCs. Rejected cells are cleared and no teratoma forms; acceptance results in formation and expansion of the teratoma. The growth of teratomas is halted by activation of the FS system with GCV to ablate dividing cells and allow for testing of long-term persistence/survival of injected allogeneic cells. d, Growth and survival curves of untreated and GCV-stabilized teratomas derived from uncloaked FS and Klg-1 FS B6 mESCs in 3 representative isogeneic and allogeneic (FVB, C3H, BALB/c and CD-1) recipients. Teratoma-growth curves in 3–4 recipients are shown per group. Pictures of representative teratomas (red arrows) shown on the right were taken at the endpoint. Red ‘x’ indicates recipients were euthanized. e, Percent of isogeneic and allogeneic recipients that formed long-term and GCV-stabilized teratomas from uncloaked FS and Klg-1 FS mESCs. Horizontal bar shows the total number of recipients that formed teratomas divided by the total number of mice injected. Observation period ranged from 2 to 9 months depending on euthanasia date. No instances of Klg-1 teratoma clearance occurred in any recipient once formed and stabilized. Data for all recipients including observation period are shown in Supplementary Table 1. Source data
Fig. 3
Fig. 3. Klg-1 cloaking transgenes within the gene expression profile.
a, Left: experimental schema showing collection of RNA for whole-genome RNA-seq expression analysis, from uncloaked FS and Klg-1 mESCs, as well as cells isolated from a Klg-1-derived dormant teratoma in allogeneic FVB recipients. Right: gene expression level distribution in uncloaked FS (red), Klg-1 (green) mESCs and a Klg-1 teratoma (blue), with plot showing the proportion of genes (y axis) at a given expression level (x axis). The symbols with corresponding colours show the cloaking gene expression levels in the distributions. Vertical green dotted lines show 95–99% highest expression range. b, Antibody staining of immune factors in long-term-accepted teratomas derived in isogeneic (top) and allogeneic (bottom) settings.
Fig. 4
Fig. 4. Generation of cloaked hESCs and their properties.
a, Schema showing the generation of hESCs (containing the FS system), which overexpress eight human immunomodulatory transgenes (‘cloaked’) via insertion of transposon expression vectors. b, Expression level of each transgene was determined by RT–qPCR. Values shown are normalized to hPBMCs stimulated in vitro with αCD3ε and αCD28 antibodies (thick black line on each radial graph). The symbols at the bottom are used to designate the corresponding cell lines in further studies. c, Experimental design to characterize the interaction between cloaked RPE cells and hPBMCs. Uncloaked or cloaked hESCs were differentiated into RPEs, irradiated and then co-cultured with hPBMCs for use in downstream experiments (Fig. 4d–j). d, Expression of immunomodulatory transgenes relative to GAPDH by qPCR before and after RPE differentiation. The symbols correspond to the definitions in a and b. e, IFNg and TNFa levels in supernatants after 5 days co-culture of RPE cells and hPBMCs (boxes represent the 25th to 75th percentiles with median, whiskers represent the minimum–maximum; n = 6 independent wells with 3 independent experiments; two-tailed Student’s t-test). f, Levels of apoptosis in hPBMCs as measured by Annexin and PI after 24 hours co-culture with uncloaked or cloaked RPEs. g, Cell surface area in hPBMC + RPE co-cultures measured by phase-contrast microscopy (IncuCyte system) as a correlate of cell survival or death over 5 days. Images were taken every 6 hours (mean ± s.e.m., n = 6 independent wells for each group; average of 5 fields per well). Representative wells with individual phase-contrast field (upper right corner, outlined in white) are shown. h, Proliferation of hPBMCs in co-cultures as measured by CFSE. i, Two independent experiments showed MHC class II (HLA-DR) expression on monocytes (CD45+CD16+) and dendritic cells (CD45+CD11c+) of hPBMC after 5 days of co-culture with uncloaked versus cloaked RPEs. Dotted line indicates the mean peak intensity of HLA-DR expression at D5 of hPBMC co-culture with uncloaked RPE. j, Changes to the immune cell population and phenotyping using CyTOF after co-culture of uncloaked or cloaked RPEs with hPBMCs for 1, 3 and 5 days. Analysis of CD4+CD8+ T-cell (CD45+CD3+) subsets including Tnaive (CCR7+CD45RA+CD45RO−), Teffector (CCR7−CD45RA+CD45RO−), Tcentral memory (CCR7+CD45RA−CD45RO+) and Teffector memory (CCR7−CD45RA−CD45RO+) cells. k, The experimental design (left) and IFNg in supernatant (right) after 3 days co-culture at varying ratios of uncloaked or cloaked RPEs with the NK92 cell line (boxes indicate the 25th to 75th percentiles with median, whiskers represent the minimum–maximum; n = 6 independent wells with 3 independent experiments; two-tailed Student’s t-test).
Fig. 5
Fig. 5. Dormant transplants formed from cloaked mESCs (Klg-1) serve as immune-privileged sites that protect allogeneic and xenogeneic transplants.
a, Klg-1 dormant transplants were established in FVB and then, as secondary transplants, 5 × 106 uncloaked FS luciferase transgenic B6 mESCs were injected into the primary transplant and tracked with BLI for 40 days (red solid boxes, d0–40). On day 60, as a tertiary transplant, 5 × 106 uncloaked FS mESCs were injected subcutaneously into the contralateral flank (blue boxes) and tracked with BLI for 30 days (d60–90). BLI exposure right side, 10 s; left side, 1 min. n = 2 mice. b, Left: a dormant uncloaked transplant was established in isogeneic B6 mice and, as a secondary transplant, 107 luciferase transgenic FS hESCs were injected into uncloaked transplant. Right: the human cells were followed with BLI (dashed red boxes and lines, d0–240). c, Left: a dormant Klg-1 (cloaked) transplant was established in B6 mice and, as a secondary transplant, 107 luciferase transgenic FS hESCs were injected into the cloaked transplant. Right: the human cells were followed with BLI (red boxes and lines, d0–240). On day 68, as a tertiary transplant, 107 luciferase transgenic FS hESCs were injected into the contralateral flank (blue boxes and lines) of mice with Klg-1 tissue and followed for 42 days by BLI (d68–110). The hosting Klg-1 tissues also expressed luciferase but at lower levels than FS hESCs cells and cannot be detected using short 10 second exposure times. The BLI images in b and c show one representative mouse in each group. BLI values of all mice are in p s−1. Black dashed lines, average background BLI. Uncloaked FS group, n = 6 mice; Klg-1 group, n = 7 mice. In b and c, images on far right show uncloaked (b) or Klg-1 (c) transplants excised at day 110 and imaged by BLI immediately after intraperitoneal injection of luciferin into recipients. White arrows in c show the presence of transplanted Luc+ hESCs in excised Klg-1 tissue. Source data
Extended Data Fig. 1
Extended Data Fig. 1. Approach to insert immunomodulatory transgenes into mESCs.
a. Structure of representative piggyBac (PB) or Sleeping Beauty (SB) plasmids used to express the CDS of eight immunomodulatory genes (Ccl21, Pdl1, Fasl, Serpinb9, H2-M3, Cd47, Cd200, and Mfge8) and luciferase in FailSafe B6 mESCs. Gene expression driven by a CAG promoter and linked by an IRES to an eGFP fluorophore, or Puromycin or Neomycin resistance genes. The entire expression cassette is flanked by inverted terminal repeat of piggyBac or Sleeping Beauty transposons. The NCBI Refseq protein ID encoded by each gene CDS is listed in Supplementary Table 1. b. Method 1) Failsafe B6 mESCs were transfected with a PB plasmid encoding an eGFP-linked Pdl1, then a clone with high eGFPhigh expression was isolated. This was followed by co-transfection of PB transposon plasmids encoding Ccl21, Fasl, Serpinb9, H2-M3, Cd47, Cd200, Mfge8 and luciferase and then drug selection with Puromycin. Method 2) FailSafe B6 mESCs were simultaneously transfected with PB plasmids encoding Pdl1, Fasl, Cd47, and Cd200, followed by drug selection with Puromycin and then a FACS sort on clones with high expression of each factor based on antibody staining and and eGFP for Pdl1. Bulk sorted cells then transfected with SB transposons encoding Ccl21, Mfge8, SerpbinB9, H2-M3 and luciferase, followed by drug selection with G418. Both methods resulted in a polyclonal pool that were used to establish clonal lines and analyzed by RT-qPCR for transgene expression levels.
Extended Data Fig. 2
Extended Data Fig. 2. Long-term acceptance of dormant cloaked Klg-2 mESC transplant in allogeneic recipients.
a. Schema of long-term allogeneic acceptance assay. Clone 43 (in Fig. 1c, bordered in red) was renamed as Klg-2. b. Pictures of two representative Klg-2 derived, dormant transplant in isogeneic and allogeneic recipients (red arrows show subcutaneous transplants). c. Percent of isogenic and allogeneic recipients that formed dormant transplant from Klg-2 mESCs. Number in the horizontal bar indicates the total number of mice that transplants divided by the total number of mice injected. Observation period ranged from 2 to 6 months. Once formed, no instances of Klg-2 transplant-clearance occurred in any recipient. Data for all mice, including observation period, shown in Supplementary Table 3.
Extended Data Fig. 3
Extended Data Fig. 3. Characterization of uncloaked FS and Klg-1 mESCs.
a. Representative brightfield images of the two cell lines showing typical ES cell morphology, b. Undifferentiated cells are Alkaline phosphatase (AP) positive, and c. express OCT4 and SSEA1 pluripotency markers shown by IHC staining. d. Klg-1 embryoid bodies and cell outgrowth. e. Picture of Klg-1-derived dormant transplant accepted in an allogeneic FVB recipient showing robust neovascularization of the tissue (top); H&E staining of tissue section showing a representative vessel that contains red blood cells (bottom). f. H&E staining of sections showing all three germ layers present in the long-term-accepted, Klg-1-derived dormant transplants in allogeneic recipients. Black arrows point to lineage indicated by text in each image. g. IHC showing similar MHC class I expression in dormant transplants derived from both isogeneic uncloaked FS and allogeneic Klg-1 mESCs. B6 mice express the b allele of the H2-K MHC class genes. Staining for the q allele serves as a negative control.
Extended Data Fig. 4
Extended Data Fig. 4. Differentiation of Klg-1 FS mESCs into distinct lineages and cell types.
a. IHC showing presence of cells expressing ectoderm (Neurofilament, NF) and mesoderm (Smooth Muscle Actin, SMA), early embryonic lineage markers, in Klg-1 embryoid bodies. b. CD31+ endothelial-like cells with vascular tube-like formations (top) and FOXA2 + , SOX17+ definitive endoderm derived from Klg-1 FS mESCs using directed protocols. c. Troponin+ cells after cardiomyocyte differentiation of Klg-1mESCs, and d. cyclic contraction (top graph) measured as a function of normalized cell displacement and calcium flux (bottom graph) after loading with Fluo-4 AM 15 days after cardiomyocyte differentiation. e. Adipocyte differentiation showing phase contrast, Oil Red O staining, and eGFP fluorescence. The eGFP reporter is expressed by the Pdl1 transgene in Klg-1 FS mESCs shown in Extended Data Fig. 1b).
Extended Data Fig. 5
Extended Data Fig. 5. Generation and characterization of hESC lines expressing immunomodulatory transgenes.
a. Structure of the piggyBac or Sleeping Beauty transposon plasmids and approach used to overexpress the eight human immunomodulatory genes (CCL21, PDL1, FASLG, SERPINB9, HLA-G, CD47, CD200, and MFGE8) in FS hESCs. The NCBI Refseq protein ID encoded by each gene CDS is listed in Supplementary Table 1. Uncloaked FS hESCs were co-transfected with piggyBac vectors encoding PDL1, FASLG, CD200, and CD47, followed by puromycin selection and FACS sorting on high expressors using antibodies against each factor. Then, this bulk population was transfected with Sleeping Beauty vectors encoding SERPINB9, HLA-G, MFGE8, and CCL21, followed by selection with G418, and FACS sorting into bulk and clonal lines using the fluorophores encoded on the expression vectors. Fluorophores were only linked to those immunomodulatory factors that are secreted or intracellular (MFGE8, CCL21 and SERPINB9). b. FACS plots showing protein expression levels and gating strategy used to isolate cloaked hESCs with expression of all eight immunomodulatory factors. Untransfected FS hESC stained with the same antibodies (which express intermediate levels of mCherry from the FS-containing cassette) were used as FACS gating controls. c. RT-qPCR showing expression levels of all eight immunomodulatory factors on clonal, cloaked hESCs lines after both rounds of transfection and FACS sorting. Concentric circles represent the log10 scale. d. FACS plots showing immunomodulatory protein levels on selected cloaked hESC clones using antibodies or the fluorophore marker linked to SERPINB9, CCL21, and MFGE8. e. Intracellular antibody staining against secreted factors SERPINB9, CCL21, and MFGE8 on selected cloaked hESC clones. Untransfected FS hESCs shown in gray. f. qPCR of OCT4 and NANOG expression levels. g. Upregulation of HLA class I (using antibody recognizing -A, -B, and -C) 36 hours after in vitro stimulation with 100 ng/mL IFNg.
Extended Data Fig. 6
Extended Data Fig. 6. Differentiation of uncloaked FS and cloaked FS hESCs into cell types with clinical relevance.
a. Uncloaked FS and cloaked hESCs were differentiated into Retinal Pigmented Epithelial (RPE), cardiomyocyte, definitive endoderm, and endothelial cells. b. Phase contrast microscopy shows in vitro differentiated pigmented RPE with characteristic morphology. c. Upregulation of HLA class I (using antibody recognizing -A, -B, and -C) on uncloaked FS and cloaked RPEs 36 hours after in vitro stimulation with 100 ng/mL IFNg. d. IHC showing alpha-actinin and troponin expression after cardiomyocyte differentiation. e. OCT4 and NANOG versus SOX17 and FOXA2 reciprocal expression levels measured by qPCR after differentiation into definitive endoderm. OCT4 and NANOG normalized cells to uncloaked FS hESCs at day 0. SOX17 and FOXA2 normalized to cells differentiated from uncloaked FS hESCs at day 5. f. CD144 and CD31 expression on uncloaked FS and cloaked FS hESCs before differentiation (top row), and after differentiation into endothelial cells (bottom row).
Extended Data Fig. 7
Extended Data Fig. 7. In vitro co-culture of human PBMCs and uncloaked FS or cloaked FS human RPEs.
RPEs were co-cultured with hPBMCs for 5 days. a. Annexin V and propidium iodide (PI) staining on the CD45+ and CD45- compartment of hPBMC. b. Phase object area as measured by the phase contrast microscopy (IncuCyte system). Images taken every 6 hours (mean ± SEM, n = 6 independent wells for each group, average of 5 fields / well).
Extended Data Fig. 8
Extended Data Fig. 8. Microfluidic device to study the interactions between cloaked differentiated cells and hPBMCs.
a. Scheme showing the media reservoir, circulating system, and inlet for injecting PBMCs and cell viability reagents. b. Microfluidic chip showing eGFP+ endothelial cells lining the interior channels. c. Confocal microscopy live cell imaging showing the EC-lined microchannel of the microfluidic device after loading cell tracer-labelled hPBMCs into circulation at t = 0 and t = 10 hours. d. Normalized area of the microchannel occupied by DAPI+ dead cells. e. eGFP+ ECs 10 hours after injection of hPBMCs. Measurements were taken in at least 3 separate areas containing the microchannels of the device using ImageJ to measure the fluorescence signals on specific frames extracted from the live-cell imaging.
Extended Data Fig. 9
Extended Data Fig. 9. Luciferase imaging FS hESCs transplant in NSG and B6 mice.
10-12 million luciferase-expressing uncloaked FS hESCs (FS hESCsluc+) were injected into a. NSG (n = 5) or b. B6 (n = 4) recipients and monitored by BLI imaging. Black dotted line shows the detection limit. Images show one representative mouse per group. NSG recipients were treated with GCV to halt growth of human cell transplant. BLI images were taken approximately 15 min after IP injection with luciferin, with 10 second exposure time. Source data
Extended Data Fig. 10
Extended Data Fig. 10. Klg-1 - derived dormant transplant forms immune-privileged tissue that protects allogeneic islets in a mouse model of diabetes.
a. Normoglycemic range in wild type FVB/NJ mice is between 4-11 mmol/L (brown highlighted region). b. FVB/NJ recipients were treated with STZ (d-7), a beta-cell cytotoxic agent, leading to the rapid development of hyperglycemia (red highlighted region). Seven days later, islets isolated from allogeneic C3H/HeJ donor mice were harvested and transplanted (d0) underneath the kidney capsule of STZ-treated FVB/NJ recipients. Normoglycemia was only restored short term, indicating the rejection of the allogeneic islets. c. Dormant transplants derived from uncloaked FS mESCs in B6 mice. Recipients were then treated with STZ to induce hyperglycemia, and 7 days later (d0), islets from allogeneic C3H mice were grafted into the tissue that rapidly returned to stable normoglycemia (n = 3 recipients). The hyperglycemia, however, returned after a few weeks, indicating the rejection of the allogeneic islets. d. Dormant transplants derived from Klg-1 cell line in B6 mice. Then STZ-induced hyperglycemia was treated with allogeneic C3H islets grafted into the transplants (n = 3 recipients). The animals then rapidly returned to stable normoglycemia that lasted until the transplant surgically removed. Source data

References

    1. Riminton DS, Hartung HP, Reddel SW. Managing the risks of immunosuppression. Curr. Opin. Neurol. 2011;24:217–223. doi: 10.1097/WCO.0b013e328346d47d. - DOI - PubMed
    1. Taylor CJ, Peacock S, Chaudhry AN, Bradley JA, Bolton EM. Generating an iPSC bank for HLA-matched tissue transplantation based on known donor and recipient HLA types. Cell Stem Cell. 2012;11:147–152. doi: 10.1016/j.stem.2012.07.014. - DOI - PubMed
    1. de Rham C, Villard J. Potential and limitation of HLA-based banking of human pluripotent stem cells for cell therapy. J. Immunol. Res. 2014;2014:518135. - PMC - PubMed
    1. Ye Q, et al. Generation of universal and hypoimmunogenic human pluripotent stem cells. Cell Prolif. 2020;53:e12946. doi: 10.1111/cpr.12946. - DOI - PMC - PubMed
    1. Zhao W, et al. Strategies for genetically engineering hypoimmunogenic universal pluripotent stem cells. iScience. 2020;23:101162. doi: 10.1016/j.isci.2020.101162. - DOI - PMC - PubMed

Publication types

LinkOut - more resources