. 2023 Dec;30(12):1970-1984.
doi: 10.1038/s41594-023-01156-8. Epub 2023 Nov 23.

Intra-promoter switch of transcription initiation sites in proliferation signaling-dependent RNA metabolism

Affiliations

Intra-promoter switch of transcription initiation sites in proliferation signaling-dependent RNA metabolism

Joseph W Wragg et al. Nat Struct Mol Biol. 2023 Dec.

Abstract

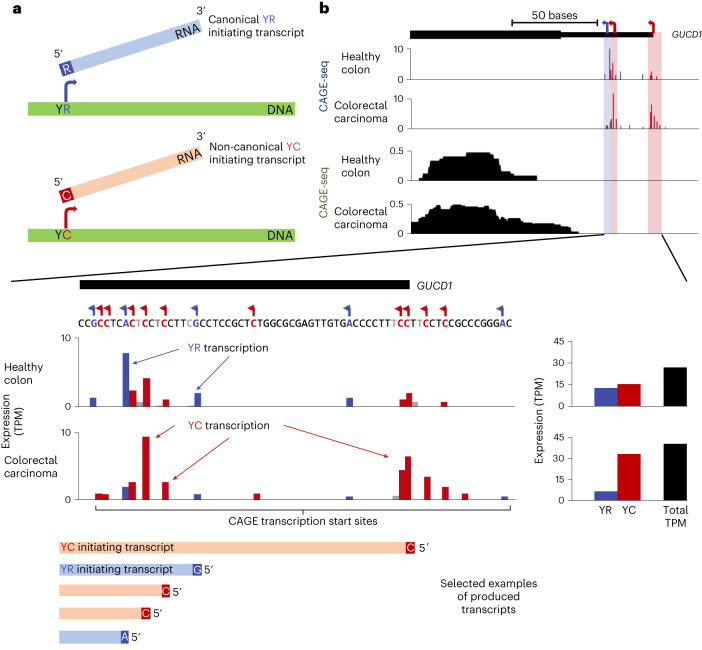
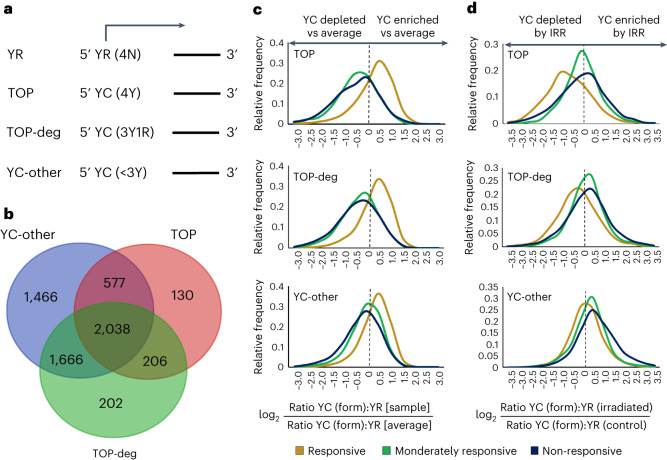
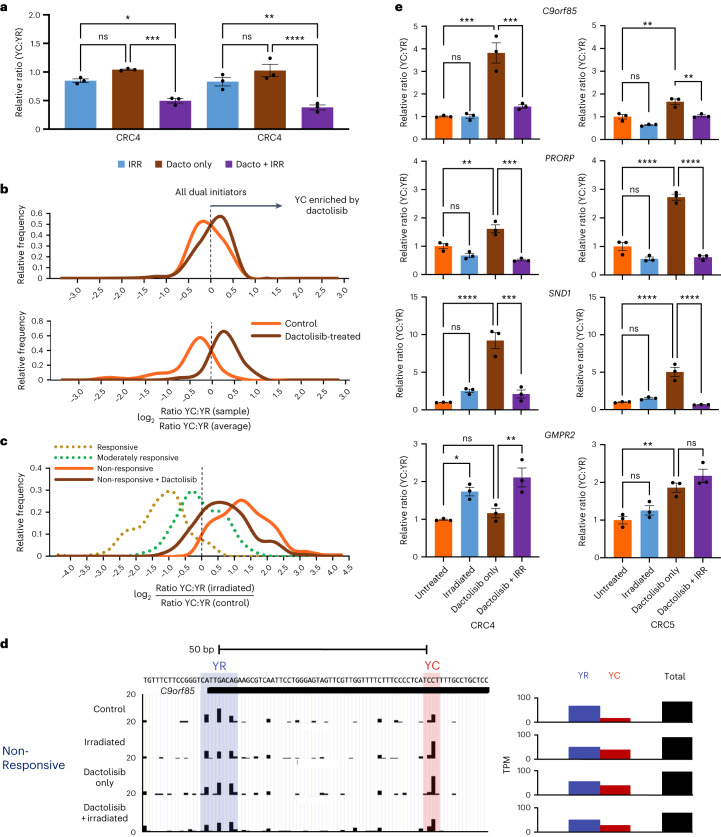
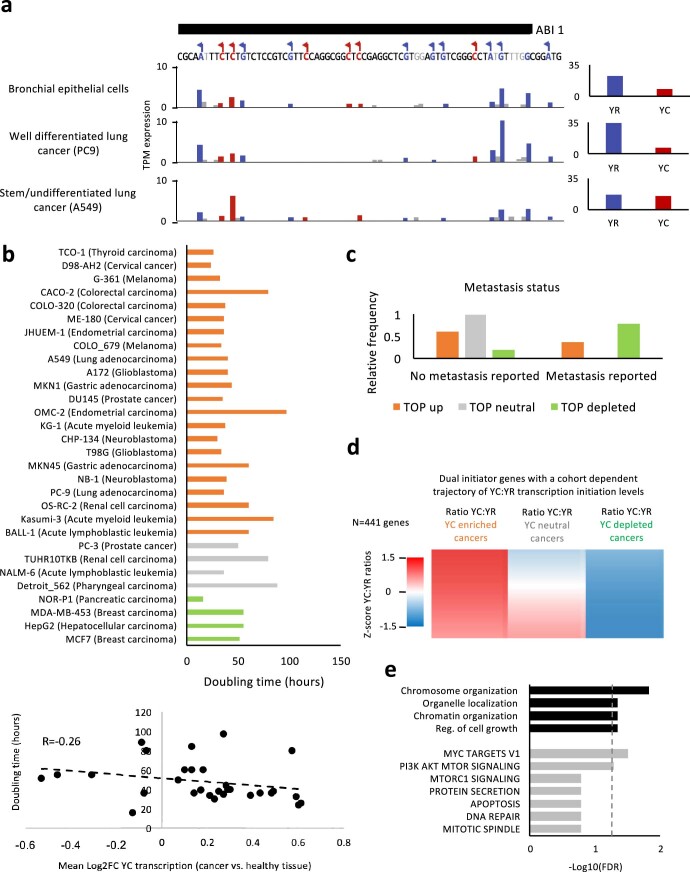
Global changes in transcriptional regulation and RNA metabolism are crucial features of cancer development. However, little is known about the role of the core promoter in defining transcript identity and post-transcriptional fates, a potentially crucial layer of transcriptional regulation in cancer. In this study, we use CAGE-seq analysis to uncover widespread use of dual-initiation promoters in which non-canonical, first-base-cytosine (C) transcription initiation occurs alongside first-base-purine initiation across 59 human cancers and healthy tissues. C-initiation is often followed by a 5' terminal oligopyrimidine (5'TOP) sequence, dramatically increasing the range of genes potentially subjected to 5'TOP-associated post-transcriptional regulation. We show selective, dynamic switching between purine and C-initiation site usage, indicating transcription initiation-level regulation in cancers. We additionally detail global metabolic changes in C-initiation transcripts that mark differentiation status, proliferative capacity, radiosensitivity, and response to irradiation and to PI3K-Akt-mTOR and DNA damage pathway-targeted radiosensitization therapies in colorectal cancer organoids and cancer cell lines and tissues.


Conflict of interest statement

The authors declare no competing interests.

Figures

Fig. 1
Fig. 1. Dual-initiation promoter usage with non-canonical YC transcription in cancer.
a, Illustration of transcription from canonical (YR) and non-canonical (YC) initiation dinucleotides. b, UCSC Genome Browser view of CAGE-seq and RNA-seq tracks from a representative dual-initiator gene, guanylyl cyclase domain containing 1 (GUCD1), where there is a switch from canonical (YR) transcription (blue bars) in the healthy tissue to non-canonical (YC) transcription (red bars) in the cancer (colorectal carcinoma). The rare instances in which transcription initiates from an alternative site besides YR and YC are shown in gray. Bar graphs to the right show total TPM values of YR and YC transcription in healthy and cancer tissues together with overall TPM values. Selected examples of transcripts produced at varying levels from the GUCD1 promoter, between the healthy and cancer samples, are illustrated below.
Fig. 2
Fig. 2. 5′-C transcripts are most enriched in poorly differentiated and proliferative cancer types.
Dual initiators (promoters with >1 TPM for both YC and YR transcription in the majority of datasets (>30 out of 59)) were identified across all selected FANTOM5 cancer and healthy tissue CAGE datasets (n = 3,475). The relative expression of the YC versus YR component of transcription for each dual initiator was calculated and compared between matched cancer and healthy tissues. a, Table of cancer samples ordered by mean log2 fold change (log2(FC)) in the ratio of YC to YR transcription of dual-initiator promoters between cancer and matched healthy tissue. P value (paired two-tailed t-test) of this expression change is also shown (ns, not significant; *P < 0.05; **P < 0.01; ***P < 0.001; full list of P values available in the Source data). This table is color-coded to show cancers where YC transcription at dual initiators is significantly enriched (orange), unchanged (gray) or depleted (green) relative to the matched healthy tissues. b, The differentiation status of each cancer sample was identified where publicly available. They were then separated into undifferentiated, moderately differentiated and well-differentiated cancer types, and the distribution of each sample’s mean log2(FC) in YC:YR transcription (as calculated in a) was plotted for each group. The distribution of TP53-mutant samples is also shown by the color of each plot point. c,d, Biological process ontology of genes specifically upregulated in YC-enriched cancers (n = 132) (c) and YC-depleted cancers (n = 144) (d). FDR, false discovery rate. Source data
Fig. 3
Fig. 3. Enriched YC initiation marks radiotherapy-responsive CRC tumors.
a, Bar graph of the total expression from all CTSS within consensus clusters, initiating with YR or YC dinucleotides, between the responsive and non-responsive CRC clinical tumor cohorts (chi-squared, P = 0.0001). b,c, Dual-initiating promoters were identified as before (n = 186). The proportion of transcription initiating in each dual-initiator promoter, from the YC and YR sites, was quantified for each sample and compared between them on a per-promoter basis. b, Frequency distribution graph showing the degree of expression change of the YC component (normalized to YR) of each dual promoter between responsive and non-responsive CRC clinical tumor samples (paired two-tailed t-test, P = 0.023). c, Frequency distribution graph as in b but with each expression component (YR and YC) separately analyzed (paired two-tailed t-test, *P = 0.013). d, Plot of relative survival of the five CRC organoid cultures under study, between those irradiated with 25 Gy versus 0 Gy (n = 3 independent experiments, data are presented as mean values ± s.e.m.). e, Bar graphs of the total expression from CTSS in dual-initiator consensus clusters (left, n = 6,292) and all other consensus clusters (right, n = 12,428), initiating with YR or YC dinucleotides, for each CRC organoid sample (chi-squared test, P < 0.0001 for both dual and other promoters). f, Dual-initiator promoters were identified as before (n = 6,292), and the YC:YR expression ratio was calculated for each in all organoid samples and divided by the average YC:YR ratio for that promoter. The frequency distribution of these values, illustrating the YC:YR ratio of transcription for all dual initiators, between samples is shown. g, UCSC Genome Browser view of CAGE tracks from a representative dual-initiator gene, SND1 (staphylococcal nuclease and tudor domain containing 1), showing a dynamic switch from YC-predominant transcription in radiotherapy-responsive CRC organoids (CRC1) to YR-predominant transcription in radiotherapy-non-responsive organoids (CRC5), with balanced transcriptional output from YR and YC components in the moderately responsive CRC organoid (CRC3). h, Bright-field images showing the morphology and doubling times of the five CRC organoid lines under investigation. White arrows, cysts; red arrows, crypts; scale bar, 100 µm. Doubling time analysis is based on measurements from three independent experiments. Source data
Fig. 4
Fig. 4. Radiotherapy-responsive modulation of YC transcription initiation correlates with CRC clinical response.
a, Bar graph showing the proportion of CTSS in dual-initiator consensus clusters, initiating with YR or YC dinucleotides, in responsive (average of CRC1 and CRC2), moderately responsive (CRC3) and non-responsive (average of CRC4 and CRC5) organoids treated with 0 Gy (control) or 25 Gy (irradiated) irradiation treatment (chi-square analysis, P = 0.0001). b, Frequency distribution graph showing the degree of expression change of the YC component (normalized to YR) of each dual promoter upon irradiation in responsive (average of CRC1 and CRC2), moderately responsive (CRC3) and non-responsive (average of CRC4 and CRC5) organoids. c, UCSC Genome Browser view of an irradiation-responsive dual promoter (C9orf85). This promoter shows a clear loss of the YC component upon irradiation in responsive tumors (CRC1) and a relative lack of the YC component in moderately responsive (CRC3) and non-responsive (CRC5) organoid samples. Source data
Fig. 5
Fig. 5. TOP-, TOP-deg- and YC-other-initiating transcripts share radiotherapy-responsive dynamics.
a, Illustration of the selection criteria for transcripts identified to initiate with a YR, TOP, TOP-deg or YC-other 5′ initiation makeup. b, The YC components of all dual initiators were subdivided into TOP, TOP-deg and YC-other forms as illustrated in a, and the number of previously identified DIPs containing >1 TPM of each YC form was calculated; Venn diagram shows the intersection of genes containing >1 TPM of each YC form (generated using Academo software). c, The ratio of each YC form to YR transcription in each dual initiator was calculated and divided by the average ratio for that promoter. The frequency distribution of these values, illustrating TOP:YR, TOP-deg:YR and YC-other:YR ratios of transcription for all dual initiators, between responsive (average of CRC1 and CRC2 (gold)) and non-responsive (average of CRC4 and CRC5 (dark blue)) organoid samples is shown. d, Analogous to c, but comparing the change in dual-initiator TOP, TOP-deg and YC-other component expression upon irradiation between responsive (average of CRC1 and CRC2 (gold)) and non-responsive (average of CRC4 and CRC5 (dark blue)) organoid samples.
Fig. 6
Fig. 6. A YC-defined gene signature marks radiotherapy response.
a, Venn diagram of the pan-cancer trajectory genes (described in Extended Data Fig. 1d), radiosensitivity trajectory genes (described in Extended Data Fig. 3f) and irradiation-affected trajectory genes (described in Extended Data Fig. 4b). The 147 genes forming the intersection of the latter two groups are termed the radiotherapy responsiveness signature genes (Venn diagram generated with Meta-Chart software). b, Intersection of MSigDB pathway enrichment ontology analysis of the three trajectory gene sets detailed in a. Dotted line shows 0.05 FDR threshold. c, UCSC Genome Browser view of an irradiation-responsive dual promoter, GMPR2 (guanosine monophosphate reductase 2), highlighting the location of the annealing sites for primers designed to segregate the expression of the YC and YR components through RT–qPCR analysis. Direction of transcription (on the reverse strand) is illustrated by arrows. d, Bar graphs showing the relative expression of the YC and YR components of five candidate dual-initiation genes in the CRC organoids and upon irradiation, calculated by RT–qPCR analysis. (n = 2 responsive, n  = 1 moderately responsive and n = 2 non-responsive organoids; *P < 0.05, two-tailed unpaired t-test, statistically analyzed comparisons were responsive versus non-responsive and control versus irradiated; data are presented as mean values ± s.e.m., full list of P values available in the Source data). e, Bar graphs showing the relative expression of the YC and YR components of five candidate dual-initiation genes in 12 CRC clinical samples (six responsive and six non-responsive independent biological samples), calculated by RT–qPCR analysis. (P < 0.0001, 0.0001, 0.0097 and 0.0046 for C9orf85, PRORP, SND1 and GMPR2, respectively; two-tailed unpaired t-test, statistically analyzed comparisons were responsive versus non-responsive and control versus irradiated; data are presented as mean values ± s.e.m.). Source data
Fig. 7
Fig. 7. Inhibition of PI3K–AKT–mTOR pathway signaling enhances YC transcript abundance and restores radiotherapy-induced transcriptional dynamics.
a, Bar graph of survival of organoids from each resistant line, exposed to each experimental condition, relative to untreated organoids (n = 3 independent experiments, *P < 0.05, **P < 0.01, ***P < 0.001, ****P < 0.0001; ordinary one-way ANOVA with Tukey’s multiple comparisons test; data are presented as mean values ± s.e.m., full list of P values available in the Source data). b, Frequency distribution of YC:YR ratios of all dual initiators (n = 6,292) and radiotherapy-responsive signature genes (n = 147) in CRC5 control (orange) and dactolisib-treated (brown) samples relative to the average ratio between samples. c, Frequency distribution of the fold change in YC:YR ratios upon irradiation of the radiotherapy-responsive signature genes in CRC5 control (orange) and dactolisib-treated (brown) samples as well as responsive (average CRC1 and CRC2 (dotted gold)) and moderately responsive (CRC3 (dotted green)). d, UCSC Genome Browser view of C9orf85. This promoter shows an enrichment of the YC component upon radiosensitizing PI3K–mTOR inhibition (dactolisib) treatment in non-responsive tumors (CRC5) and a restoration of YC depletion upon irradiation and dactolisib treatment compared to dactolisib alone. e, Bar graphs of RT–qPCR analysis of relative YC and YR expression from candidate dual initiators in CRC organoids treated with dactolisib, irradiation or a combination (n = 3 independent experiments, *P < 0.05, **P < 0.01, ***P < 0.001, ****P < 0.0001; ordinary one-way ANOVA with Tukey’s multiple comparisons test; data are presented as mean values ± s.e.m.; full list of P values available in the Source data). Source data
Fig. 8
Fig. 8. Model diagram of YC:YR dynamics in irradiated CRC organoids.
a, Aberrant PI3K–AKT–mTOR and Myc pathway activity may shift the transcript balance of dual-initiator genes towards radiotherapy-resistant YR predominance, curtailing radiotherapy sensitivity in non-responsive tumor cells. This is reversed and the YC:YR balance is restored by PI3K–AKT–mTOR inhibition using dactolisib or omipalisib, radiosensitizing the tumors. b, At the tumor level, radiotherapy-sensitive tumors are predominantly made up of YC-enriched, radio-responsive cells and radiotherapy-non-responsive tumors are predominantly made up of YC-depleted, radiotherapy-resistant cells. Upon irradiation, YC-enriched cells are selectively killed, leaving only radiotherapy-resistant YC-depleted cells. This leads to a significant shift in YC transcript levels in radiotherapy-responsive tumors and little change in radiotherapy-resistant tumors. PI3K–AKT–mTOR inhibition drives a cell-level enrichment of 5′-C transcripts, shifting the balance between YC-enriched and YC-depleted cells in the non-responsive tumor, rendering it more radiosensitive.
Extended Data Fig. 1
Extended Data Fig. 1. YC transcription is most enriched in poorly differentiated and proliferative cancer types.
a, UCSC Genome Browser view of representative dual initiator gene, Abelson interactor 1 (ABI1), showing the relative usage of YC (red bars) and YR (blue bars) between healthy bronchial epithelial cells, a well differentiated lung cancer cell line (PC9) and a undifferentiated lung cancer cell line (A549), with total TPM values for each shown in bar graphs (right). This serves to exemplify the enhanced usage of YC transcription in undifferentiated cancer types. b, Top, bar graph of doubling times for the cancer cell lines analysed in Fig. 2, ordered by mean log2FC YC:YR transcription (cancer / Healthy) to match Fig. 2a. Bottom, scatter plot of correlation between mean log2FC YC:YR transcription (cancer / Healthy) and cell line doubling time. c, Bar graph of the relative frequency of YC enriched, neutral and depleted cancer samples sourced from patients with/ without known metastasis. d, Dual initiator genes where the ratio of YC:YR transcription initiation dynamically changes between YC enriched, neutral and depleted cancer cohorts were identified (n = 422 promoters). A heatmap of the Z-score of YC:YR transcription ratios between cohorts is shown for this gene set (d). e, Bar graph of the gene ontology of dual initiators displaying dynamic YC:YR ratios between cohorts (as described in d). Significant biological process ontology (top) and match to Molecular signature database (MSigDB) Hallmark gene sets (bottom) are shown. Dotted line shows 0.05 FDR threshold.
Extended Data Fig. 2
Extended Data Fig. 2. Quality assessment of new CAGE-seq datasets generated for this paper.
a, Bar graph of the frequency of CAGE read mapping to gene promoters, exons, introns and intergenic regions in each CAGE library. b, Bar graph of the frequency of CAGE reads initiating at their 5’ end with YR, YC, GG or other dinucleotides at the +1/−1 position respectively, for each CAGE library. Source data
Extended Data Fig. 3
Extended Data Fig. 3. Enriched YC initiation marks radiotherapy responsive CRC tumours.
a, Summary of the protocol for the collection of radio-responsive and resistant CRC tumour samples. Tumour images used with permission from. b, Bar graph of the total expression from all CTSSs within consensus clusters (n = 18713), initiating with YR or YC dinucleotides, for each CRC organoid sample. c, Dual initiating promoters in the CRC organoid dataset were identified as previously described (n = 6285). The proportion of transcription initiating in each dual initiator promoter, from the YC and YR site was quantified for each sample and compared between them on a per promoter basis. Frequency distribution graph showing the degree of expression change of the YC (red) and YR (blue) component each dual promoter between responsive (average CRC1&2) and non-responsive (average CRC4&5) organoid samples (*** P < 0.001, T-test). d, Correlation scatter plot showing the relative expression of YC and YR components of all dual initiator genes (black) and Responsiveness trajectory genes (red) between responsive and non-responsive organoids (avr. CRC1&2 vs, avr. CRC4&5). Blue dotted lines show intersection with 1/−1 Log2FC. The selected Radio-responsiveness signature genes explored by RTqPCR (Extended Data Fig. 8) are highlighted in this plot. e, bar graphs of the relative frequency of dual initiators displaying the behaviour of YR where YC is enriched / unchanged / depleted between responsive vs. non-responsive organoids. f, Dual initiator promoters with a dynamic shift in YC vs YR transcript abundance, correlating with radiotherapy responsiveness were identified (n = 807). The criteria used was that the average YC:YR ratio in CRC1&2 (responsive) for each dual initiator was 1.5 fold greater than the ratio in CRC3 (moderately responsive), which was in turn 1.5 fold greater than the YC:YR ratio in CRC4 and 5 (non-responsive). A heatmap of the relative YC:YR ratios for each dual initiator between CRC organoid samples is shown. g, h, Bar graphs of biological process (g) and Molecular signature database (MSigDB) Hallmark (h) gene ontology of dual initiators displaying dynamic YC:YR ratios correlated with radiotherapy sensitivity. Dotted line shows 0.05 FDR threshold. i, Line plot of organoid cell proliferation rate over 9 days, with cell counts taken at day 4 and day 9 (n = 3 independent experiments, data are presented as mean values +/- SEM).
Extended Data Fig. 4
Extended Data Fig. 4. Radiotherapy responsive modulation of YC transcription initiation correlates with CRC clinical response.
a, Expanded version of Fig. 4a, illustrating the dynamics of total YC/YR TPM values upon irradiation for all 5 organoid samples. b, Dual initiator promoters with a dynamic shift in YC vs YR transcript abundance, upon irradiation, correlating with radiotherapy responsiveness (as illustrated in Fig. 4c) were identified (n = 411). The criteria used was that the average fold change in YC:YR ratio upon irradiation in CRC1&2 (responsive) for each dual initiator was 1.5 fold greater than the ratio in CRC3 (moderately responsive), which was in turn 1.5 fold greater than the YC:YR ratio fold change upon irradiation in CRC4 and 5 (non-responsive). A heatmap of the relative fold change in YC:YR ratio upon irradiation for each dual initiator, between CRC organoid samples is shown. c, Bar graph of biological process gene ontology of dual initiators displaying dynamic YC:YR ratio change upon irradiation correlated with radiotherapy responsiveness (as described in b). c, Bar graph of the gene ontology of dual initiators displaying dynamic YC:YR ratios correlated with radiotherapy responsiveness (as described in b). Matches to the Molecular signature database (MSigDB) Hallmark gene sets (bottom) are shown. Dotted line shows 0.05 FDR threshold. Source data
Extended Data Fig. 5
Extended Data Fig. 5. Enriched YC initiation marks radiotherapy responsive CRC tumours.
a, Dual initiators were segregated on the basis of whether they contained >1TPM of either TOP or TOP-deg YC forms (With TOP, n = 4819), or not (Without TOP – representing the group of 1466 DIPs with only the YC-other form identified in Fig. 5b). a shows the frequency distribution equivalent to Fig. 3g, but with the ‘With TOP’ and ‘Without TOP’ DI groups shown separately. b, frequency distribution equivalent to Fig. 4b, but with the ‘With TOP’ and ‘Without TOP’ DI groups shown separately. c, frequency distribution plots (analogous to a&b) of the relative ratio of YC:YR transcripts where the YC transcripts are with or without internal TOP sequences (within the first 50 bp) in dual initiators in responsive (gold), moderately-responsive (green) and non-responsive (blue) organoid cohorts. d, frequency distribution plots (analogous to c&d) of the relative activity of YR transcripts with vs. without internal TOP sequences (within the first 50 bp) in consensus clusters in responsive (gold), moderately-responsive (green) and non-responsive (blue) organoid cohorts.
Extended Data Fig. 6
Extended Data Fig. 6. Radio-responsiveness signature genes are enriched for ribosomal and translation associated factors, but also represent a range of biological functions.
a, Bar graph of biological process gene ontology (top) and enriched motifs in the gene promoter (bottom) of the 147 radio-responsiveness signature genes (selected as described in Fig. 6). b, Bar graph of MSigDB pathway enrichment ontology of the 147 radio-responsiveness signature genes. c, Bubble graph displaying biological functions enriched in radio-responsiveness signature genes and ordered by P-value, but also represented by at least 10 genes in the radio-responsiveness signature gene set, to reveal the composition of the signature gene list.
Extended Data Fig. 7
Extended Data Fig. 7. MYC, ELK1 and GABPA transcription factor binding sites are enriched in the promoters of radiotherapy response signature genes.
a, Heatmap visualizing the Total, YR and YC transcript component expression patterns of transcription factors implicated in regulating the radio-responsiveness signature genes, across the 5 organoid samples. b, Heatmap visualizing the Total, YR and YC transcript component log2 fold change in expression of transcription factors implicated in regulating the radio-responsiveness signature genes, between irradiated and control samples of the 5 organoids. c, UCSC Genome Browser view of CAGE tracks from the transcription factor TBPL1, showing a dynamic switch from YC predominant transcription in radiotherapy responsive CRC organoids (CRC1) to YR predominant transcription in radiotherapy non-responsive organoids (CRC5), with balanced transcriptional output from YR and YC components in the moderately responsive CRC organoid (CRC3). d, Heatmap visualizing the log2 odds ratio of the occurrence of core promoter motifs ( > 90% match to JASPAR published consensus motif, ELK1: MA0028.2, GABPA: MA0062.1, MYC: MA0147.3, TP53: MA0106.1) in the promoters (200 bp up and down stream of the dominant TSS) of the radio-responsiveness signature gene set vs. all promoters (P = 0.031, 0.002, 0.049 and 0.25 for ELK1, GABPA, MYC and TP53 respectively, two-tailed Fisher’s exact test). e, Genome browser views of the candidate genes from the radio-responsiveness signature gene set with the location of proximal TF motifs highlighted. Reads from the responsive CRC cohort are shown in each case and the YR and YC transcriptional regions of the promoter highlighted in blue or red respectively. As the YC and YR transcription initiation sites in GMPR2 are spatially separated only the YC section is shown, however assessment of the YR region revealed no binding motifs corresponding to ELK1, GABPA, MYC or TP53.
Extended Data Fig. 8
Extended Data Fig. 8. RT-qPCR Primer locations on candidate dual initiator promoters.
UCSC Genome Browser views of dual initiating promoters, highlighting the location of annealing sites for primers designed to segregate the expression of the YC and YR component through RTqPCR analysis. The YR and YC initiation regions of the promoter are denoted by blue and red boxes respectively.
Extended Data Fig. 9
Extended Data Fig. 9. Inhibition of PI3K / AKT / mTOR and DNA damage pathway signalling enhances YC transcript abundance and restores radiotherapy induced transcriptional dynamics.
a and b, Plot of survival of organoids from each resistant line, exposed to a combination of drug treatment (a – Omipalisib, b – VE821) and irradiation (Data are presented as mean values +/- SEM). c, Bar graphs of RTqPCR analysis of relative YC/YR expression from candidate dual initiators in CRC organoids treated with Omipalisib and VE821, irradiation or a combination of drug and irradiation (n = 3 independent experiments, * P < 0.05, ** P < 0.01, *** P < 0.001, **** P < 0.0001, Ordinary one-way ANOVA with Tukey’s multiple comparison’s test, Data are presented as mean values +/- SEM, full list of p-values available presented in the Source data file). Source data

References

    1. Demircioğlu D, et al. A pan-cancer transcriptome analysis reveals pervasive regulation through alternative promoters. Cell. 2019;178:1465–1477.e1417. doi: 10.1016/j.cell.2019.08.018. - DOI - PubMed
    1. Nepal C, Andersen JB. Alternative promoters in CpG depleted regions are prevalently associated with epigenetic misregulation of liver cancer transcriptomes. Nat. Commun. 2023;14:2712. doi: 10.1038/s41467-023-38272-4. - DOI - PMC - PubMed
    1. van den Elzen AMG, Watson MJ, Thoreen CC. mRNA 5′ terminal sequences drive 200-fold differences in expression through effects on synthesis, translation and decay. PLoS Genet. 2022;18:e1010532. doi: 10.1371/journal.pgen.1010532. - DOI - PMC - PubMed
    1. Weber R, et al. Monitoring the 5′UTR landscape reveals isoform switches to drive translational efficiencies in cancer. Oncogene. 2023;42:638–650. doi: 10.1038/s41388-022-02578-2. - DOI - PMC - PubMed
    1. Cockman E, Anderson P, Ivanov P. TOP mRNPs: molecular mechanisms and principles of regulation. Biomolecules. 2020;10:969. doi: 10.3390/biom10070969. - DOI - PMC - PubMed