. 2023 Dec;5(12):2184-2205.
doi: 10.1038/s42255-023-00926-4. Epub 2023 Nov 23.

Anomalous peroxidase activity of cytochrome c is the primary pathogenic target in Barth syndrome

Affiliations

Anomalous peroxidase activity of cytochrome c is the primary pathogenic target in Barth syndrome

Valerian E Kagan et al. Nat Metab. 2023 Dec.

Abstract

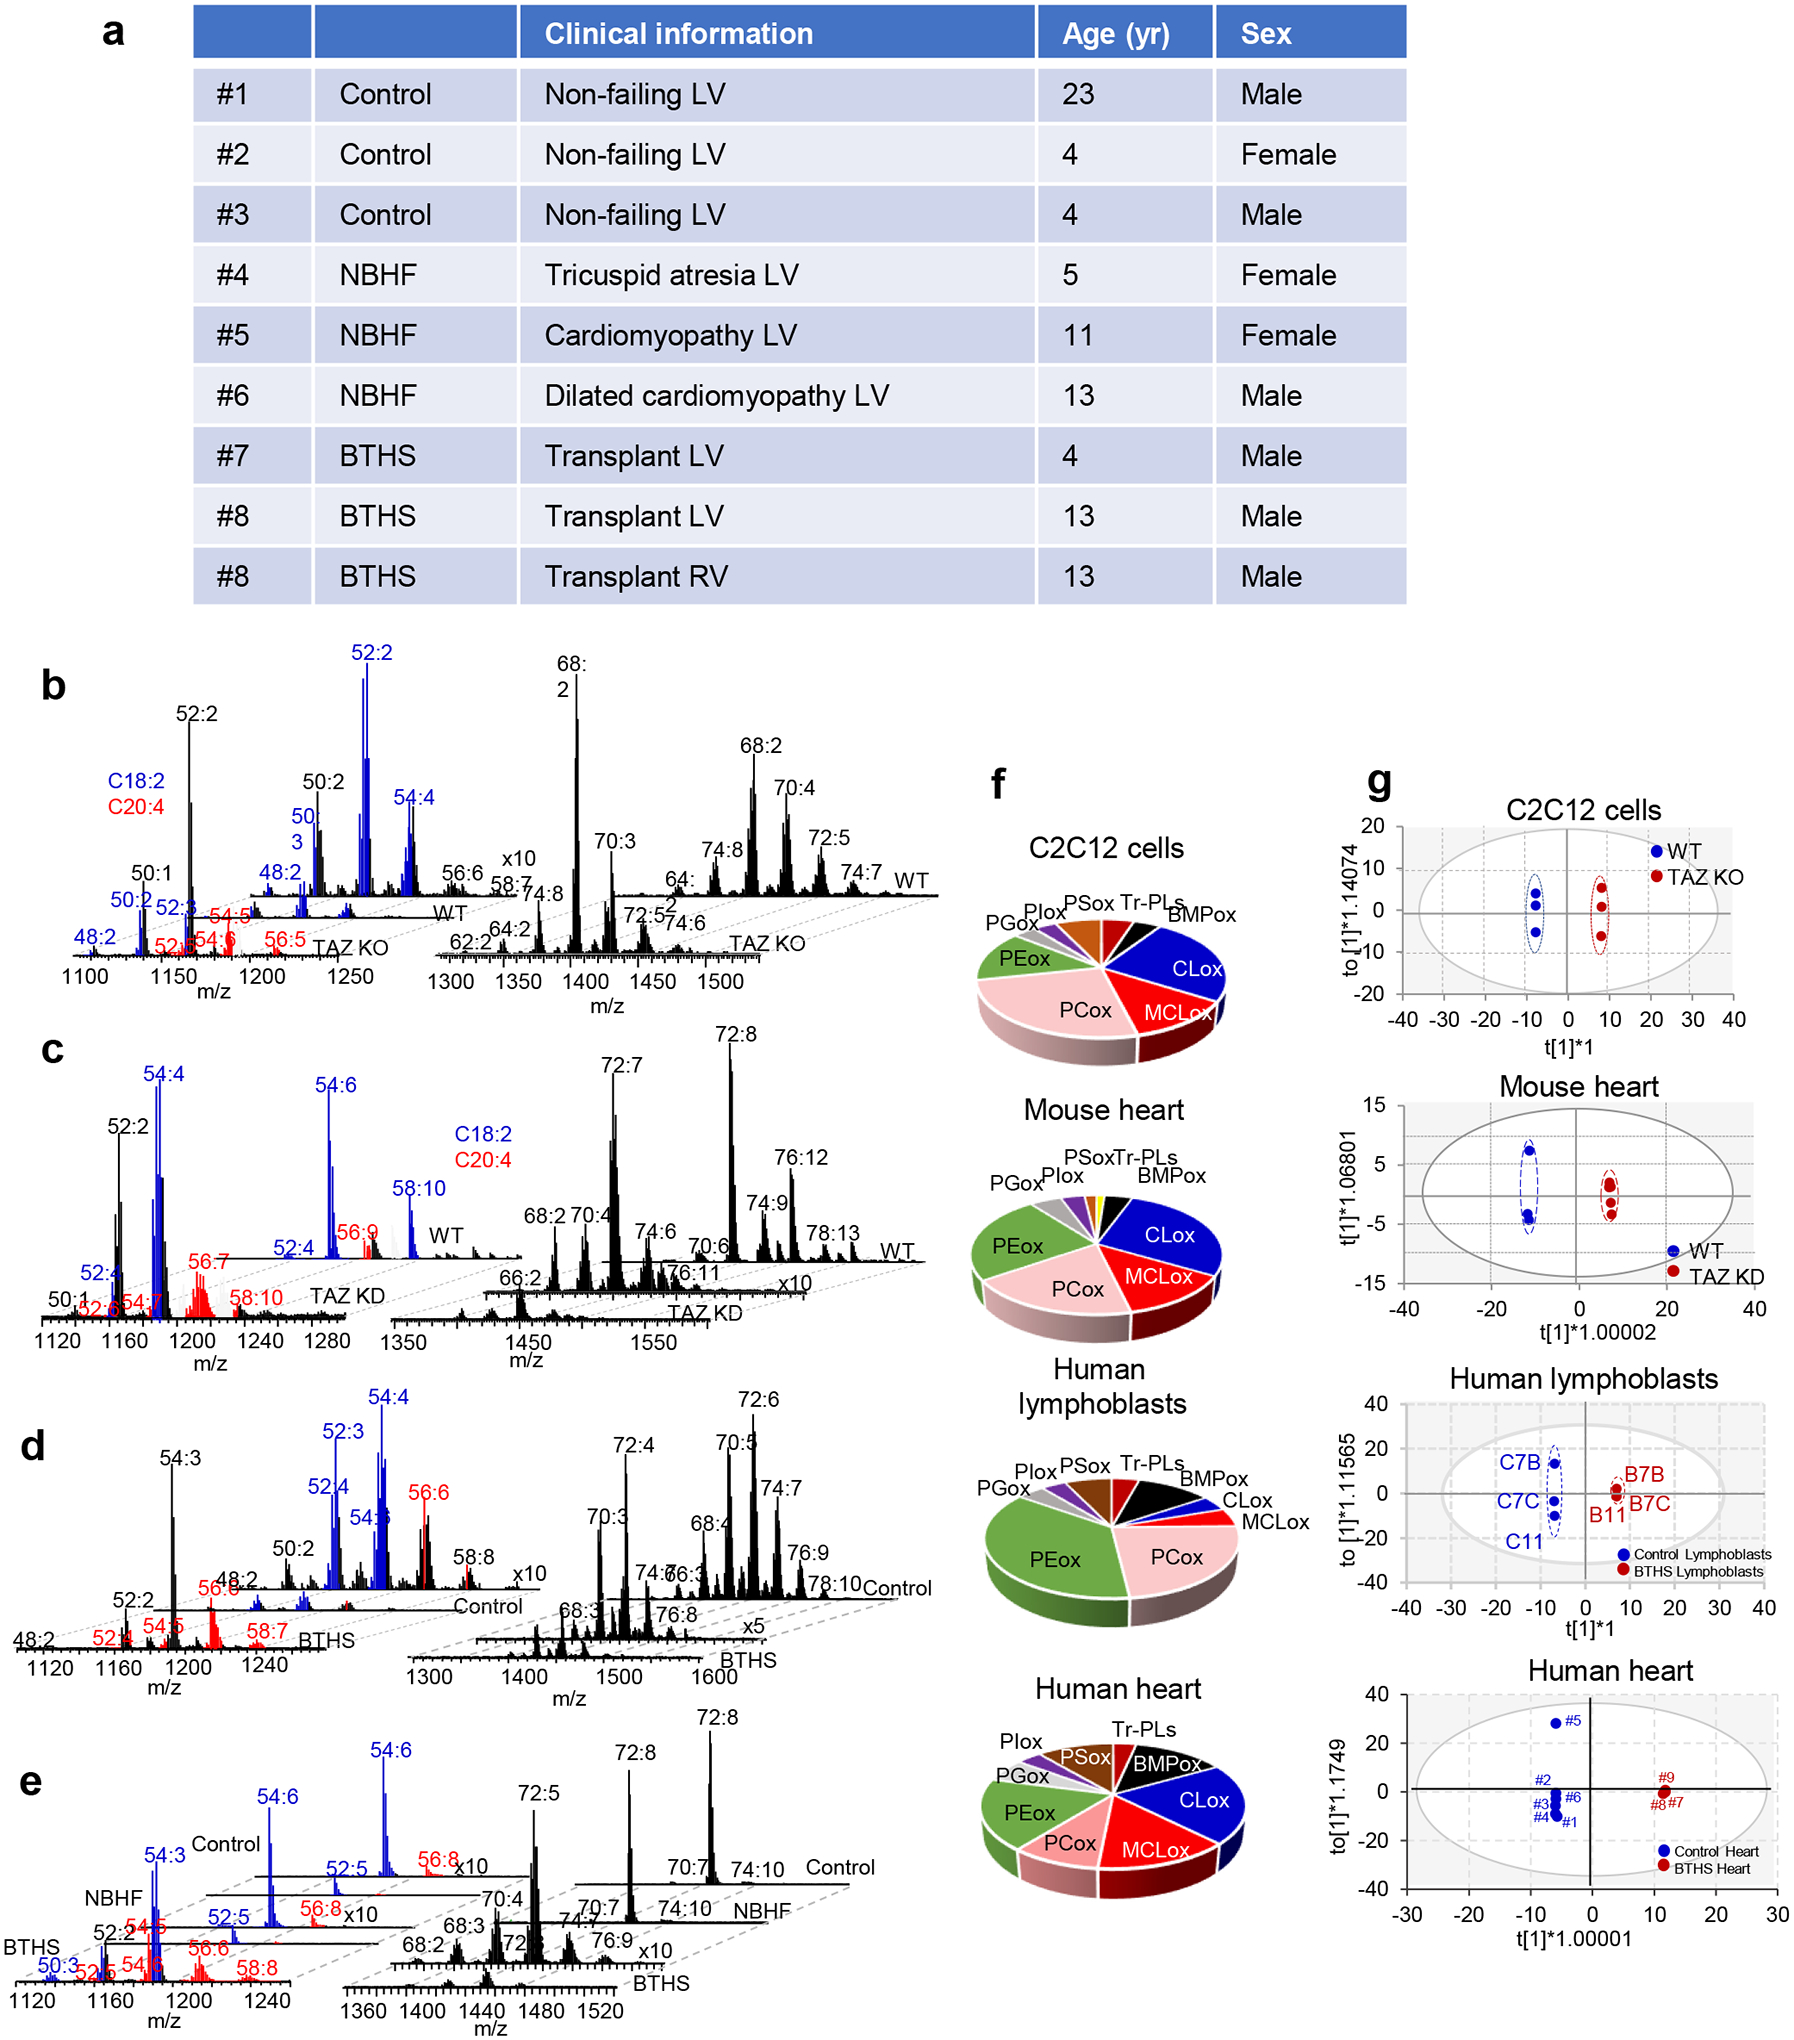
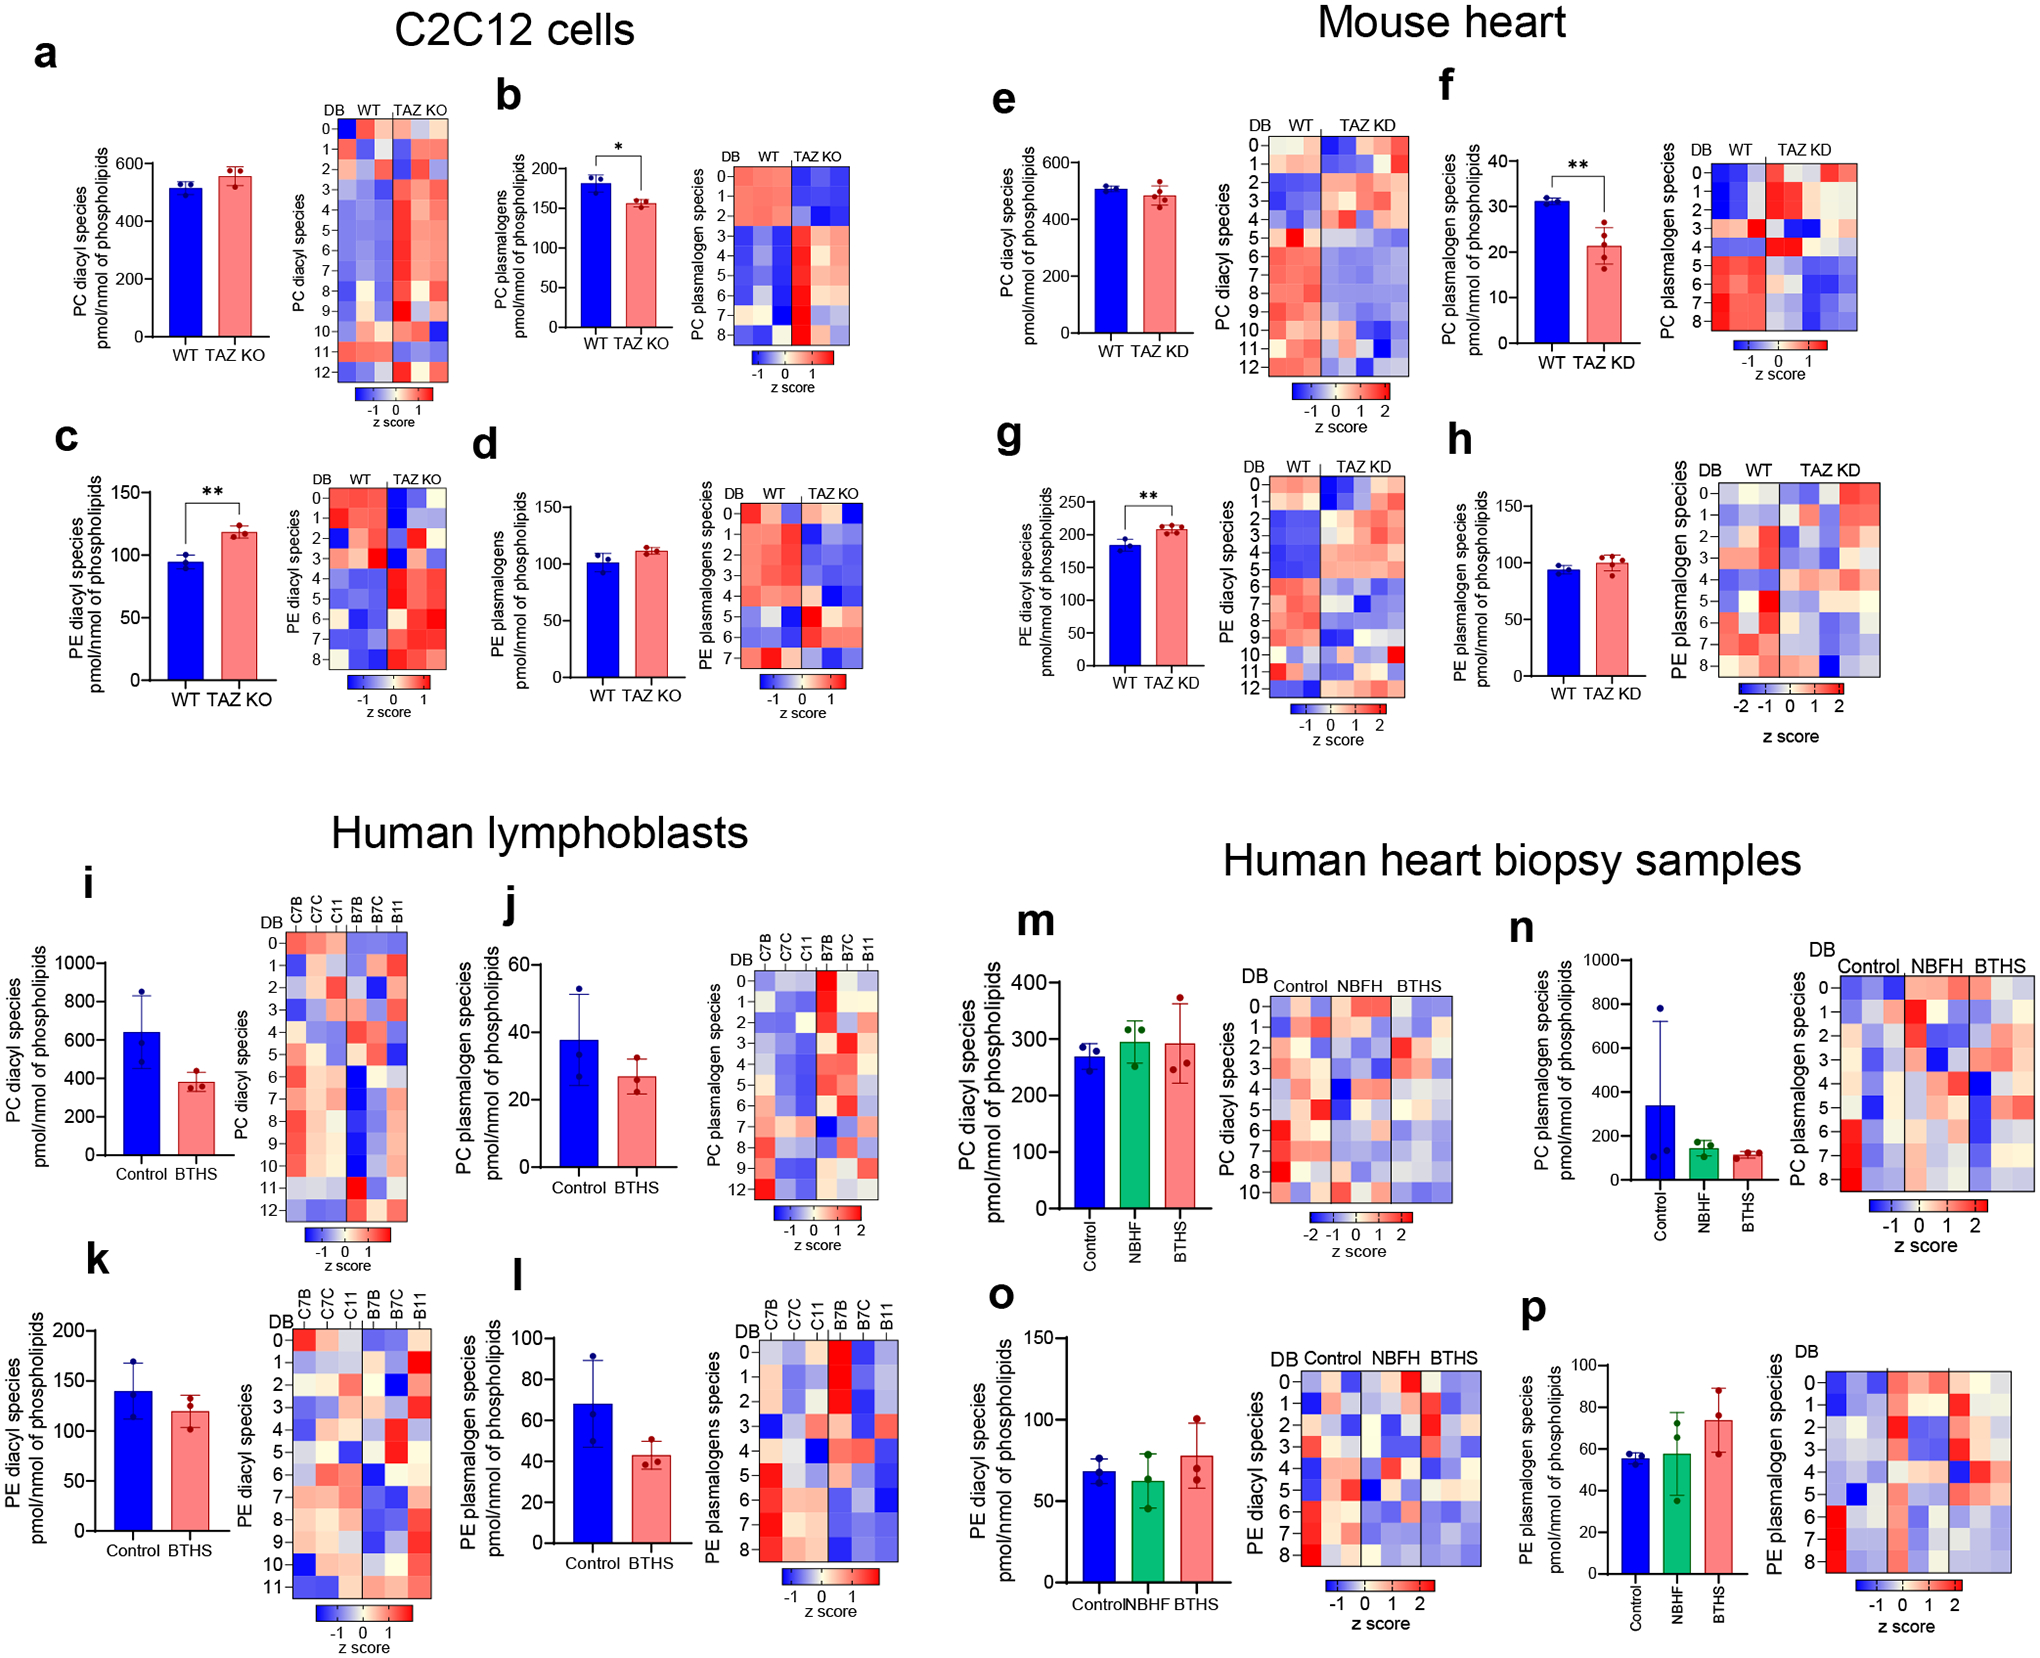
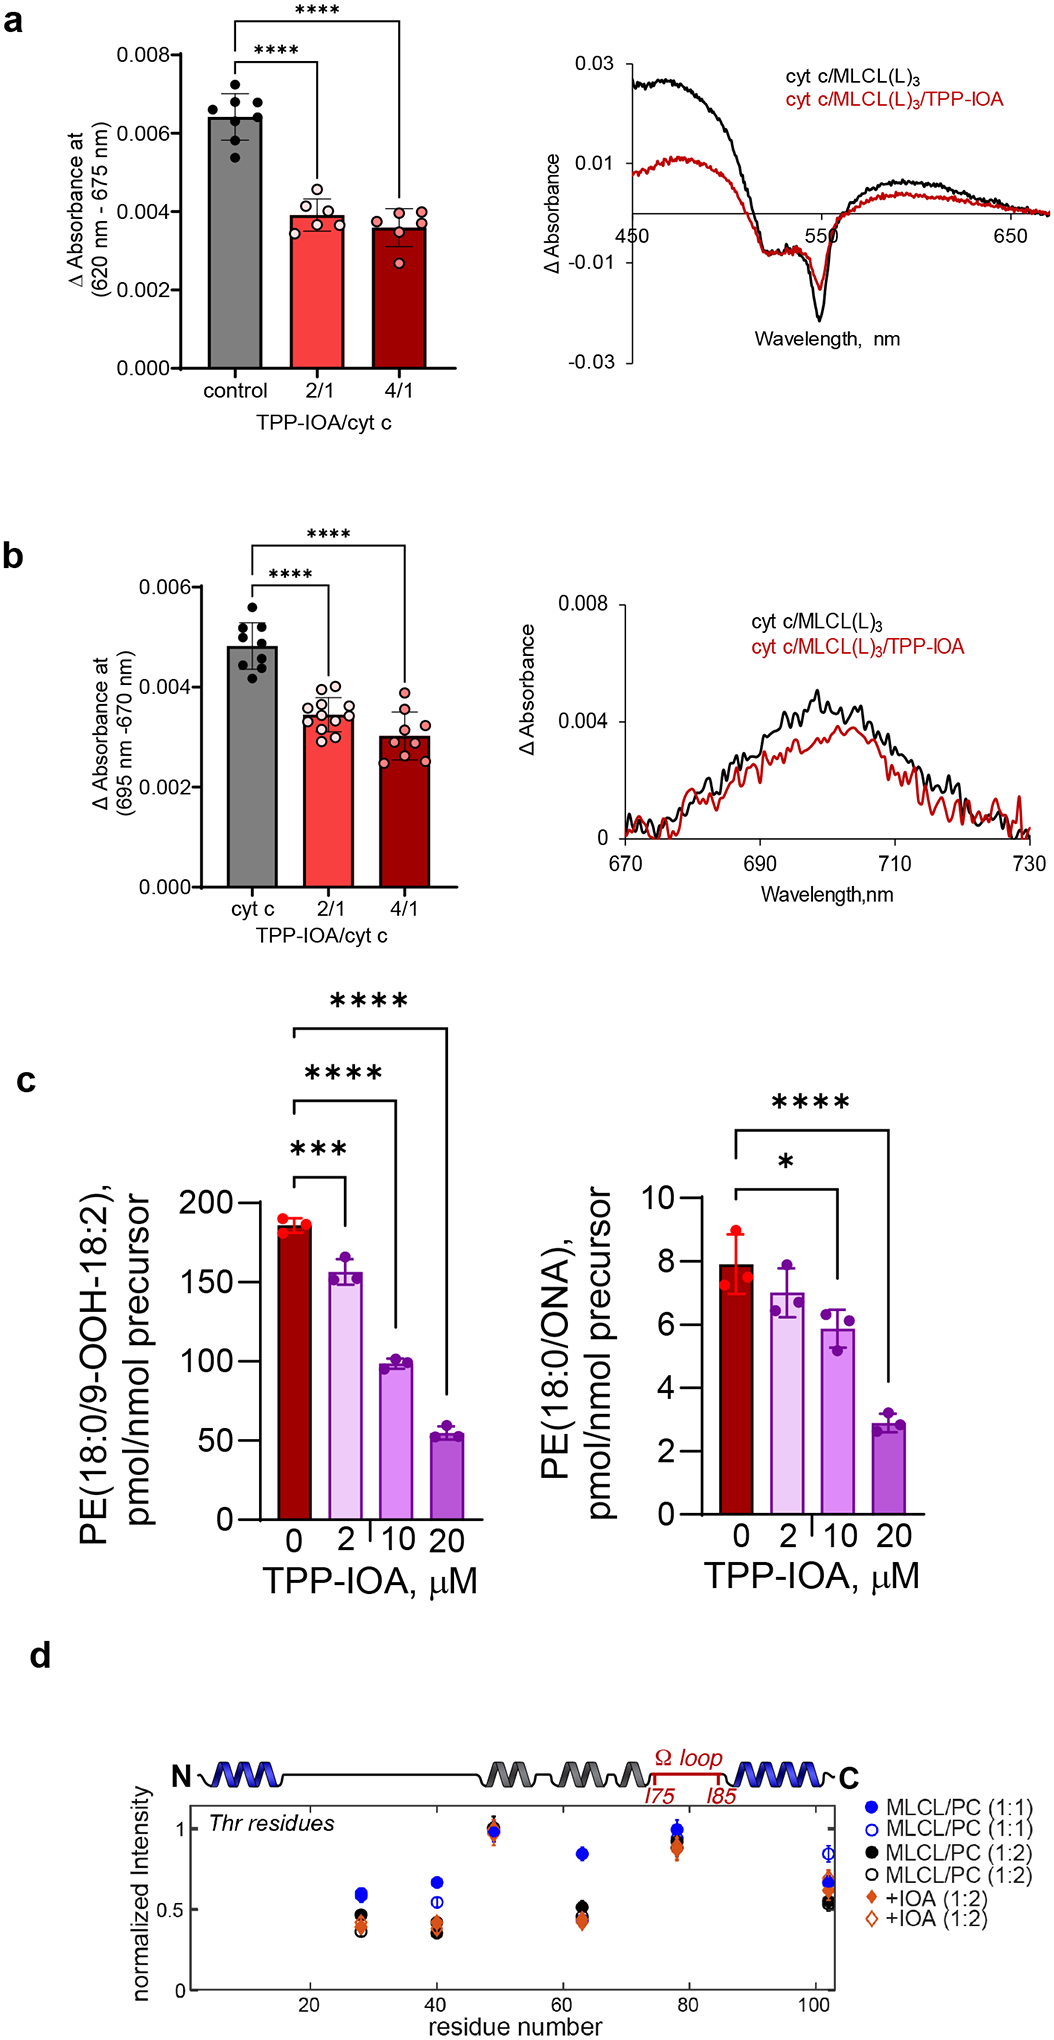
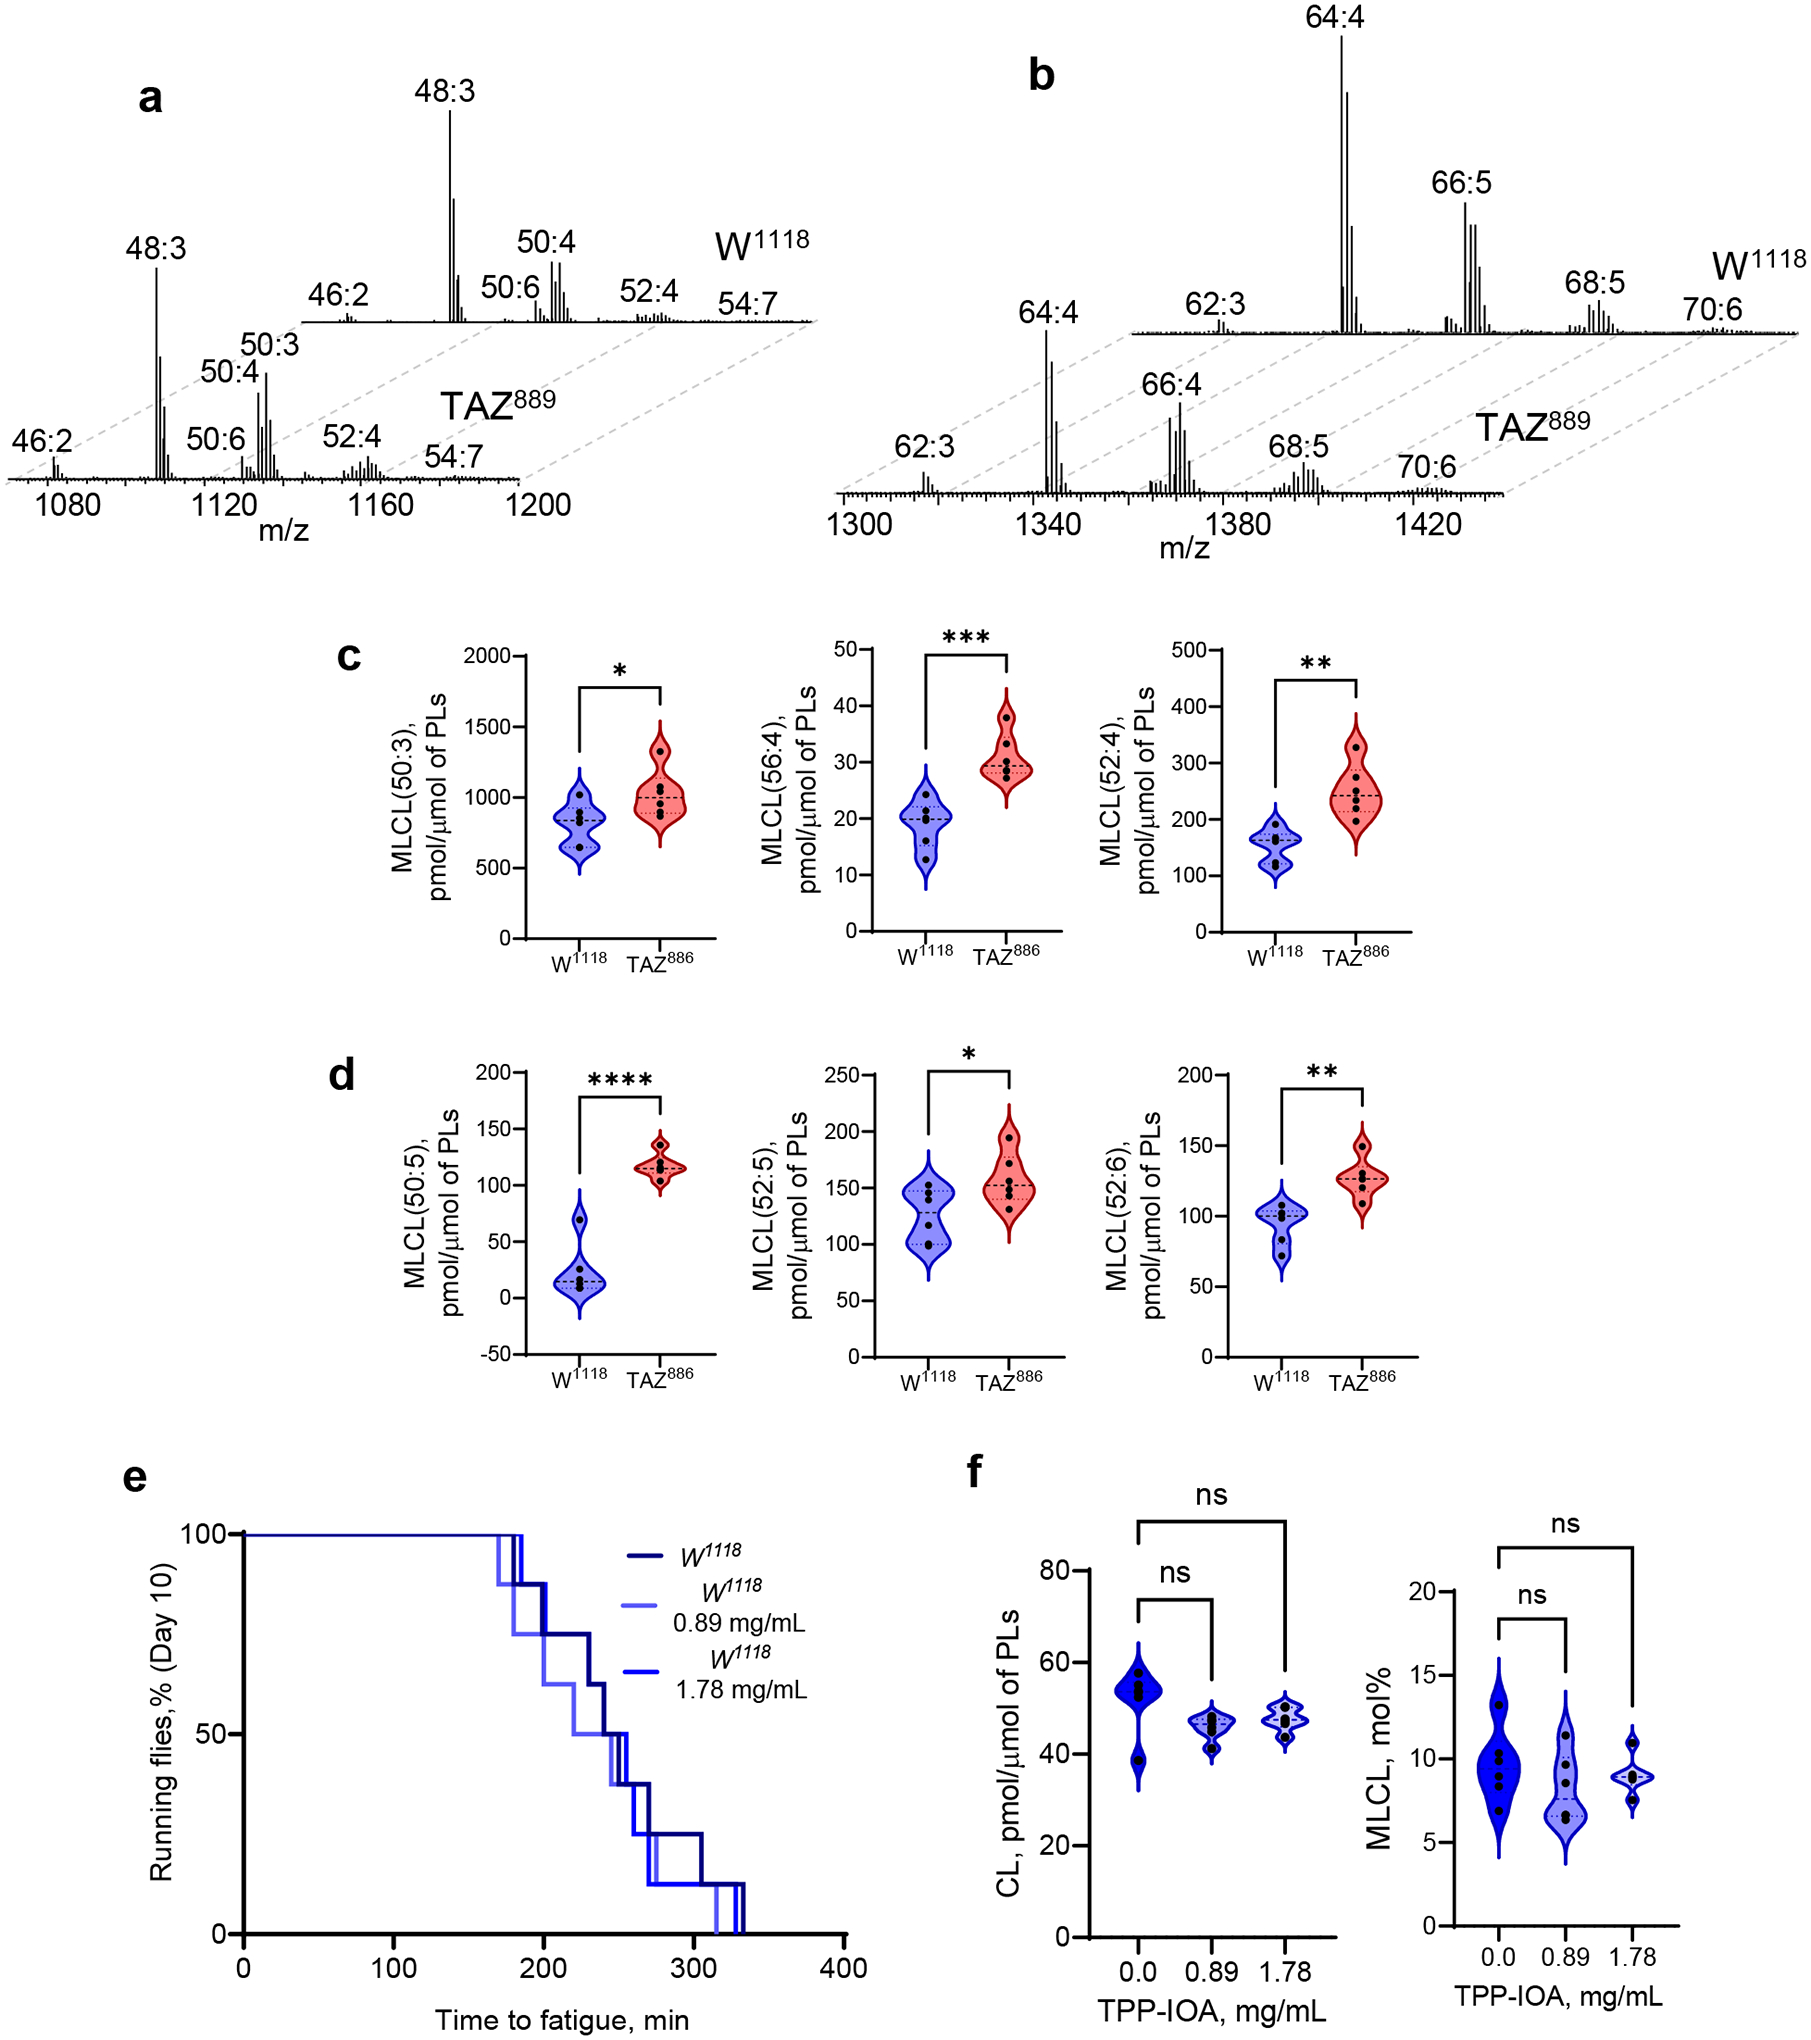
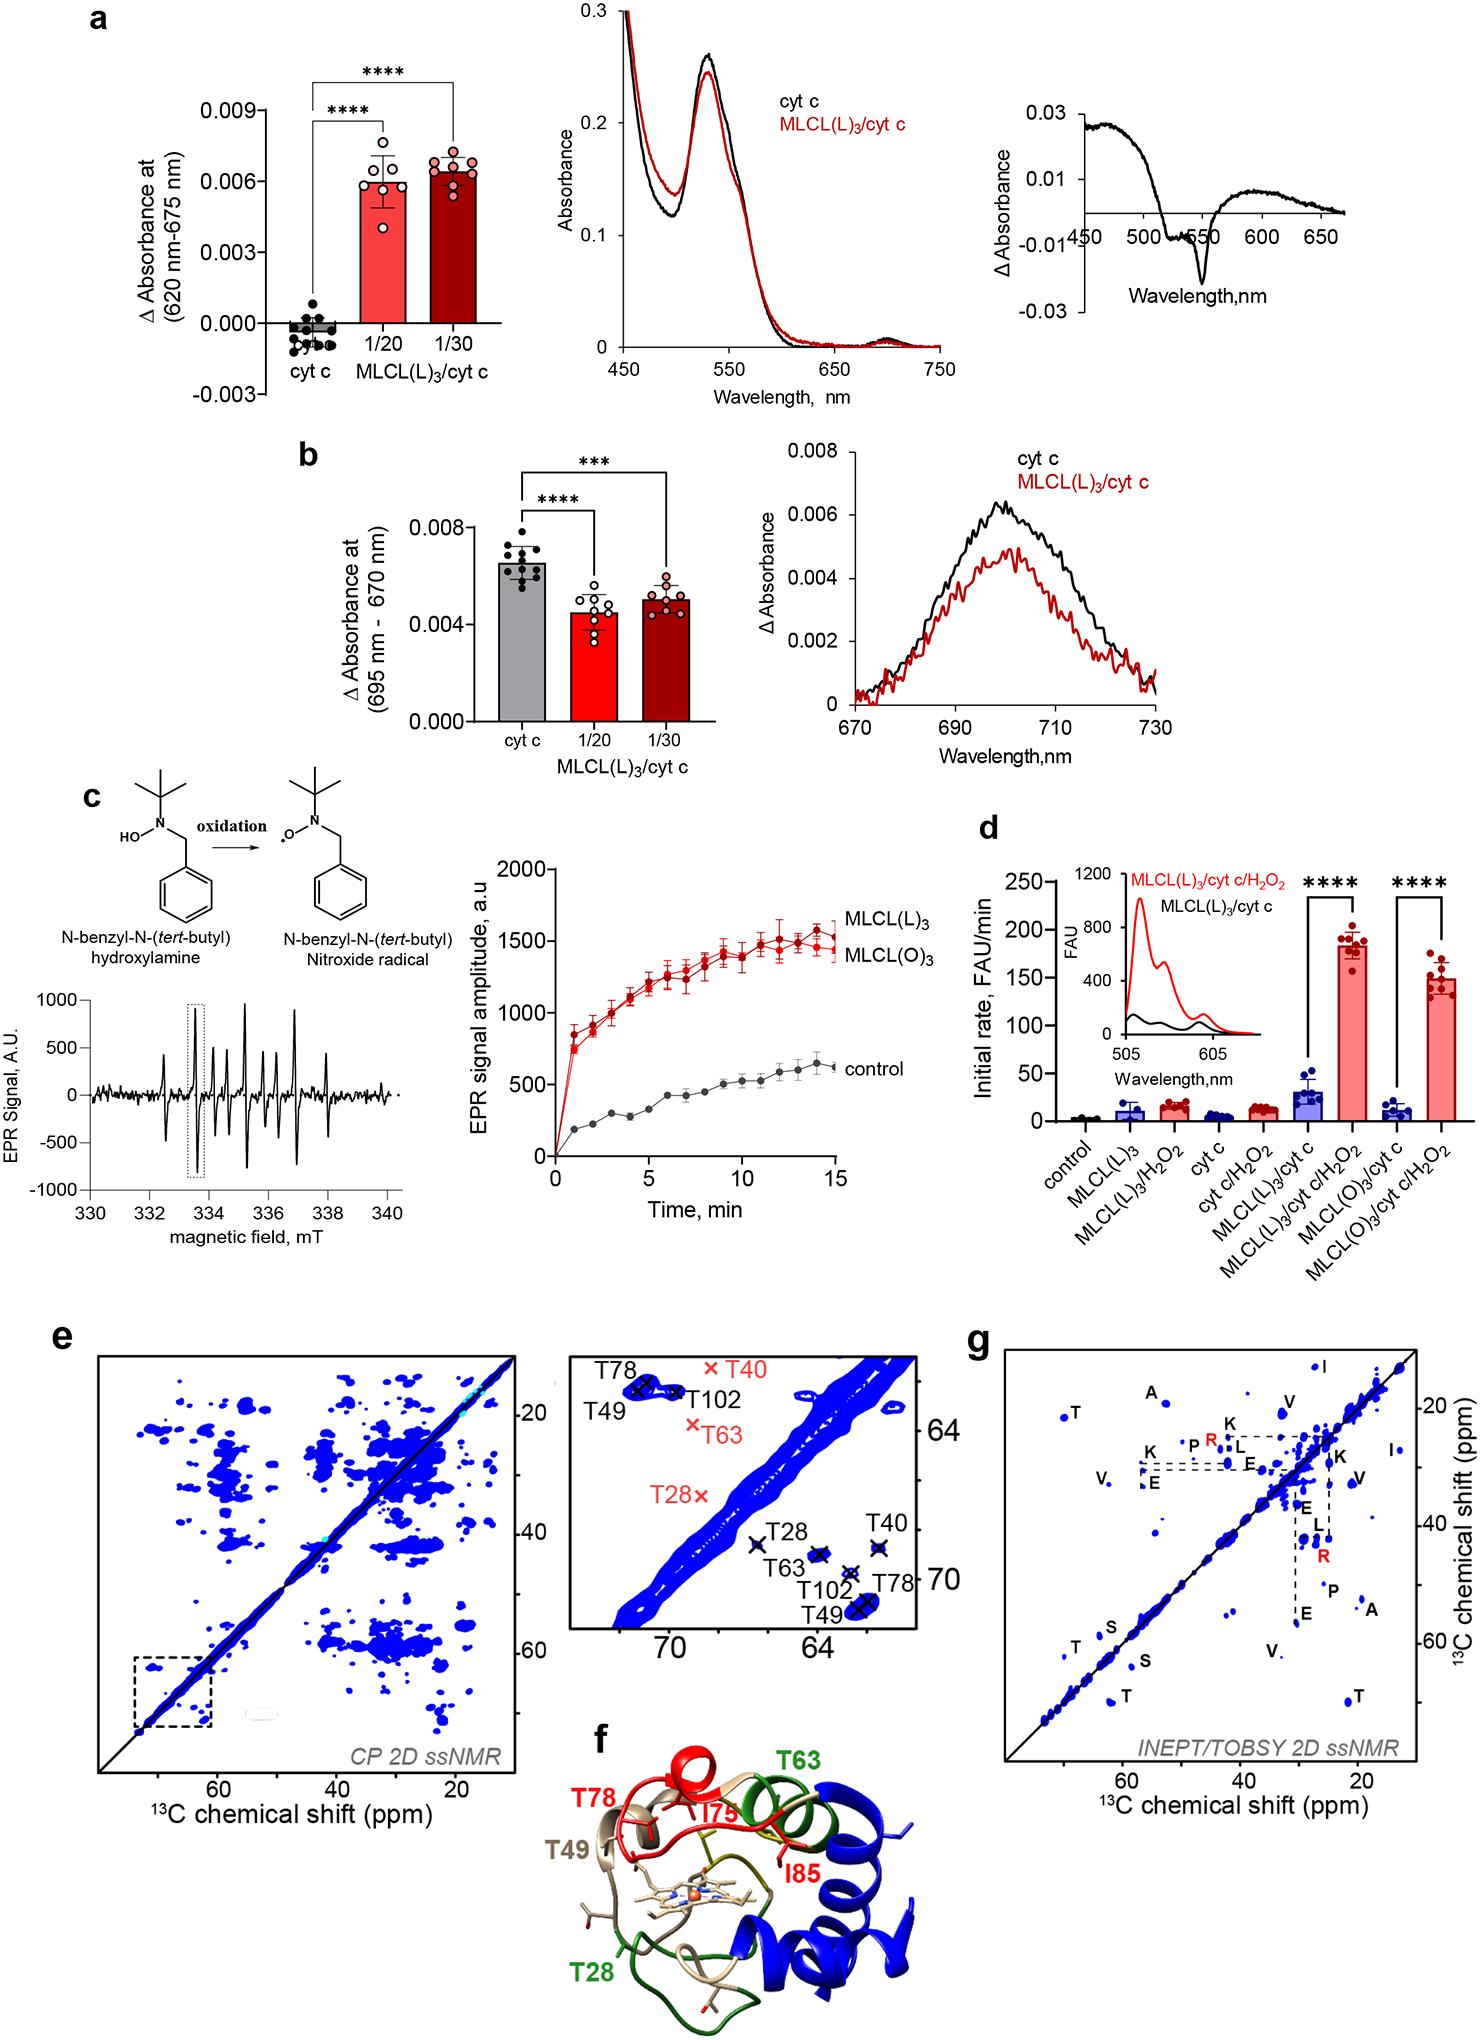
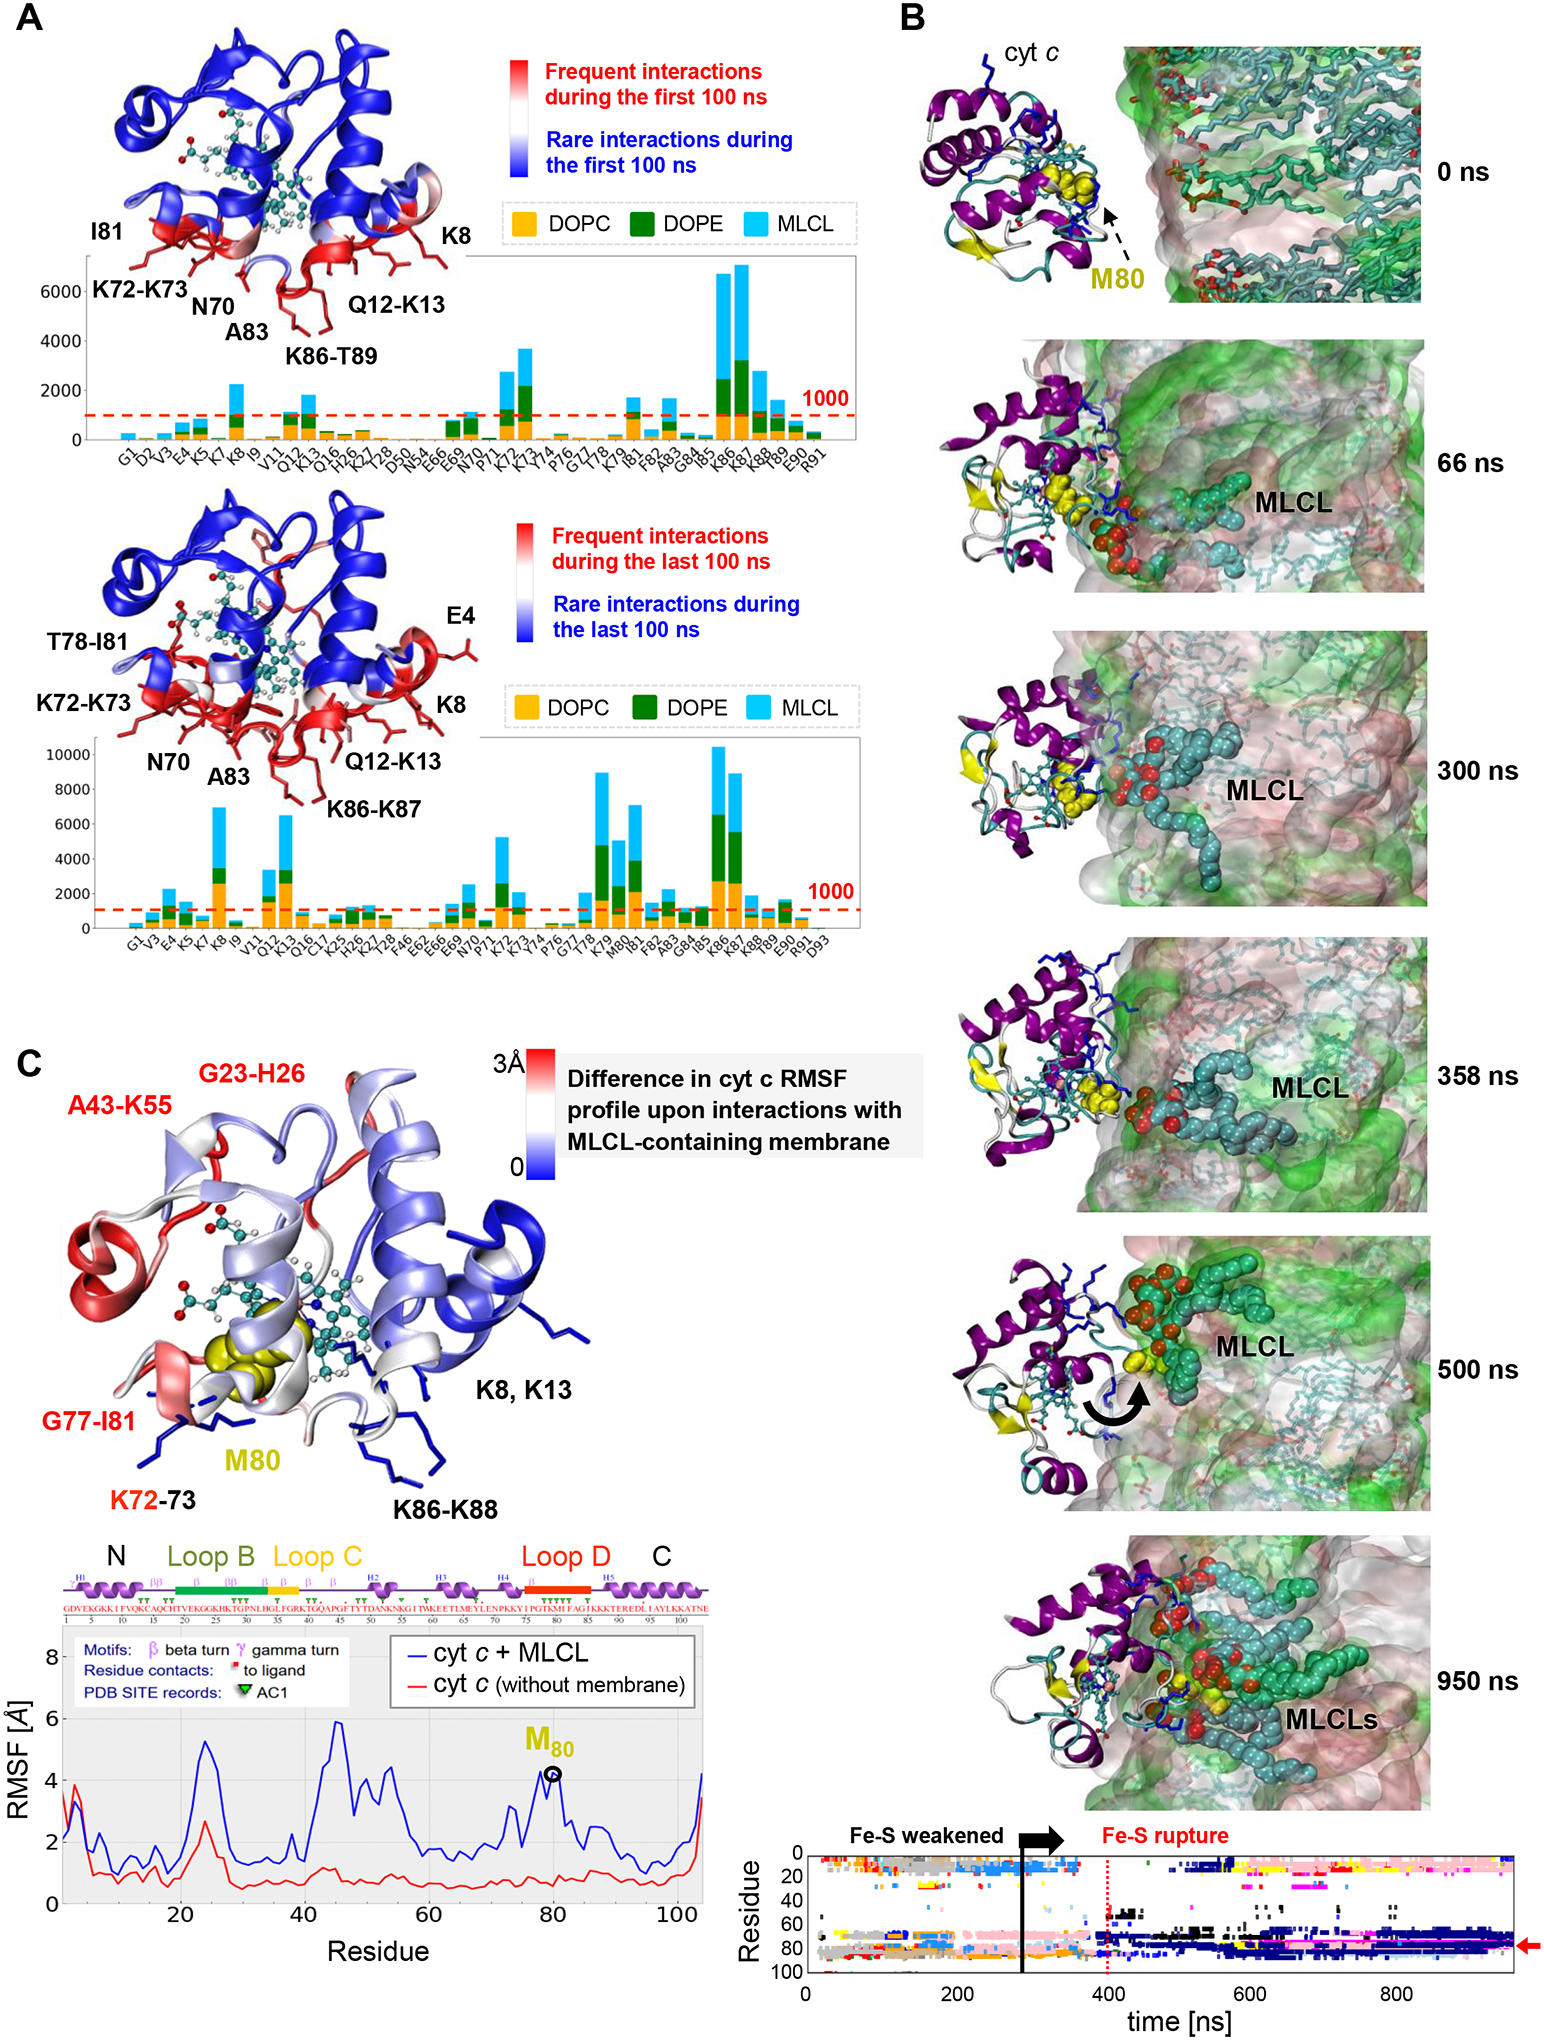
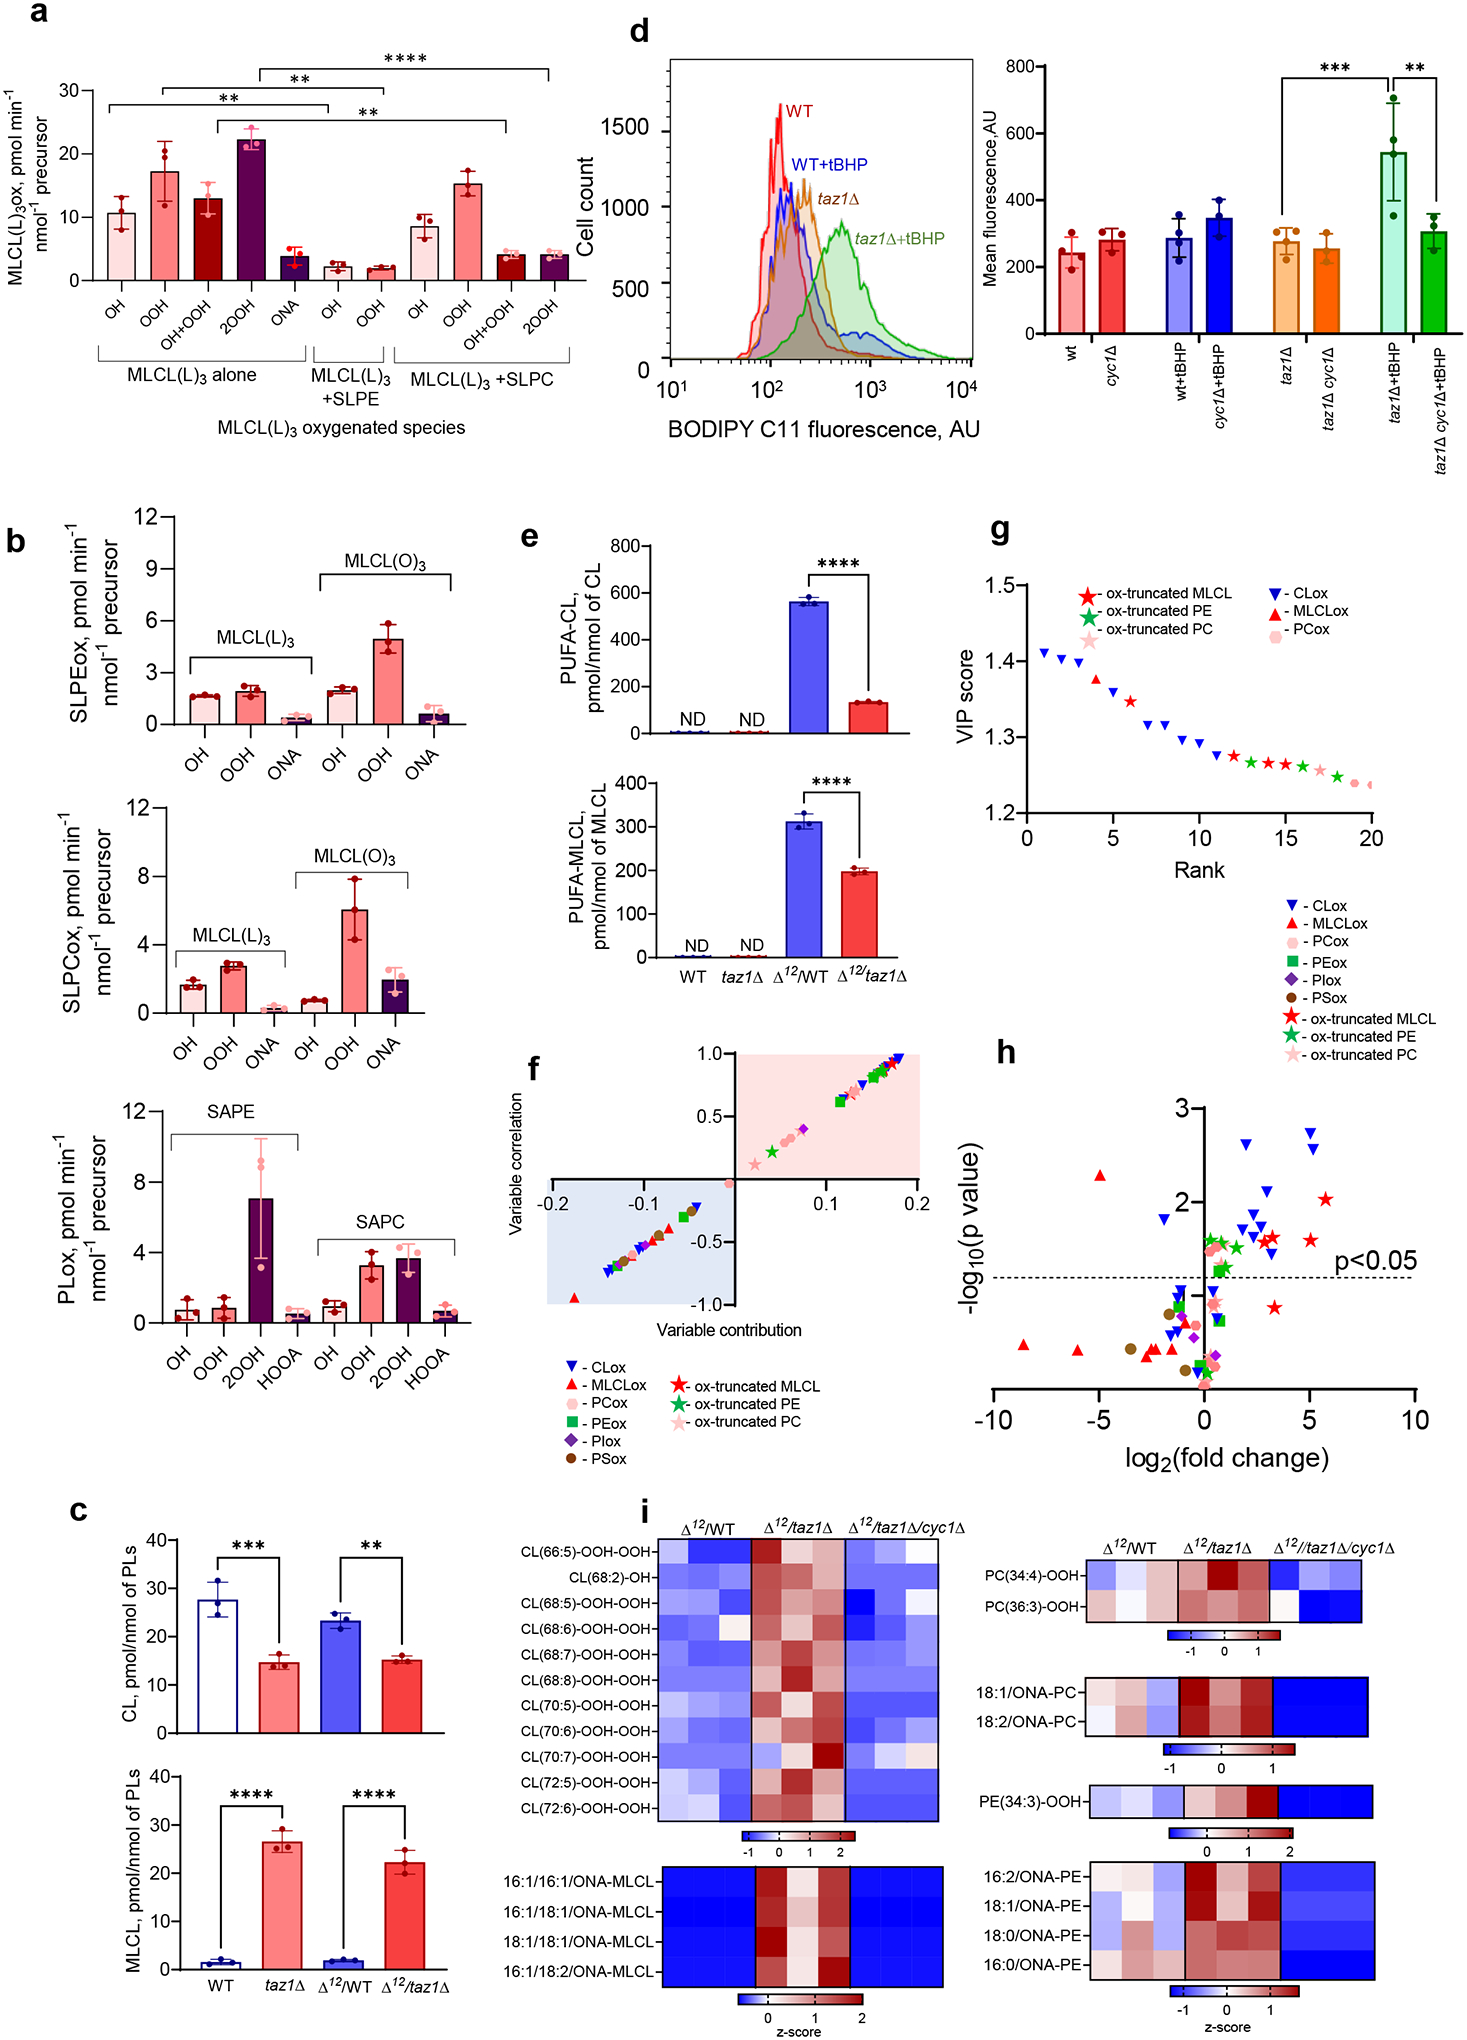
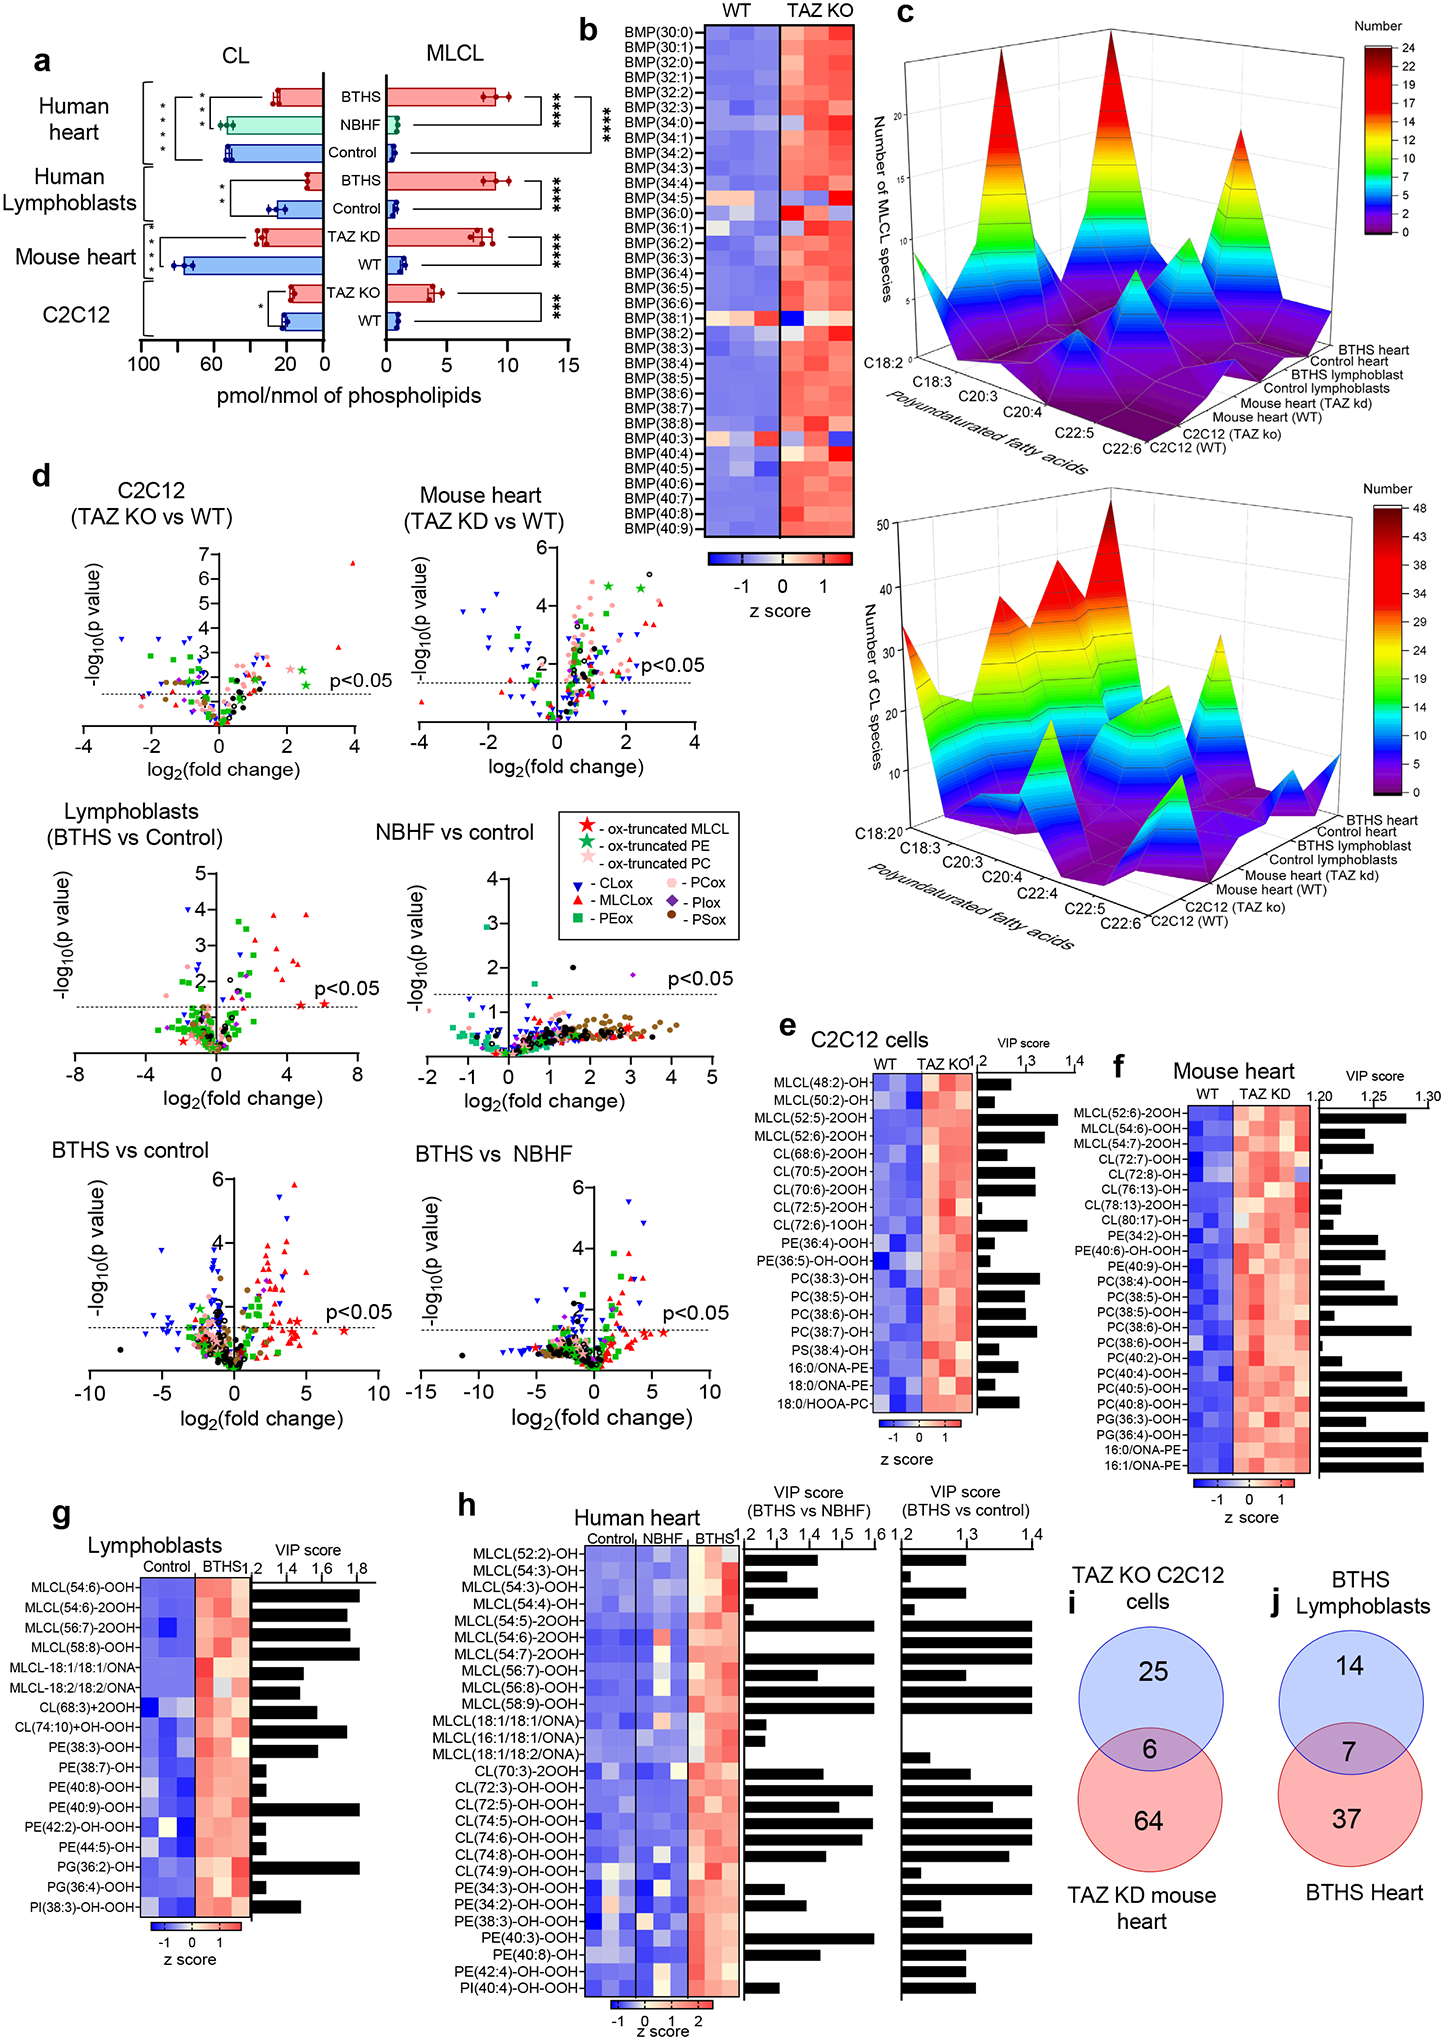
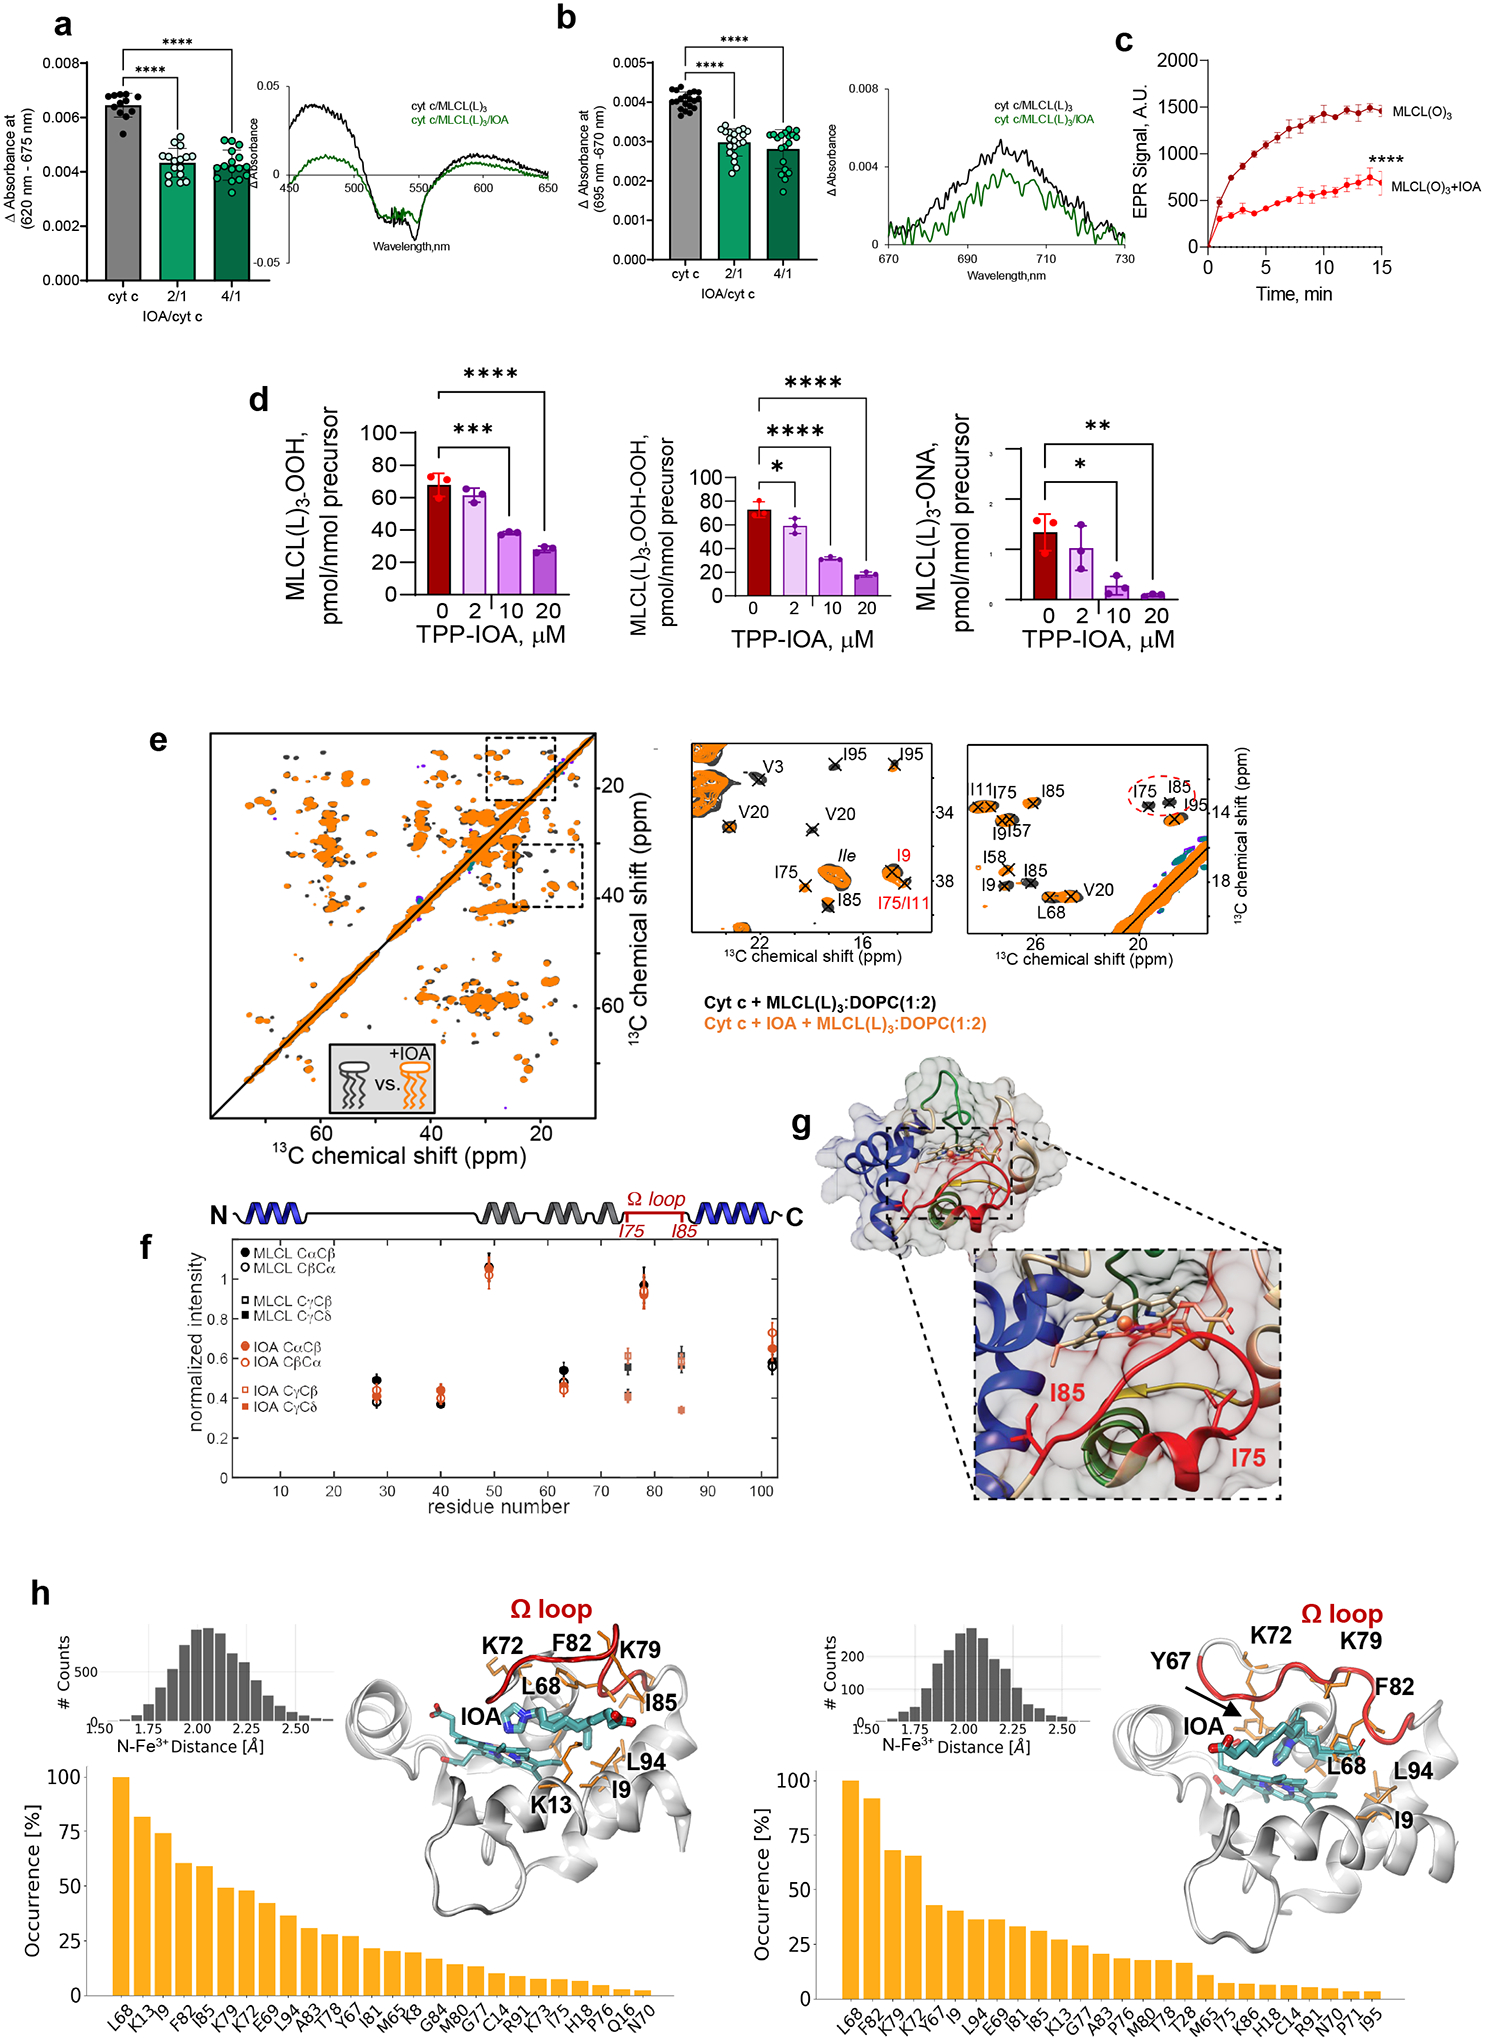
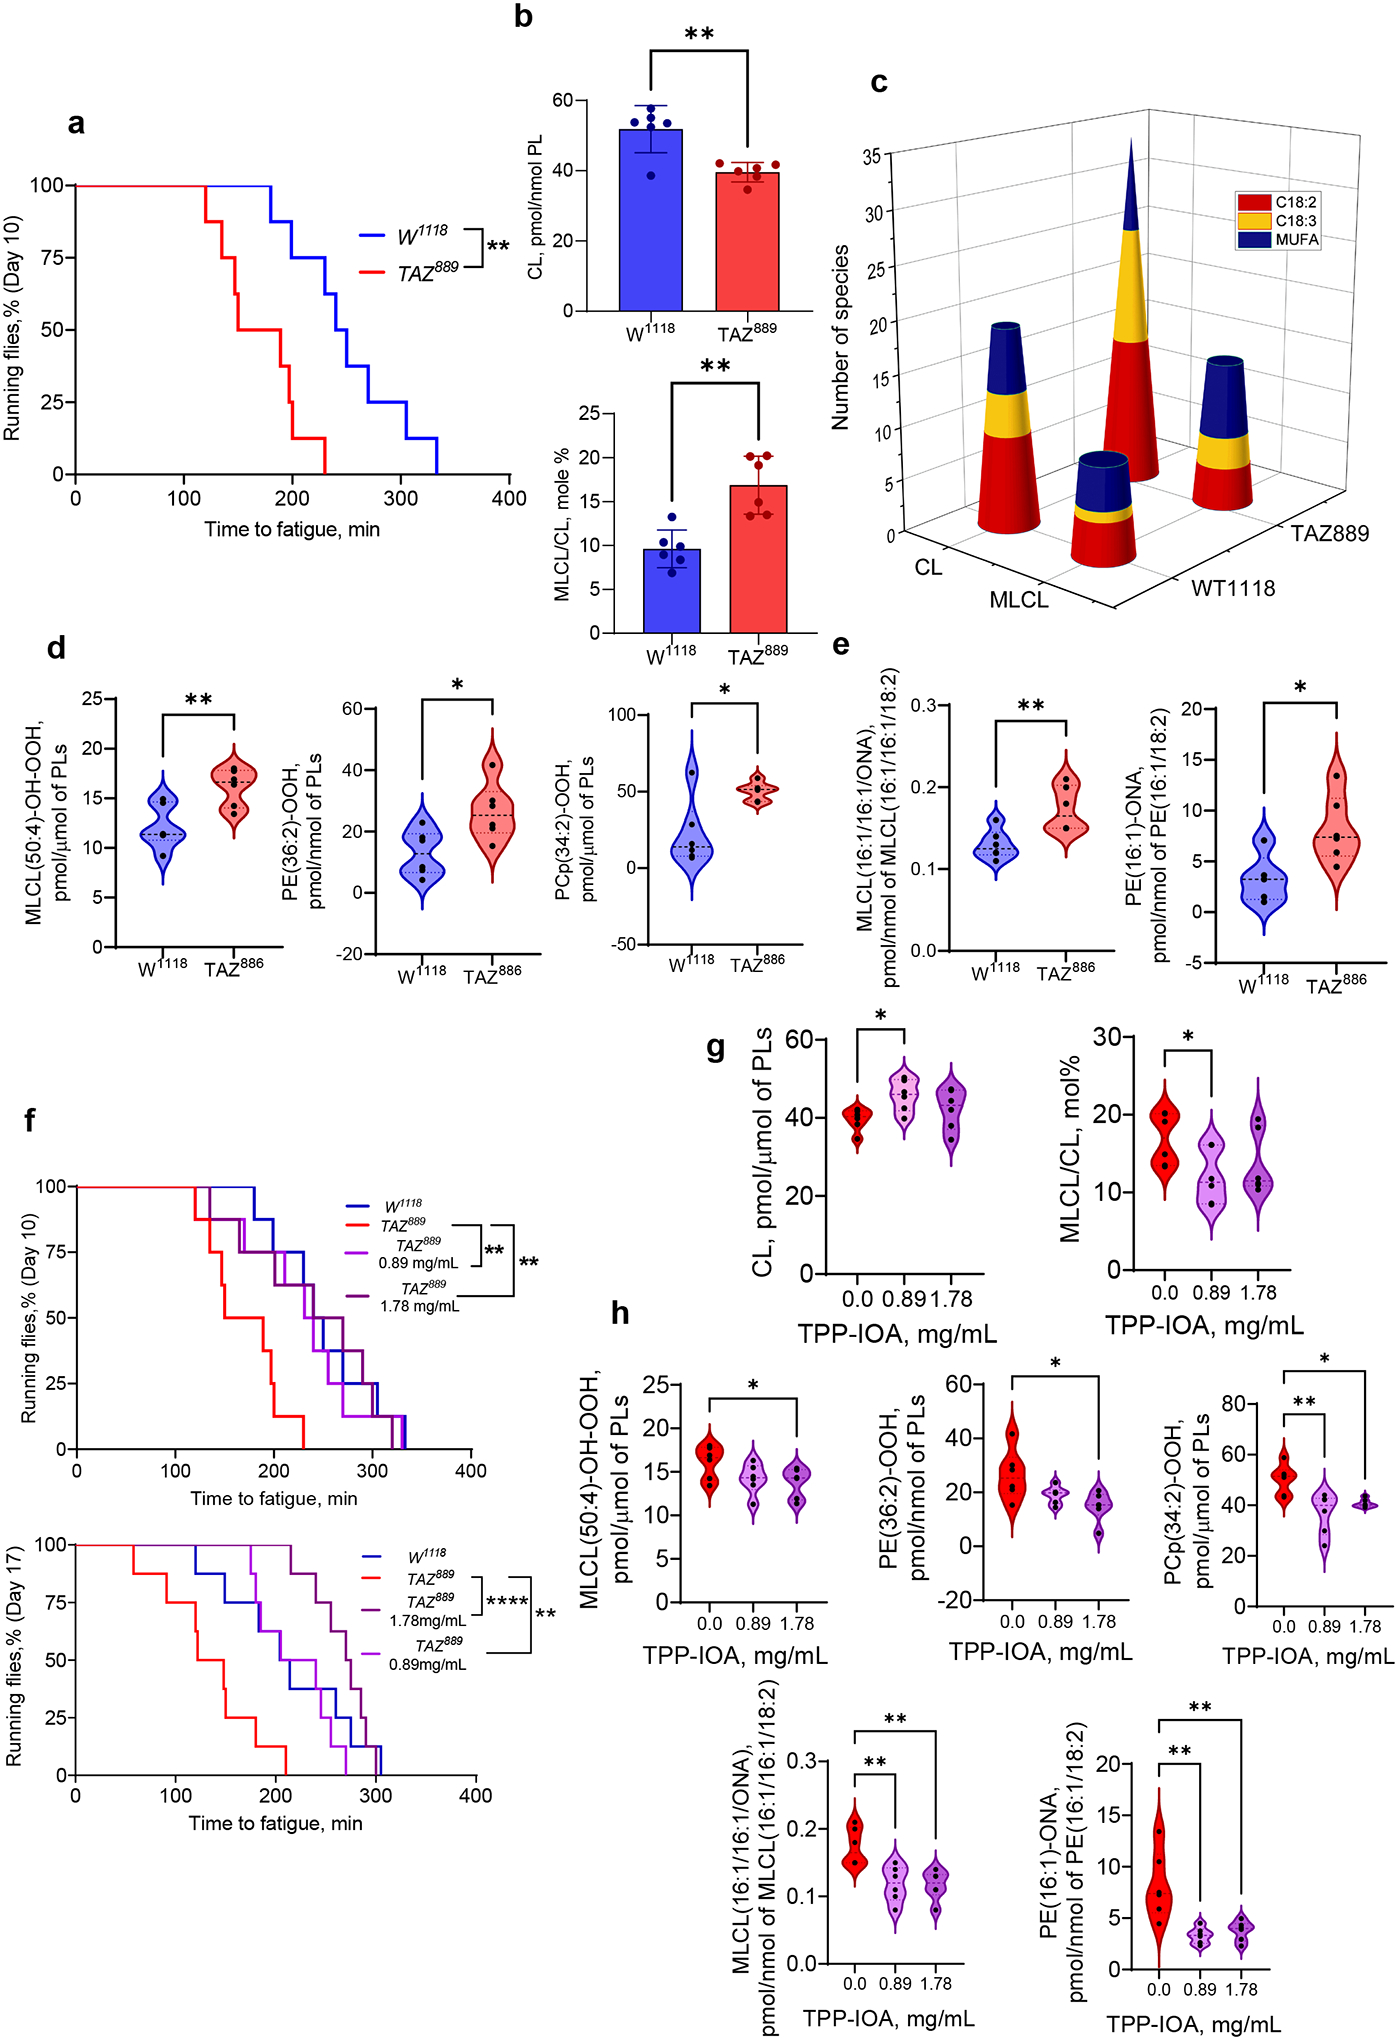
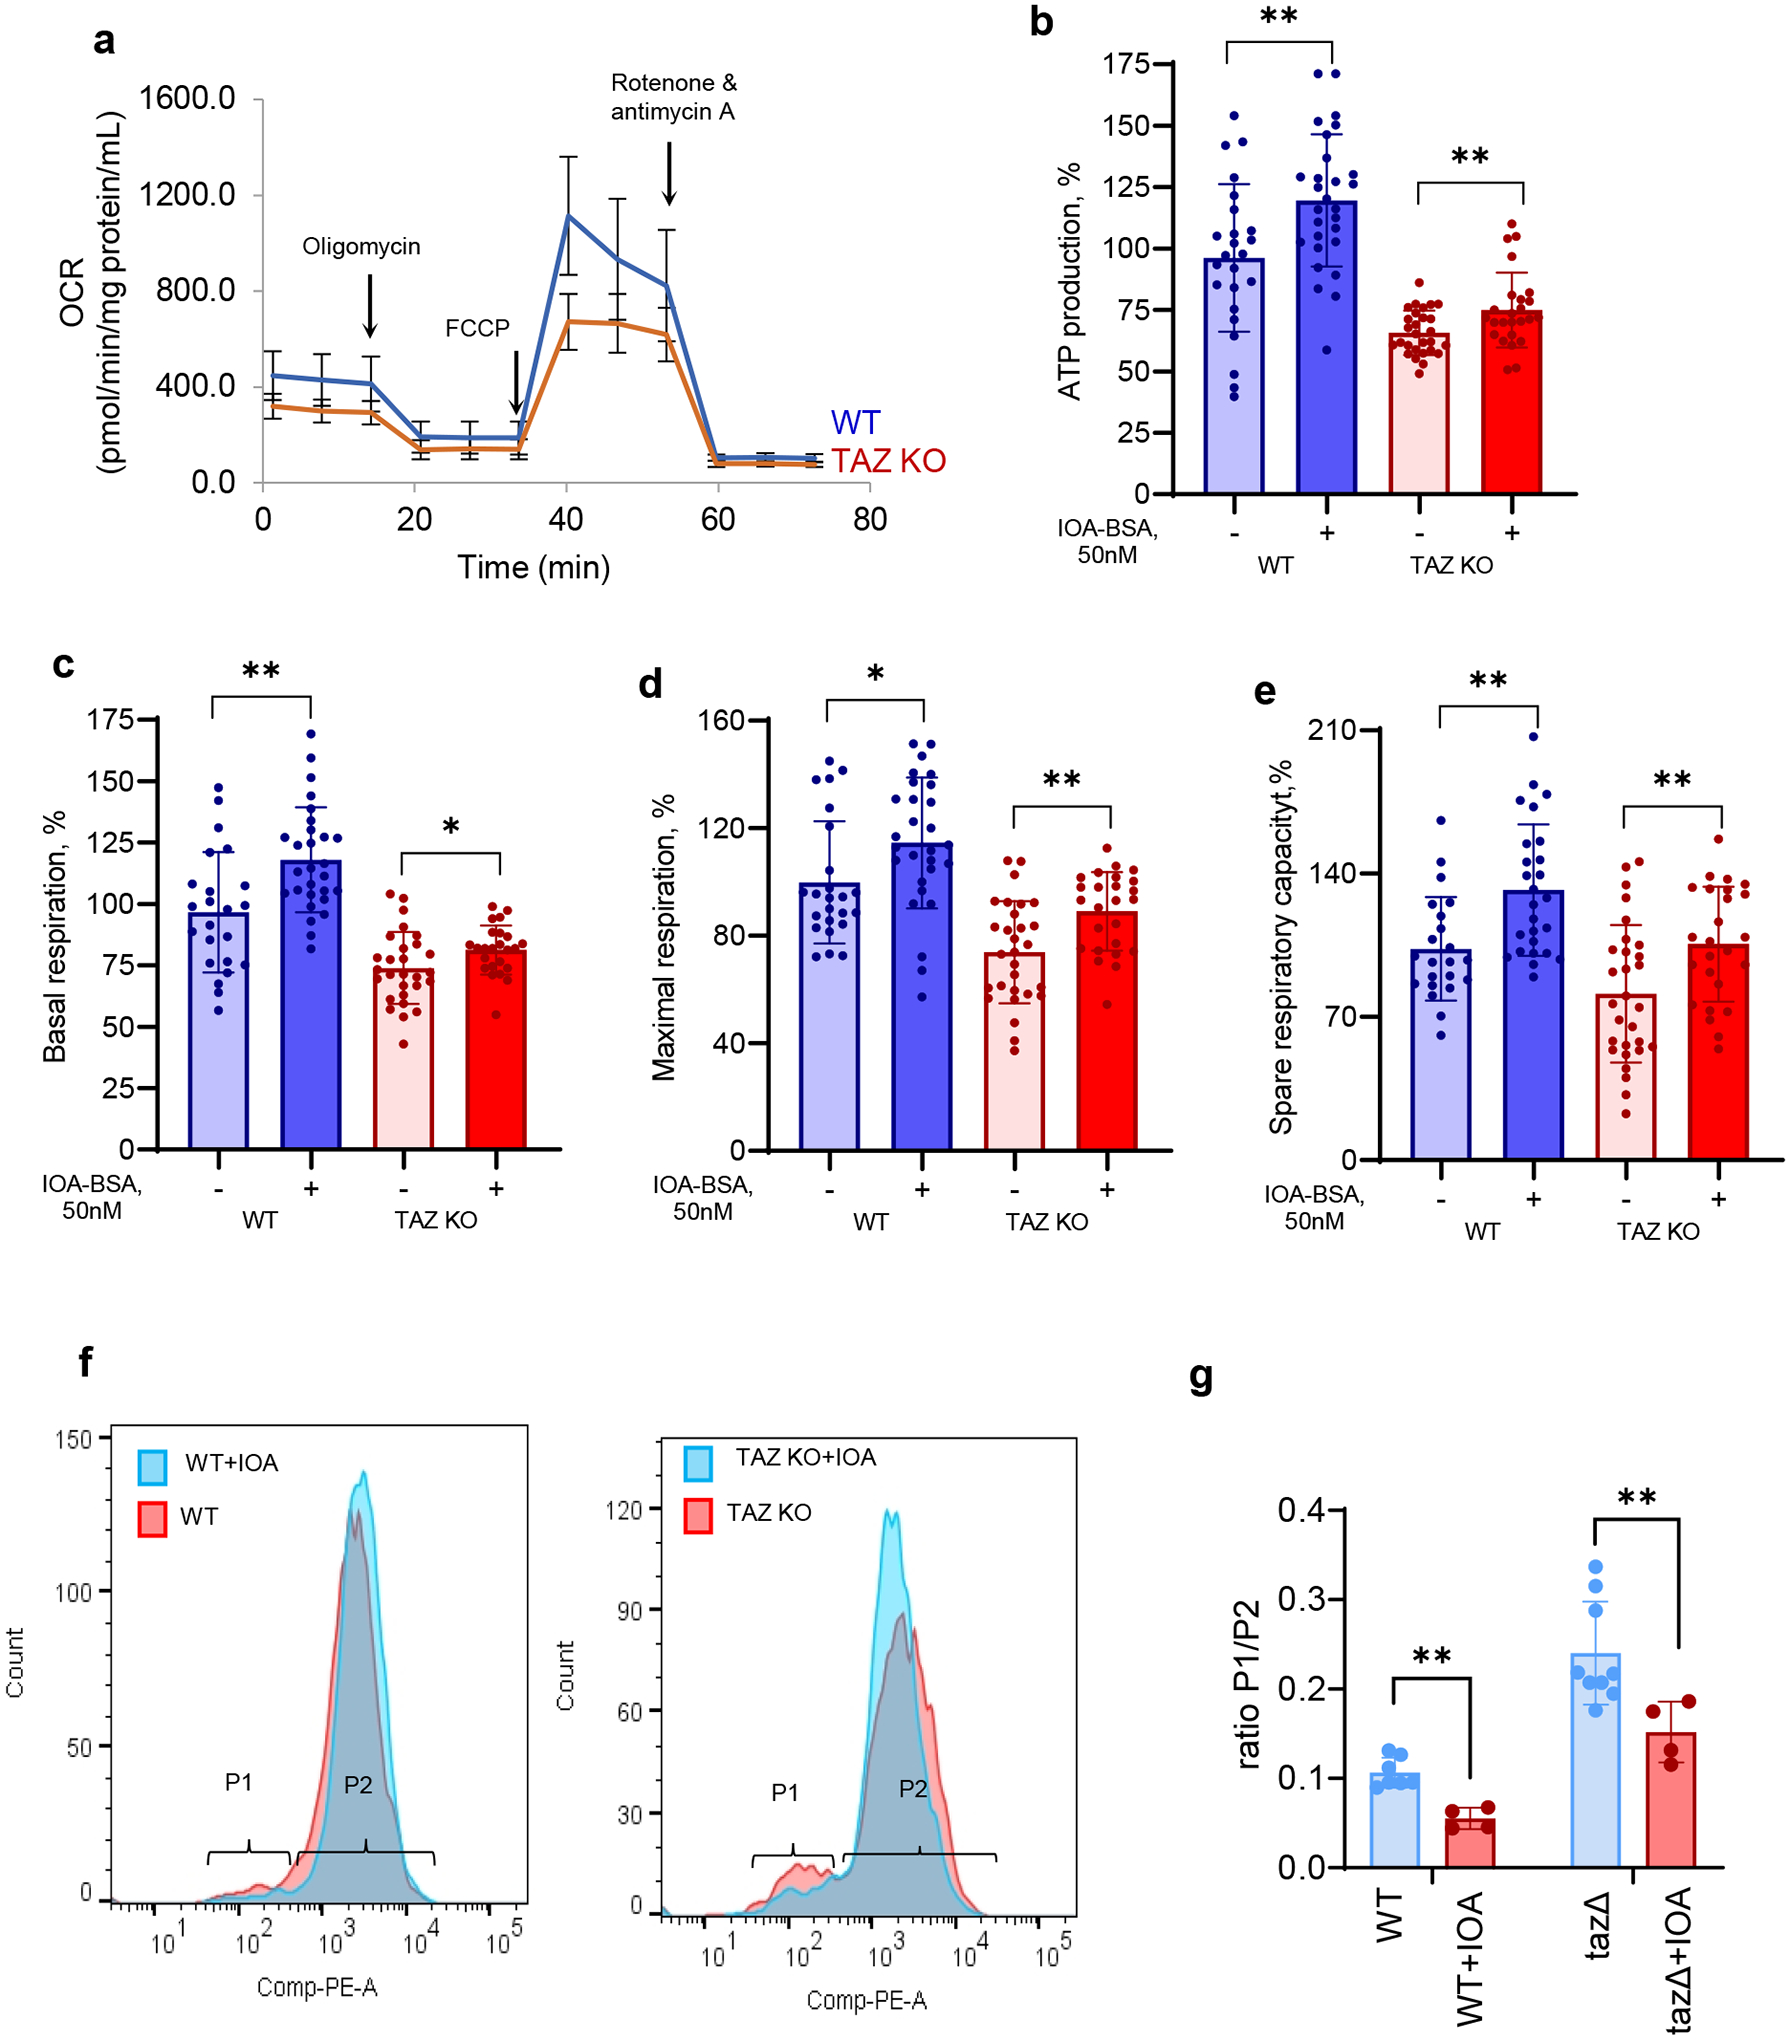
Barth syndrome (BTHS) is a life-threatening genetic disorder with unknown pathogenicity caused by mutations in TAFAZZIN (TAZ) that affect remodeling of mitochondrial cardiolipin (CL). TAZ deficiency leads to accumulation of mono-lyso-CL (MLCL), which forms a peroxidase complex with cytochrome c (cyt c) capable of oxidizing polyunsaturated fatty acid-containing lipids. We hypothesized that accumulation of MLCL facilitates formation of anomalous MLCL-cyt c peroxidase complexes and peroxidation of polyunsaturated fatty acid phospholipids as the primary BTHS pathogenic mechanism. Using genetic, biochemical/biophysical, redox lipidomic and computational approaches, we reveal mechanisms of peroxidase-competent MLCL-cyt c complexation and increased phospholipid peroxidation in different TAZ-deficient cells and animal models and in pre-transplant biopsies from hearts of patients with BTHS. A specific mitochondria-targeted anti-peroxidase agent inhibited MLCL-cyt c peroxidase activity, prevented phospholipid peroxidation, improved mitochondrial respiration of TAZ-deficient C2C12 myoblasts and restored exercise endurance in a BTHS Drosophila model. Targeting MLCL-cyt c peroxidase offers therapeutic approaches to BTHS treatment.


Conflict of interest statement

Declaration of interests: “The authors declare no competing interests.”

Figures

Extended Data Fig. 1
Extended Data Fig. 1. SSNMR analysis of structural and dynamic rearrangements in the cyt c peroxidase complex with MLCL.
a, Region from the 2D CP-DARR spectrum of 15N,13C labeled cyt c bound to DOPC:MLCL(L)3 (1:1; blue). Overlaid red contours show simulated peak patterns constructed from the solution NMR shifts of the N- and C-terminal a-helices (BMRB ID 25908). b, 2D 15N-13C NCA ssNMR spectrum of the same sample, along with a corresponding simulated spectrum for the N- and C-terminal a-helices. The simulated peaks from the blue foldon coincide with strong peaks in the experimental ssNMR spectra. c, 2D (CP-based) 15N-13C NCA ssNMR spectrum of membrane-bound cyt c, alongside the analogous simulated spectrum (d) for cyt c in solution (BMRB ID 25908). Key resonances missing in the experimental spectrum (c) are indicated with green circles; these mostly belong to the Ω-loop D (e.g. Met80 and Ile81). These 2D NCA ssNMR spectra were acquired at 253 K and 10 kHz MAS. e, 1D 13C INEPT, CP, and direct excitation spectra of 15N,13C labeled cyt c bound to DOPC:MLCL(L)3 (1:1), measured at 278K. These DYSE ssNMR spectra detect flexible (INEPT), rigid (CP), or both (direct excitation) sample components. The liquid crystalline lipids contribute many peaks to the INEPT spectrum (marked with blue arrows), while the labeled protein dominates the other two spectra. f, Overlay of 2D INEPT-TOBSY spectra for 15N,13C-labeled cyt c bound to MLCL/DOPC (blue) and CL/DOPC (red) vesicles. Cross-peaks stem from the labeled protein and must reflect flexible residues. Many more (and stronger) peaks are seen for MLCL-bound cyt c.
Extended Data Fig. 2
Extended Data Fig. 2. 31P ssNMR analysis of MLCL-induced structural and dynamic changes in the lipid membrane.
a, 1D 31P ssNMR static spectra of DOPC:MLCL (1:1) (blue) and DOPC:CL (1:1) (red) vesicles with with bound cyt c. b, Analogous 31P NMR spectra in absence of cyt c. Panels (a,b) show that the presence of MLCL results in a narrower extra component, that is neither isotropic nor reflects a typical non-bilayer phase. As previously discussed, (Powell and Marsh, 1985), these signals reflect MLCL in the liquid crystalline bilayer, undergoing distinct, increased dynamics (of the phosphate groups) compared to normal CL. c, 1D 31P ssNMR MAS spectra of DOPC:MLCL (1:1) at 10 kHz (blue curve) and 1.8 kHz (light blue curve) MAS rates. d, Zoomed-in region from (C) showing the isotropic peak (left) and first sideband (at 1.8 kHz MAS). Peak assignments are indicated, based on prior publications13,21 (Powell and Marsh, 1985; Li et al., 2019). Note that in the side bands, the PC signals are strong, one MLCL signal is partly retained and one MLCL signal is attenuated or missing. This is consistent with the shown assignments and cited literature.
Extended Data Fig. 3
Extended Data Fig. 3. Final shapshots from simulations of cyt c – membrane interactions and superposition of the conformations of cyt c reached after 100 ns runs.
a, Final shapshots from simulations of cyt c – membrane interactions, and residues making frequent contacts with MLCL. Final conformations of cyt c reached after 100 ns in twenty independent MD trajectories. Red labels denote the systems which were further extended to 300 ns. The colors of the components of the membrane are following: DOPC – in orange, DOPE – in green, MLCL – in transparent blue. b, Superposition of the conformations of cyt c reached after 100 ns runs, in a system without membrane which contained Fe-S bond (sharp structure) and two independent runs where the bond was drastically weakened (transparent structures). All final conformations of heme group are displayed as grey shadow balls-sticks. c, Final conformations of cyt c after association with the membrane, observed in four runs MD1-MD4 (labeled). The white arrow in the upper left panel shows the residue M80 which inserted deep into the membrane, being trapped by several MLCL molecules, also shown in Fig. 2b.
Extended Data Fig. 4
Extended Data Fig. 4. Peroxidase activity of cyt c/MLCL complex causes phospholipid peroxidation in vitro and induces changes in lipidome and oxy-lipidome of genetically manipulated yeast.
MS/MS spectra of (a) HOO-MLCL(L)3 (left panel) and oxidatively truncated ONA-MLCL(L)3 (right panel), (b) PC(18:0/18:2-OOH) (left panel) and PE(18:0/18:2-OOH) (right panel), (c) PC(18:0/ONA) (left panel) and PE(18:0/ONA) (right panel). Possible structures of oxidation products are inserted. ONA- 9-oxo nonanoic acid. d, Typical MS spectra of CL (upper panels) and MLCL (lower panels) obtained from yeast cells. e, Effect of D12desaturase on composition of CL (left panel) and MCL (right panel) in WT and taz1D yeasts. SFA – saturated fatty acids, MUFA – monounsaturated fatty acids, PUFA – polyunsaturated fatty acids. f, Content of PC (upper panels) and PE (lower panels) molecular species in WT and D12/taz1D cells. Data are presented as mean values ± SD. Each data point represents a biologically independent sample. Upper panels: left ****P<0.0001, middle ****P<0.0001, ***P=0.0004, right *P=0.0202, ***P=0.0001. ****P<0.0001. One-way ANOVA, Tukey’s multiple comparison test. Lower panels; left ****P<0.0001, middle **P=0.0115. ***P=0.0006, unpaired two-tailed t-test, ***P<0.0001, ****P<0.0001, One-way ANOVA, Tukey’s multiple comparison test. right ***P=0.0056, unpaired two-tailed t-test, ****P<0.0001, One-way ANOVA, Tukey’s multiple comparison test. g, OPLS-DA analysis showing the differences in oxy-lipidomes of D12 and D12/taz1D yeast cells; h, Pie plots showing the number of oxidatively modified phospholipid species. In total, 60 oxygenated phospholipid species were detected in yeast cells.
Extended Data Fig. 5
Extended Data Fig. 5. TAZ deficiency induces the changes in phospholipidome of mouse myoblasts and human lymphoblasts in vitro and mouse and human heart in vivo.
a, Table: Human heart biopsy sample description. Typical spectra of MLCL (left panels) and CL (right panels) obtained from WT and TAZ KO C2C12 cells (b), WT and TAZ KD mice (c), human lymphoblasts (d) and heart biopsy samples from control, non-BTHS-associated heart failure (NBHF) and BTHS-associated heart failure (BTHS) patients (e). TAZ deficiency in cells and mice and TAZ mutation in human results in a decrease of MLCL molecular species with C18:2 and appearance of MLCL molecular species containing C20:4 (shown in red); (f) Pie plots showing the total number of MLCL species in C2C12 cells, mouse heart, human lymphoblasts and heart samples from BTHD patients. (g) The score plots of OPLS-DA analysis show the differences in oxy-lipidomes in WT and TAZ ko cells, WT and TAZ KS mice, human control and BTHS lymphoblasts and control heart samples and BTHS heart samples.
Extended Data Fig. 6
Extended Data Fig. 6. Content of PE and PC species in cells, mouse heart, human lymphoblasts and human heart biopsy samples.
Extended Data Fig. 6. C2C12 cells a-d: a, Content of total diacyl-PC (left panel) and its molecular species (right panel); b, Content of total plasmalogen-PC (left panel) and its molecular species (right panel); c, Content of total diacyl-PE (left panel) and its molecular species (right panel); d, Content of total plasmalogen-PE (left panel) and its molecular species (right panel). Mouse heart (E-H): e, Content of total diacyl-PC (left panel) and its molecular species (right panel); f, Content of total plasmalogen-PC (left panel) and its molecular species (right panel); g, Content of total diacyl-PE (left panel) and its molecular species (right panel); h, Content of total plasmalogen-PE (left panel) and its molecular species (right panel). Human lymphocytes (i-l): i, Content of total diacyl-PC (left panel) and its molecular species (right panel); j, Content of total plasmalogen-PC (left panel) and its molecular species (right panel); k, Content of total diacyl-PE (left panel) and its molecular species (right panel); l, Content of total plasmalogen-PE (left panel) and its molecular species (right panel). Human heart biopsy samples (m-p): m, Content of total diacyl-PC (left panel) and its molecular species (right panel); n, Content of total plasmalogen-PC (left panel) and its molecular species (right panel); o, Content of total diacyl-PE (left panel) and its molecular species (right panel); p, Content of total plasmalogen-PE (left panel) and its molecular species (right panel).*p<0.05, **p<0.01. DB - double bond number.
Extended Data Fig. 7
Extended Data Fig. 7. Effect of TPP-IOA on structure of cyt c/MLCL peroxidase complex, with MLCL, lipid oxidation and the endurance of Drosophila melanogaster.
Effect of TPP-imidazole-oleic acid (TPP-IOA) on MLCL(L)3-dependent formation of heme iron high-spin forms assessed by absorbance at 620 nm (a) and absorbace at 695 nm (b). Inserts: the differential absorption spectra (a) and representative absorption spectra (b) of MLCL/cyt c with or without TPP-IOA. Data are presented as mean values ± SD. Each data point represents a biologically independent sample. ****p<0.0001, One-way ANOVA, Tukey’s multiple comparison test. (a) N=8 (control), N=6 (TPP-IOA/cyt c = 2/1), N=6 (TPP-IOA/cyt c = 4/1). (b) N=8 (control), N=10 (TPP-IOA/cyt c = 2/1), N=9 (TPP-IOA/cyt c = 4/1).(c) TPP-IOA inhibits accumulation of HOO-PE (left panel) and oxidatively truncated PE (right panel) species formed in MLCL(L)3/cyt c driven reaction. Data are presented as mean values ± SD. N=3. Each data point represents a biologically independent sample. Right panel: *p=0.0287, ****p<0.0001, Left panel: ***p=0.0007, ****p<0.0001. One-way ANOVA, Tukey’s multiple comparison test. (d) Normalized peak intensity values from 13C-13C ssNMR spectra of cyt c bound to DOPC:MLCL(L)3 (1:1; blue), or DOPC:MLCL(L)3 (2:1) LUVs in the absence (black) and presence (orange) of a four-fold excess of IOA with respect to protein (1:40 P/L ratio). Shown are the Ca/Cb (open) and Cb/Ca (closed) peaks for Thr residues. Each residue shows two datapoints: one for either side of the diagonal: see Fig. 1f). Increasing the ratio of MLCL (over PC) caused a net decrease in peak intensities, signifying increased protein motion. Addition of the IOA inhibitor had a much more modest effect of the Thr peak volumes.
Extended Data Fig. 8
Extended Data Fig. 8. TAZ-deficiency induces changes in Drosophila melanogaster lipidome.
Typical mass spectra of MLCL (a) and CL (b) obtained from control (W1118) and (TAZ889) mutant flies. Content MLCL containing C18:2 (c) and C18:3 (d) in control w1118 and TAZ889 deficient flies. Lipidomics analysis was performed using 6 vials (n=20 fly torsos per vial). (c) *P=0.0401, **P<0.0015, ***P=0.0005 unpaired two-tailed t-test. (d) *P=0.0378, **P<0.0019, ****p<0.0001 unpaired two-tailed t-test. (e) TTP-IOA did not significantly affect the endurance of control flies. Endurance was measure using 8 vials (N=20 flies) and significance was determined by log-rank analysis., ns=not significant. (f) Content of CL (left panel) and MLCL (right panel) in control W1118 flies after feeding with TPP-IOA. Lipidomics analysis was performed using 6 vials (n=20 fly torsos per vial). For all violin plots presented, individual points including maximal and minimal are shown as black circles. Dashed black line indicates median and doted lines indicate quartiles.
Figure 1.
Figure 1.. Electronic and structural rearrangements occurring in MLCL/cyt c peroxidase complexes.
a, MLCL–dependent formation of heme-Fe high spin forms assessed by absorbance at 620nm (left panel). Data are presented as mean values ± SD, ****P<0.0001, one-way ANOVA, Tukey’s multiple comparison test. N=11 (cyt c), N=7 (MLCL(L)3/cyt c = 1/20), N=8 (MLCL(L)3/cyt c = 1/30). Each data point represents a biologically independent sample. b, Effect of MLCL on the absorption spectra of cyt c (75μM) (middle panel); the differential absorption spectrum produced by subtracting the spectrum of cyt c from the spectrum of MLCL/cyt c (right panel) MLCL induces decrease of the absorption at 695 nm indicating disruption of the M80-S-Fe coordination (left panel). Data are presented as mean values ± SD ***P=0.0001, ****P<0.0001, one-way ANOVA, Tukey’s multiple comparison test. N=12 (cyt c), N=7 (MLCL(L)3/cyt c = 1/20), N=8 (MLCL(L)3/cyt c = 1/30). Each data point represents a biologically independent sample. Absorption spectra of cyt c (75μM) with and without MLCL (right panel). c, Left panel: Typical EPR signal of N-benzyl-N-(tert-butyl)nitroxide radical generated by MLCL(O)4/cyt c complexes (lower panel). The underscored part of the spectrum was scanned repeatedly to measure the kinetics of radical formation. Structure of N-benzyl-N-(tert-butyl)nitroxide and its radical are inserted (upper panel). Rigth panel: Time courses of N-benzyl-N-(tert-butyl)nitroxide radical EPR signals generated by MLCL(L)3/cyt c, and MLCL(O)3/cyt c complexes. Control: N-benzyl-N-(tert-butyl)nitroxide radical EPR signals generated by cyt c/H2O2 in the absence of MLCL. Data are presented as mean values ± SD, N=3 (control), N=4 (MLCL(L)3), N=4 (MLCL(O)3) biologically independent samples. d, Oxidation of BODIPY-C11 by MLCL/cyt c complexes. Data are presented as mean values ± SD, ****P<0.0001, one-way ANOVA, Tukey’s multiple comparison test. N=4 (control), N=3 (MLCL(L)3), N=6 (MLCL(L)3/H2O2), N=9 (cyt c), N=9 (cyt c/H2O2), N=8 (MLCL(L)3/cyt c), N=8 (MLCL(L)3/cyt c/H2O2), N=6 (MLCL(O)3/cyt c), N=9 (MLCL(O)3/cyt c/H2O2), biologically independent experiments. Insert: Fluorescence emission spectra of BODIPY oxidized by MLCL(L)3/cyt c in the absence and presence of H2O2 (excitation = 495 nm). e, 2D CP-based ssNMR spectrum of labeled cyt c bound to DOPC:MLCL(L)3 (1:1) vesicles (left). The region marked with a dashed box show key threonine peaks, and is also shown enlarged to the right, with residue assignments indicated. f, Structure of cyt c, with color-coding showing relative stability of the native fold segments (colored red< green< blue). The heme group, threonine residues (T28, T49, T63, and T78) and Ω-loop residues I75 and I85 that line the heme binding pocket are shown as sticks. g, 2D INEPT-TOBSY ssNMR spectrum showing the assignments for observed residues with high flexibility. The ssNMR was performed at 600 MHz (1H) and 253 K (e) or 278 K (g).
Figure 2.
Figure 2.. Simulations reveal close association of M80 with MLCLs driving the opening of the heme-binding pocket.
a, Distribution of contacts between cyt c residues and lipid molecules DOPE, DOPC and MLCL. Membrane-binding residues of cyt c (located within 4.5 Å from the membrane) observed during the first 100 ns (upper panel), and the last 100 ns (lower panel) of multiple 700–950 ns long MD simulations were recorded at fixed (50 ps) intervals, to quantitatively determine the most probable interactions. The bar plot shows the number of contacts made by selected cyt c residues (abscissa) with different types of lipid molecules (color-coded as labeled). Red dashed line indicates the threshold for frequent contacts; the corresponding residues are colored red in the ribbon diagram, where the heme group is also displayed in stick representation. b, Time evolution of conformational changes in the Ω-loop I75-I85 (cyan sticks/lines) containing M80 (yellow spheres) and its interactions with MCL, observed during MD simulations (0 < t < 950 ns). The top six panels depict the evolution of interactions, and the bottom plot provides a quantitative summary of the interactions between cyt c residues and multiple MLCL molecules (each shown by a different color). In the top six panels, the lipid bilayer is in surface representation with lipid molecules in sticks at t = 0 (top panel), and the MLCL is in cyan spheres (with the phosphate groups in red) in all panels except t = 0. The interaction involves various stages: (i) During the first 332 ns the Fe-S bond remains intact. It is completely ruptured at 415 ns, preceeded by small extensions at t = 332 and 368 ns, (ii) During the interval 415 < t <500 ns, M80 gains an increase in mobility, and (iii) at t ≥ 500 ns M80 is trapped by several MLCLs (bottom panel). The lower panel shows the time evolution of contacts between cyt c residues and MLCL molecules (different colors for different MLCLs). The red arrow points to interactions of M80 with multiple MLCLs (atom-atom contacts within 4.5 Å). See Movie 3 for a visualization. c, RMSF profile of cyt c residues in the last 100 ns of two sets of MD runs, one in the presence of membrane (blue curve, averaged over four runs) and the other in water (no membrane) (red curve, average over two runs). The crystal structure of cyt c is colored by the relative size of fluctuations (RMSFs in the presence of the membrane minus those in its absence, in Å). Dark red regions (G23-H26, K72, G77-I81) exhibit enhanced mobilities in the presence of a membrane upon interactions with MLCL; wherease dark blue regions (K8, K13, K86-K88) are less flexible being associated with the lipid head groups.
Figure 3.
Figure 3.. Peroxidase activity of the MLCL/cyt c complex causes phospholipid peroxidation in vitro and induces changes in the lipidome and oxy-lipidome of genetically-manipulated yeast.
a, MLCL/cyt c complexes cause peroxidation of PUFA-phospholipids in a model system. Initial rate of formation of different MLCL(L)3 oxidation products generated by MLCL(L)3/cyt c complexes in the absence and presence of PUFA-PL (stearoyl-linoleoyl-PE, SLPE or stearoyl-linoleoyl-PC, SLPC). Data are presented as mean values ± SD. Significant differences were determined by unpaired t-test, N=3; **P=0.0054 (MLCL(L)3 alone vs MLCL(L)3+SLPE), **P=0.005 (OH MLCL(L)3 alone vs OH MLCL(L)3+SLPC), **P=0.0039 (OH/OOH MLCL(L)3 alone vs OH/OOH MLCL(L)3+SLPC), **p=0.005 (OOH MLCL(L)3 alone vs OOH MLCL(L)3+SLPC), ****p<0.0001 (2OOH MLCL(L)3 alone vs 2OOH MLCL(L)3+SLPC). Each data point represents a biologically independent experiment. b, Generation of SLPE (upper panel) and SLPC (middle panel) oxidation products by MLCL(L)3/cyt c and MLCL(O)3/cyt c complexes. Data are presented as mean values ± SD. N=3. Generation of SAPE and SAPC oxidation products by MLCL(L)3/MLCL(O)3 (1:3)/cyt c complexes (lower panel). OH (hydroxy), OH/OOH (hydroxy/hydroperoxy), OOH (hydroperoxy), 2OOH (di-hydroperoxy) species.OH (hydroxy species), OOH (hydroperoxyl species), 2OOH (di-hydroperoxy species), ONA (9-oxo-nonanoic acid) and HOOA (5-hydroxy-8-oxooct-6-enoic acid) species. N=3. Each data point represents a biologically independent experiment. c, Content of total CL (upper panel) and MLCL (lower panel) in WT, taz1Δ, Δ12/ WT, and Δ12/taz1Δ yeast cells. Data are presented as mean values ± SD. Significant differences were determined by one-way ANOVA, Tukey’s multiple comparison test. **P=0.0077, ***P=0.0004, ****P<0.0001; Each data point represents a biologically independent experiment. d, Detection of lipid peroxidation by BODIPY-C11 581/591 in yeast cells. (Gating strategy is shown on Supplementary Fig.1). Oxidation of BODIPY-C11 results in increased fluorescence emission at 510 nm, which is depicted as a rightward shift in the median green FL1 fluorescence intensity (MFI) histogram (left panel). The Y-axis corresponds to the number of cells displaying a given MFI (X-axis). Quantitative assessment of mean fluorescence of shifted peak (right panel). Data are presented as mean values ± SD. Statistical significance was analyzed using a one/two-sided Student’s t-test **p=0.0344, ***p=0.0083. N = 3–4 biologically independent samples. e, Content of PUFA-CL (upper panel) and PUFA-MLCL (lower panel) in WT, taz1Δ , Δ12/WTand Δ12/taz1Δ yeast cells. Data are presented as mean values ± SD. Significant differences were determined by one-way ANOVA, N=3; ****P<0.0001; f, S-plot of OPLS-DA analysis of Δ12/WT and Δ12- taz1Δ yeast lipidomes showing variable correlation versus variable contribution to the OPLS-DA model. g,The variable importance in projection (VIP) score plots reflect the significance of variables for the OPLS-DA models. The VIP>1 was considered to be a statistically significant difference between the two groups. Data are presented for up to 20 phospholipid molecular species. h, Volcano plot showing the changes in the levels of oxygenated phospholipid species induced by TAZ deficiency. N=3, Significant differences were determined by unpaired t-test; i, Content of oxygenated and oxidatively truncated phospholipids in Δ12/WT and Δ12/taz1Δ yeast cells. Data are presented as heat maps auto-scaled to z scores and coded blue (low values) to red (high values).
Figure 4.
Figure 4.. TAZ deficiency induces changes in the phospholipidome of mouse and human cells and tissues.
a, Content of MLCL and CL in C2C12 cells, mouse heart, human lymphoblasts, and human heart samples. 2-tailed t-test, For MLCL: ***p=0.0002, ****p<0.0001, one-way ANOVA, Tukey’s multiple comparison test. For CL: *p=0.0189 (unpaired 2 tailed-t test), **p=0.0009, ***p=0.0002, ****p<0.0001, one-way ANOVA, Tukey’s multiple comparison test. Data are presented as mean values ± SD. N=3 biologicaly independent cells, N=3 and N=5 biologicaly indedendent control and TAZ ko mice, respectively, N=3 biologicaly independent human lymphoblasts and N=3 biologicaly independent human heart biopsy samples. b, Content of bis-monoacylglycerophosphate (BMP) in WT and TAZ-deficient cells. Data are presented as heat maps auto-scaled to z scores and coded blue (low values) to red (high values). c, Number of PUFA-MLCL (upper panel) and PUFA-CL (lower panel) species in C2C12 cells, mouse heart,human lymphoblasts, and human heart. d, Volcano plots showing significant changes in the levels of oxygenated phospholipid species induced by either TAZ deficiency in cells and mouse heart or TAZ mutation in human lymphoblasts and heart samples from BTHS patients. N=3–5; Significant differences were determined by unpaired two-tailed t-test. Content of oxygenated phospholipids in WT and TAZ-deficient cells (e), heart tissue obtained from WT and TAZ-KD mice (f), control and BTHS lymphoblasts (g) and control, NBHF, and BTHS heart samples (h). Data are presented as heat maps auto-scaled to z scores and coded blue (low values) to red (high values) (left panels), and bar graphs of the variable importance in projection (VIP) score plots that reflect the significance of variables for the OPLS-DA models (right panels). i, The two-way Venn diagram congregated oxygenated molecular species of phospholipids detected in TAZ-KO C2C12 myoblasts in vitro and heart of TAZ-KD mice in vivo. Six species (MLCL(52:6)-2OOH, PE(36:4)-OOH, PC(38:5)-OH, PE-16:0/ONA, PC(38:6)-OH, PC(40:7)-OH) common to TAZ deficiency were identified. The value in each area indicates the number of oxygenated molecular phospholipid species with significantly higher levels in TAZ groups vs WT by unpaired two-tailed t-test. j, The two-way Venn diagram congregated oxygenated molecular species of phospholipids detected in BTHS lymphoblasts and BTHS hearts. Seven MLCL species common to BTHS (MLCL(54:6)-2OOH; MLCL(54:7)-2OOH; MLCL(56:7)-OOH; MLCL(56:8)-OOH; MLCL(54:5)-2OOH; MLCL(58:9)-OOH; MLCL(18:1/18:1/ONA) were identified. The value in each area indicates the number of oxygenated molecular phospholipid species with significantly higher levels in BTHS groups vs respective control by unpaired twotailed t-test.
Figure 5.
Figure 5.. Effect of TPP-IOA on the structure of MLCL/cyt c peroxidase complexes, lipid oxidation.
Effect of IOA on MLCL-dependent formation of heme-Fe high-spin forms (a) and the absorbance at 695 nm b. Insert: representative absorption spectra of MLCL/cyt c with or without IOA. Data are presented as mean values ± SD. N=11 (cyt c), N=7 (IOA/cyt c = 2/1), N=8 (IOA/cyt c = 4/1). Each data point represents a biologically independent sample. ****P<0.0001. One-way ANOVA, Tukey’s multiple comparison test. c, Time-courses of N-benzyl-N-(tert-butyl)nitroxide radical EPR signal formed by MLCL(O)3/cyt c in the absence (dark red) and presence (light red) of IOA (10μM). Data are presented as mean values ± SD. N=3. One-way ANOVA, Tukey’s multiple comparison test. ****p<0.001. Each data point represents a biologically independent sample. d, TPP-IOA inhibits accumulation of hydroproxy-MLCL species - MLCL(L)3-OOH (left panel), dihidroperoxy MLCL species MLCL(L)3-OOH (middle panel) and oxidatively truncated MLCL(L)3-ONA species (right panel) formed in the MLCL(L)3/cyt c driven reaction. N=3. Data are presented as mean values ± SD. One-way ANOVA, Tukey’s multiple comparison test. For MLCL(L)3-OOH ***p=0.001,****p<0.0001. For MLCL(L)3-OOH-OOH *p=0.032, ****p<0.0001. For MLCL(L)3-ONA *p=0.0109, **p=0.0042. Each data point represents a biologically independent sample. e, 2D CP-ssNMR spectrum (left) and zoomed regions (right) for labeled cyt c bound to DOPC:MLCL (2:1) vesicles in absence (black) and presence (orange) of 4x excess IOA. Dashed oval (right-most panel) marks peaks for Ile75/Ile85 that are missing in the IOA sample. f, Normalized peak intensity in the absence (black) and presence (orange) of IOA, for Thr Cα/β peaks and Cβ/γ/δ of Ile75 and Ile85. Differences indicate changes in local molecular motion. g, Image of the unbound fold of cyt c, with inset showing Ile75 and Ile85 (in sticks) and the Ω-loop (red) inbetween. h, Two different binding poses of IOA, bound to cyt c, obtained by docking simulations followed by MD runs: type 1 (7 runs, left panel) and type 2 (3 runs, right panel). Type 2 occasionally exhibited a flip to type 1 (the thin sticks showing the alternative conformation). The residues that were distinguished by their high contact frequencies (normalized with respect to the top-ranking residue) are displayed in the bar plots, in decreasing frequency of contacts. The distance between the N atom of the imidazole and Fe3+ ion is shown in the black histograms (inset: the last 100 ns of each set of simulations).
Figure 6
Figure 6. . TAZ-deficiency induces changes in Drosophila endurance and the Drosophila lipidome.
a, TAZ889 mutants have reduced endurance relative to control w1118 flies. Time to fatigue was quantified as the time when less than 20% of flies in a vial were still running. Each vial of 20 flies was treated statistically as a single independent replicate (N = 8 biological replicates for each group). Significance was determined by log-rank analysis. **p=0.0027. b, Content of CL (upper panel) and MLCL (lower panel) in control w1118 and TAZ889-deficient flies. Data are presented as mean values ± SD. CL, *P=0.0020; MLCL/CL-OOH,*P=0.0022, unaired two-tailed t-test. c, Quantitative characterization of CL and MLCL molecular species containing poorly oxidizable monounsaturated (MUFA) fatty acids and readily oxidizable polyunsaturated fatty acids (PUFA), C18:2 and C18:3 in control w1118 and TAZ889-deficient flies. TAZ deficiency results in accumulation of oxygenated (d) and oxidatively truncated phospholipids (e). Data are presented as mean values ± SD. MLCL(50:4)-OH-OOH, **P=0.0069; PE(36:2)-OOH, **P=0.0190; PCp(34:2)-OOH, *P=0.0112; MLCL(16:1/16:1/ONA), **P=0.0087; PE(16:1)-ONA, *P=0.0215, unpaired t-test. f, TPP-IOA improves the endurance of TAZ889 mutants. Each vial of 20 flies was treated statistically as a single independent replicate (N = 8 biological replicates for each group). Significance was determined by log-rank analysis. Age day 10: p-value for 0.89mg/ml = 0.0097, P-value for 1.78 mg/ml = 0.0257. Age day 17: p-value for 0.89 mg/ml = 0.0032, p-value for 1.78 mg/ml = <.0001. In graph, , **p<0.01,****p<0.0001 g, Content of CL (left panel) and MLCL (right panel) in TAZ889-deficient flies after feeding TPP-IOA. Data are presented as mean values ± SD. CL, *P=0.0121; MLCL, *P=0.0313, unpaired two-tailed t-test; h, TPP-IOA protects lipids against oxidation induced by TAZ-deficiency. Data are presented as mean values ± SD. One-way ANOVA, Tukey’s multiple comparison test. MLCL(50:4)-OH-OOH, *P=0.0458; PE(36:2)-OOH,*P=0.0213; PCp(34:2)-OOH, *P=0.0339, **P=0.0032; MLCL(16:1/16:1/ONA), **P=0.0049 vs TPP-IOA 0.89, **P=0.0039 vs TPP-IOA 1.78; PE(16:1)-ONA,**P=0.0022 vs TPP-IOA 0.89, **P=0.0046 vs TPP-IOA 1.78. Lipidomic analysis was performed using 6 vials (N=20 fly torsos per vial). For all violin plots presented, individual points including maximal and minimal are shown as black circles. Dashed black line indicates median and doted lines indicate quartiles.
Figure 7.
Figure 7.. Bioenergetic characteristics, mitochondrial membrane potential of WT and TAZ-KO cells and the effect of treatment with MLCL/cyt c peroxidase complex inhibitor IOA.
a, Oxygen consumption rates (OCR) assessed by Seahorse XFe96 Extracellular Flux Analyzer in wild type and TAZ KO C2C12 myoblasts. b, ATP-linked respiration (ATP production), represented by a decrease in OCR following inhibition of ATP synthase by oligomycin, was lower in TAZ-KO vs WT cells (p<0.0001). IOA increased ATP production in WT and TAZ KO cells vs respective untreated cells. c, Compared to WT, TAZ-KO cells had significantly lower basal respiration (p=0.0201) measured before the addition of the ATP synthase inhibitor, oligomycin. IOA increased basal respiration in WT and TAZ KO cells vs respective untreated cells. d, Maximal respiration measured after the addition of the uncoupler carbonyl cyanide-p-trifluoromethoxyphenyl-hydrazone (FCCP), was decreased in TAZ KO cells vs WT (p<0.0001). IOA increased maximal respiration in WT and TAZ KO cells vs respective untreated cells. e, Spare respiratory capacity calculated as the difference between maximal respiration and ATP-linked respiration was diminished in TAZ KO vs WT cells (p=0.0055). IOA improved spare respiratory capacity in WT and TAZ KO cells vs their untreated counterparts. Data are presented as mean values ± SD. *P< 0.05, **P<0.01, 2-tailed unpaired t-test, between untreated and treated cells from the same group (WT and TAZ-KO); two-way ANOVA followed by Šídák’s multiple comparisons test for comparisons between WT and TAZ-KO untreated cells (adjusted P values); a, N = at least 12 biological replicates (microplate wells seeded with 5,000 cells) from one experiment, 12 OCR readings over time for each well, 3 reading repeats at each point; N = at least 24 biological independent samples (microplate wells seeded each with 5,000 cells) from 2 independent experiments, 12 OCR readings over time for each well, 3 reading repeats at each point, each data point is the average of 3 X 3 = 9 readings, OCR values normalized by the protein content of each well independently and then expresses as a percentage of the mean of at least 25 WT wells with no treatment. f, Effect of IOA (1 μM) on mitochondrial membrane potential in WT and TAZ K/O C2C12 cells assessed by TMRM. g, Quantification was performed using percentage of cells in populations P1 and P2. Data are presented as mean values ± SD. Each data point represents a biologically independent sample. Statistical significance was analyzed using unpaire two-tailed t-test **p=0.0018 (WT vs WT+IOA), **p=0.028 (tazΔ vs tazΔ+IOA).

References

    1. Reid Thompson W et al. A phase 2/3 randomized clinical trial followed by an open-label extension to evaluate the effectiveness of elamipretide in Barth syndrome, a genetic disorder of mitochondrial cardiolipin metabolism. Genet Med 23, 471–478 (2021). - PMC - PubMed
    1. Dabner L et al. Treatment of Barth Syndrome by Cardiolipin Manipulation (CARDIOMAN) With Bezafibrate: Protocol for a Randomized Placebo-Controlled Pilot Trial Conducted in the Nationally Commissioned Barth Syndrome Service. JMIR Res Protoc 10, e22533 (2021). - PMC - PubMed
    1. Kagan VE, Chu CT, Tyurina YY, Cheikhi A & Bayir H Cardiolipin asymmetry, oxidation and signaling. Chemistry and Physics of Lipids 179, 64–69 (2014). - PMC - PubMed
    1. Oemer G et al. Molecular structural diversity of mitochondrial cardiolipins. Proc Natl Acad Sci U S A 115, 4158–4163 (2018). - PMC - PubMed
    1. Maguire JJ et al. Known unknowns of cardiolipin signaling: The best is yet to come. Biochim Biophys Acta Mol Cell Biol Lipids 1862, 8–24 (2017). - PMC - PubMed

LinkOut - more resources