. 2023 Dec;29(12):3233-3242.
doi: 10.1038/s41591-023-02645-5. Epub 2023 Nov 23.

Prevalence of chromosomal alterations in first-trimester spontaneous pregnancy loss

Affiliations

Prevalence of chromosomal alterations in first-trimester spontaneous pregnancy loss

Rick Essers et al. Nat Med. 2023 Dec.

Abstract

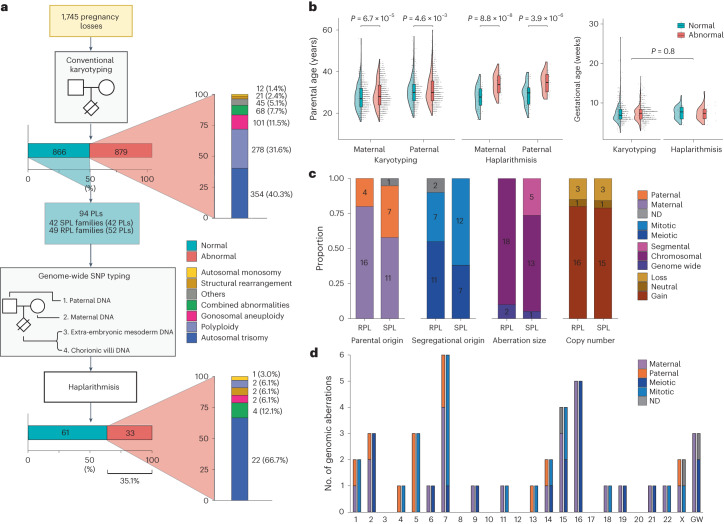
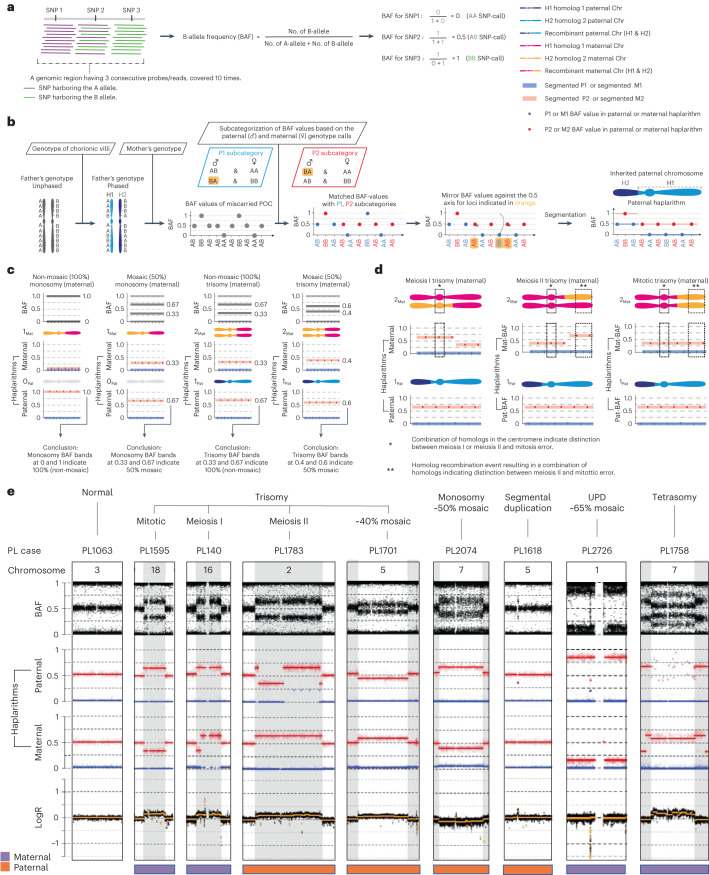
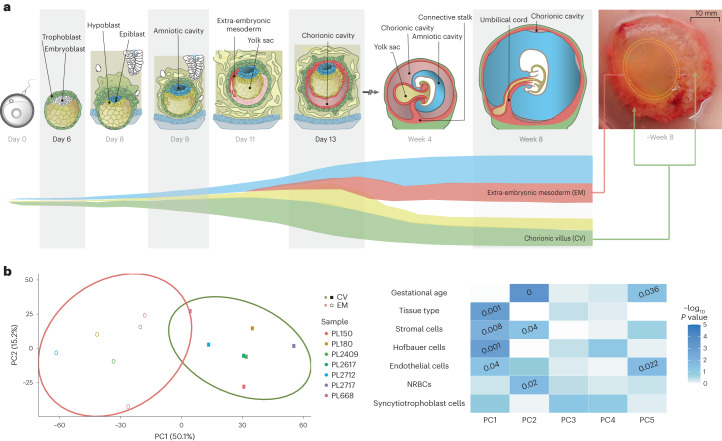
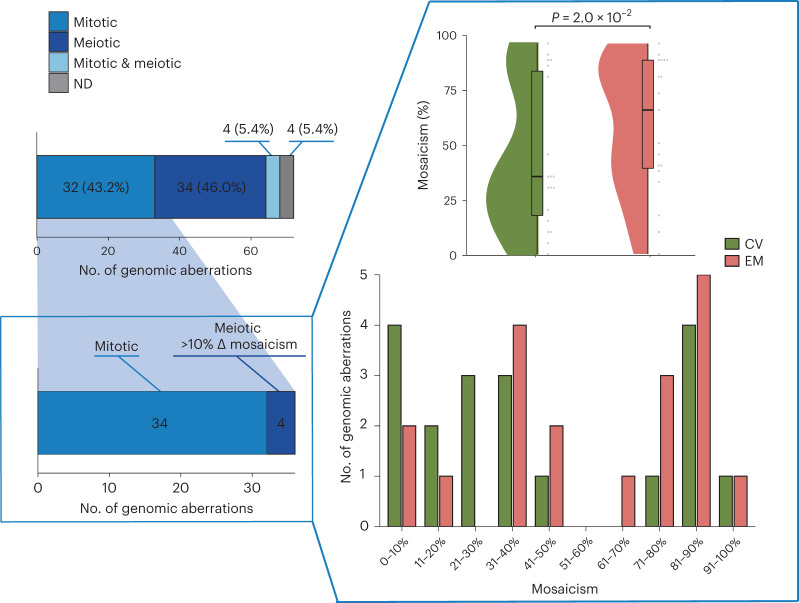
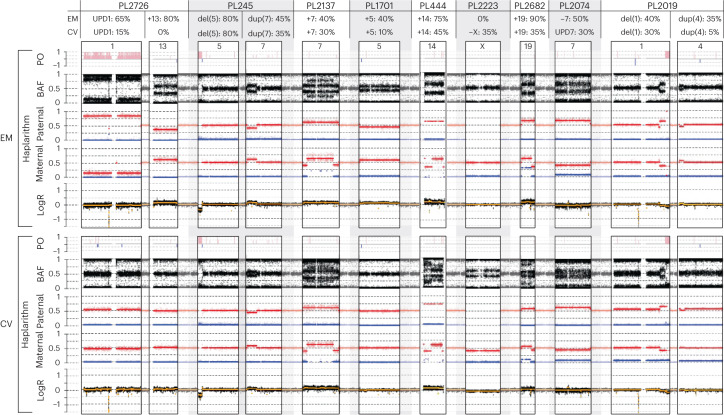
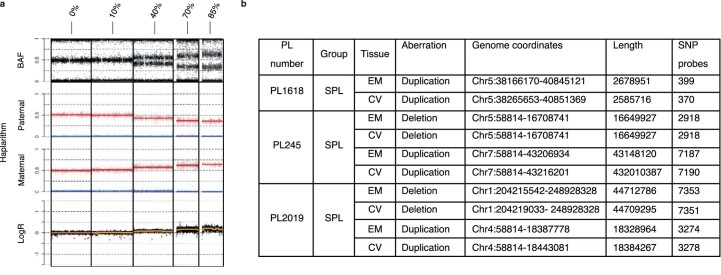
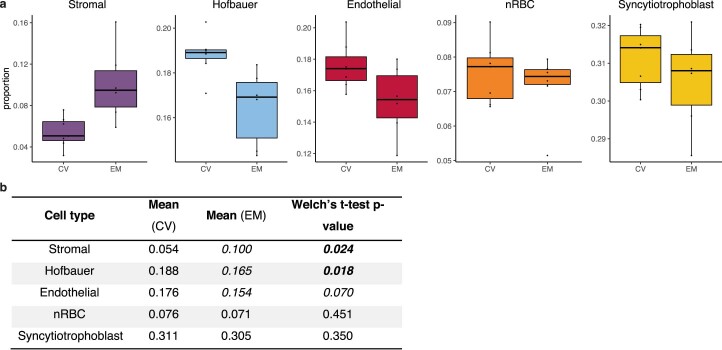
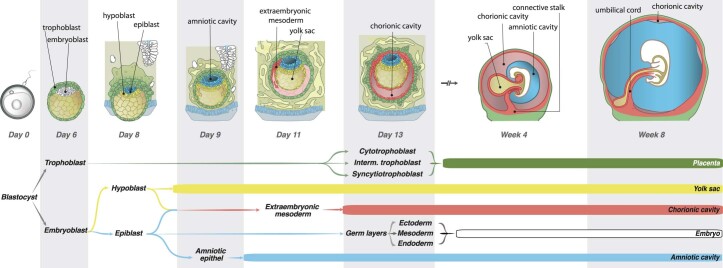
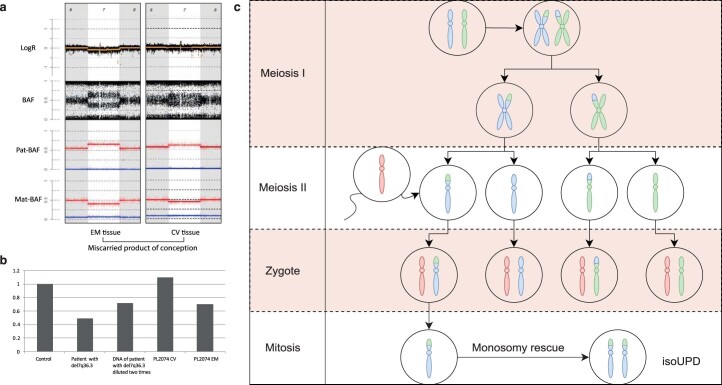
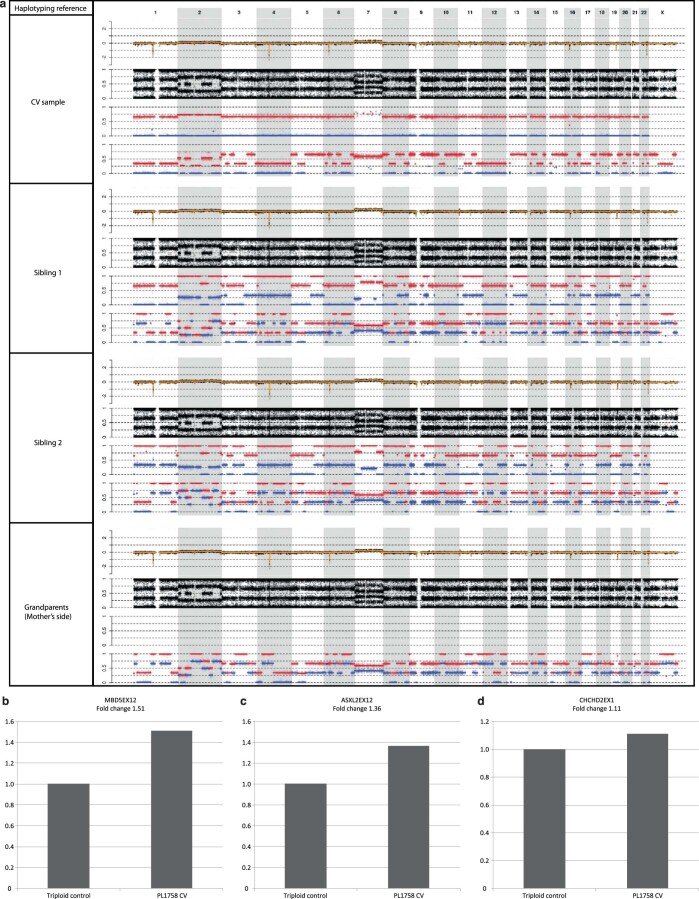
Pregnancy loss is often caused by chromosomal abnormalities of the conceptus. The prevalence of these abnormalities and the allocation of (ab)normal cells in embryonic and placental lineages during intrauterine development remain elusive. In this study, we analyzed 1,745 spontaneous pregnancy losses and found that roughly half (50.4%) of the products of conception (POCs) were karyotypically abnormal, with maternal and paternal age independently contributing to the increased genomic aberration rate. We applied genome haplarithmisis to a subset of 94 pregnancy losses with normal parental and POC karyotypes. Genotyping of parental DNA as well as POC extra-embryonic mesoderm and chorionic villi DNA, representing embryonic and trophoblastic tissues, enabled characterization of the genomic landscape of both lineages. Of these pregnancy losses, 35.1% had chromosomal aberrations not previously detected by karyotyping, increasing the rate of aberrations of pregnancy losses to 67.8% by extrapolation. In contrast to viable pregnancies where mosaic chromosomal abnormalities are often restricted to chorionic villi, such as confined placental mosaicism, we found a higher degree of mosaic chromosomal imbalances in extra-embryonic mesoderm rather than chorionic villi. Our results stress the importance of scrutinizing the full allelic architecture of genomic abnormalities in pregnancy loss to improve clinical management and basic research of this devastating condition.


Conflict of interest statement

M.Z.E. is a co-inventor on patent applications ZL910050-PCT/EP2011/060211-WO/2011/157846, ‘Methods for haplotyping single cells’, and ZL913096-PCT/EP2014/068315-WO/2015/028576, ‘Haplotyping and copy-number typing using polymorphic variant allelic frequencies’. The other authors declare no competing interests.

Figures

Fig. 1
Fig. 1. Genome haplarithmisis reveals previously undetected chromosomal aberrations.
a, Study design and distribution of aberrations. b, Maternal, paternal and gestational age in conventional karyotyping of POC samples with normal (n = 866) and abnormal (n = 879) karyotypes and in genome haplarithmisis POC samples with normal (n = 61) and abnormal (n = 33) genomes (two-sided Welch’s t-test). The box plot represents the 25th percentile, median and 75th percentile, respectively, and the whiskers extend to the farthest data point that is no more than 1.5 times the interquartile range (IQR) from the upper or lower quartile. c, Parental and segregational origin of aberrations, aberration size (segmental, chromosomal and genome wide) and copy number (gain, loss and neutral) of unique aberrations per POC sample for the RPL cohort (n = 20) and the SPL cohort (n = 19). d, Parental and segregational origin of genomic aberration per chromosome, including each unique aberration per POC sample. PL, pregnancy loss. ND, not determined; POC, product of conception; SPL, sporadic pregnancy loss; RPL, recurrent pregnancy loss. Source data
Fig. 2
Fig. 2. Schematic representation of genome haplarithmisis and detection of various abnormalities.
a, A genomic region harboring three consecutive SNPs, each with weighted signal intensity of 10, as well as equation for BAF computation for those three SNPs. b, Schematic representation of the standard genome haplarithmisis workflow as demonstrated in Zamani Esteki et al.. Detection of different levels of mosaicism in trio-based haplarithmisis (c) and parental and segregational origin of genomic anomalies in trio-based haplarithmisis (d) (Methods). e, Haplarithms of several pregnancy losses with different types of abnormalities, parental and segregational origins and mosaicism degrees; only a single chromosome of interest is displayed per POC sample. PL1063 has a normal diploid Chr 3; PL1595 has a non-mosaic trisomy 18 of maternal and mitotic error origin; PL140 has a non-mosaic trisomy 16 of maternal and meiosis I error origin; PL1783 has a non-mosaic trisomy 2 of paternal and meiosis II error origin; PL1701 has an approximately 40% mosaic trisomy 5 of paternal and mitotic error origin; PL2074 has an approximately 50% mosaic monosomy 7 of paternal (maternal chromosome is left) and mitotic error origin; PL1618 has a (subchromosomal) approximately 2.7-Mb duplication in Chr 5 near the centromere (q11.1–q11.2) of paternal and mitotic error origin; PL2726 has an approximately 65% mosaic UPD 1 of maternal and mitotic origin; and PL1758 has a tetrasomy 7 of maternal error origin (Extended Data Fig. 7). PL, pregnancy loss.
Fig. 3
Fig. 3. Extra-embryonic mesoderm and chorionic villi lineages and their cellular composition.
a, Schematic representation of early embryonic development. Extra-embryonic mesoderm (EM) develops from the embryoblast lineage (hypoblast and epiblast), whereas chorionic villi (CV) develop from the trophoblast lineage. EM and CV samples from pregnancy losses were collected at week 7.6 ± 1.7 s.d. b, PCA of all CpG sites (n = 685,221) passing quality control criteria (Methods) in data from high-DNA-quality EM (n = 6) and CV (n = 7) samples. The ellipses represent the 90% confidence interval, and the percentage of variance explained by each principal component (PC) is shown in brackets. Heat map showing associations between the first five PCs and biological aspects of the samples, including their predicted cell compositions (Extended Data Fig. 6). The color gradient shows the −log10 of the P values, and P values less than 0.05 are indicated. The significance of the correlation between the PCs and the continuous, numerical sample attributes was tested using a permutation test with 10,000 permutations. The association between the PCs and the binary variable tissue type was assessed using a two-sided Wilcoxon signed-rank test.
Fig. 4
Fig. 4. Segregational and lineage origins of pregnancy losses.
Segregational origin of each individual aberration in both extra-embryonic mesoderm (EM) and chorionic villi (CV) tissue per POC detected by genome haplarithmisis, whereas samples with aberrations of mitotic origin (n = 34: 17 EM and 17 CV) or meiotic origin with greater than 10% mosaicism difference between EM and CV (n = 4: two EM and two CV) were selected for EM/CV plots and mosaicism statistics. The mosaicism degree in EM samples (n = 19) was significantly higher than that in CV samples (n = 19) (two-sided Wilcoxon signed-rank test). The box plot represents the 25th percentile, median and 75th percentile, respectively, whereas the whiskers extend to the farthest data point that is no more than 1.5 times the interquartile range (IQR) from the upper or lower quartile. ND, not determined.
Fig. 5
Fig. 5. Degree of mosaicism in extra-embryonic mesoderm as compared to chorionic villi.
Haplarithms of nine pregnancy loss samples with differences between extra-embryonic mesoderm (EM) and chorionic villi (CV) of greater than 10% mosaicism. PL2726 has a (EM ~65%, CV ~15%) mosaic UPD 1 of maternal and mitotic origin and an approximately 80% mosaic EM-only trisomy 13 of paternal and mitotic error origin. PL245 has a (EM ~80%, CV ~80%) mosaic (subchromosomal) approximately 16.7-Mb deletion in Chr 5 (p15.1–p15.33) of paternal and mitotic error origin and a (EM ~45%, CV ~35%) mosaic approximately 43.2-Mb duplication in Chr 7 (p14.1–p22.3) of paternal and mitotic error origin. PL2137 has a (EM ~40%, CV ~30%) mosaic trisomy 7 of maternal and mitotic error origin. PL1701 has a (EM ~40%, CV ~10%) mosaic trisomy 5 of paternal and mitotic origin. PL444 has a (EM ~75%, CV ~45%) mosaic trisomy 14 of maternal and meiotic error origin. PL2223 has an approximately 35% mosaic CV-only monosomy X of paternal error origin. PL2682 has a (EM ~90%, CV ~35%) mosaic trisomy 19 of maternal meiotic error origin. PL2074 has an approximately 50% mosaic EM-only monosomy 7 of maternal and mitotic error origin and an approximately 30% mosaic CV-only UPD 7 of maternal and mitotic error origin. PL2019 has a (EM ~40%, CV ~30%) mosaic approximately 44.7-Mb deletion in Chr 1 (q32.1–q44) of paternal and mitotic error origin and a (EM ~35%, CV ~5%) mosaic approximately 18.3-Mb duplication in Chr 4 (p15.32–p16.3) of paternal and mitotic error origin. del, deletion; dup, duplication; Mb, megabase; +, trisomy; −, monosomy; PO, parent-of-origin.
Extended Data Fig. 1
Extended Data Fig. 1. Mosaicism of > 10% and CNVs > 100 kb are detected by genome haplarithmisis.
a, Different mosaicism degrees for chromosomal trisomy of paternal origin of several PLs. b, Detected CNVs for 3 PLs including genome coordinates, length, and number of SNP probes.
Extended Data Fig. 2
Extended Data Fig. 2. Abnormality rate per tissue between SPL and RPL with parental and segregational origin.
a, Abnormality rate of SPL DNA samples (n = 84). b, Abnormality rate of RPL DNA samples (n = 104). c, Parental origin and number of PLs per family (n = 30). d, Segregational origin and number of PLs per family (n = 32).
Extended Data Fig. 3
Extended Data Fig. 3. Heatmap and PCA of EM and CV tissue samples.
a, Heatmap of EPIC array SNP probes (n = 59) of all paired EM and CV tissue samples (n = 13). Hierarchical clustering of the samples was constructed using Euclidian distance and complete linkage and is shown as a dendrogram. b, Scatter plot showing the projection of all EM and CV tissue samples (n = 13) into the principal component space generated using reference data for sex prediction (not shown). All chosen samples were female according to the haplotyping analysis and the methylation sex prediction. Grey dashed lines separate the quadrants where male (XY) samples are expected to map to the lower left quadrant and female (XX) samples to the upper right quadrant.
Extended Data Fig. 4
Extended Data Fig. 4. Predicted cell composition of EM and CV samples based on methylation data.
a, Boxplots showing the predicted cellular composition of the high DNA quality EM (n = 6) and CV (n = 7) samples for each cell type: stromal cells, Hofbauer cells, Endothelial cells, nucleated red blood cells (nRBCs) and syncytiotrophoblast cells. The horizontal lines of the of the boxplot represent the 25th percentile, median and 75th percentile respectively while the whiskers extend to the farthest data point that is no more than 1.5 times the interquartile range (IQR) from the upper or lower quartile. The dots represent individual samples. b, Table with mean values of each cell type, P values were calculated with two-sided Welch’s T-test.
Extended Data Fig. 5
Extended Data Fig. 5. Detailed schematic representation of early embryonic development.
Trophoblast and embryoblast lineages develop at day 6, hypoblast and epiblast develop from the embryoblast at day 8, hypoblast develops into the yolk sac, while epiblast develops into the different embryonic germ layers and the embryo and into the amnionic cavity. Extraembryonic mesoderm develops around day 11 from the hypo- and epiblast. The trophoblast cells become the placenta including cytotrophoblast, intermediate trophoblast, and syncytiotrophoblast cells, chorionic villi develop around day 13 from the trophoblast lineage (see also Fig. 2a).
Extended Data Fig. 6
Extended Data Fig. 6. Validation of chromosome 7 copy number in PL2074.
a, Haplarithm of EM and CV tissue of PL2074, EM shows a 50% mosaic monosomy 7 while CV shows a ~ 30% UPD (copy-neutral) with contamination of maternal tissue. b, RT-qPCR results with a diploid control, patient with a 7q36.3 deletion and two times diluted, PL2074 CV (UPD, copy neutral), and PL2074 ( ~ 50% mosaic monosomy 7) with contamination of maternal tissue. c, Schematic representation of proposed monosmy-rescue mechanism leading to uniparental disomy (UPD).
Extended Data Fig. 7
Extended Data Fig. 7. Validation of segregational origin of aberrations in PL1758 CV DNA sample.
a, Haplarithms of fetal EM of PL1758, produced with different references for phasing, namely CV of the same fetus, 2 different siblings, and maternal grandparents. PL1758 shows complex abnormalities with genome-wide triploidy of maternal error origin, and mosaic tetrasomy of Chr 2 and Chr 7, segregational origin appear to be mitotic (Chrs 1, 4, 12), or meiotic II (Chrs 3, 5, 6, 8, 9, 10, 11, 13, 14, 15, 16, 17, 18, 19, 20, 21, 22). Haplarithmisis can accurately determine segregational origin with CV as reference compared to siblings or grandparents as a reference. Validation of PL1758 by RT-qPCR using DNA from spontaneous PL with 69,XXX karyotype and primers for b, exon 12 of the MBD5 gene (2q23.1), c, exon 12 of the ASXL2 gene (2p23.3), and d, exon 1 of the CHCHD2 gene (7p11.2) were used to confirm tetrasomy for Chr 2 and Chr 7 in DNA from CV of PL1758.

Similar articles

Cited by

References

    1. Quenby S, et al. Miscarriage matters: the epidemiological, physical, psychological, and economic costs of early pregnancy loss. Lancet. 2021;397:1658–1667. - PubMed
    1. Coomarasamy A, et al. Sporadic miscarriage: evidence to provide effective care. Lancet. 2021;397:1668–1674. - PubMed
    1. Gruhn JR, et al. Chromosome errors in human eggs shape natural fertility over reproductive life span. Science. 2019;365:1466–1469. - PMC - PubMed
    1. Hassold T, et al. Failure to recombine is a common feature of human oogenesis. Am. J. Hum. Genet. 2021;108:16–24. - PMC - PubMed
    1. Starostik MR, Sosina OA, McCoy RC. Single-cell analysis of human embryos reveals diverse patterns of aneuploidy and mosaicism. Genome Res. 2020;30:814–825. - PMC - PubMed