. 2024 Jan;21(1):117-121.
doi: 10.1038/s41592-023-02086-5. Epub 2023 Nov 23.

Accurate prediction of protein-nucleic acid complexes using RoseTTAFoldNA

Affiliations

Accurate prediction of protein-nucleic acid complexes using RoseTTAFoldNA

Minkyung Baek et al. Nat Methods. 2024 Jan.

Abstract

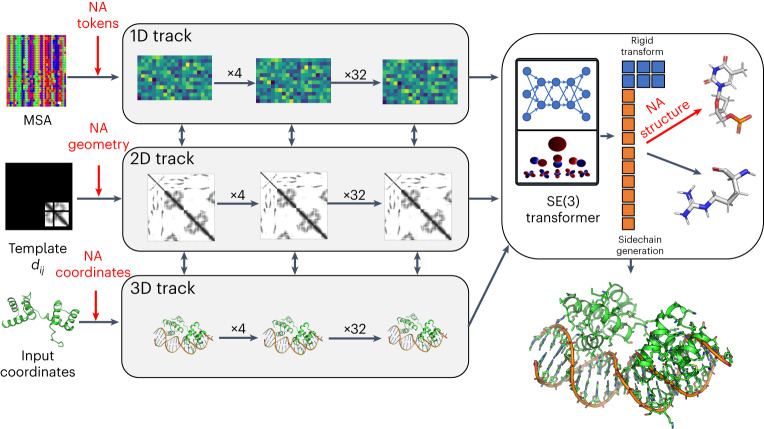
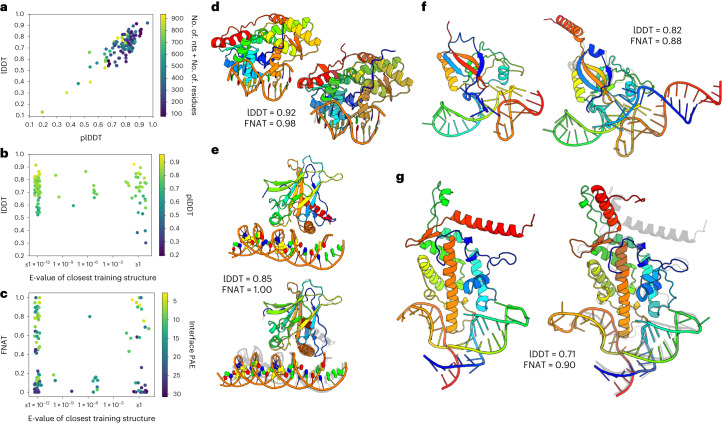
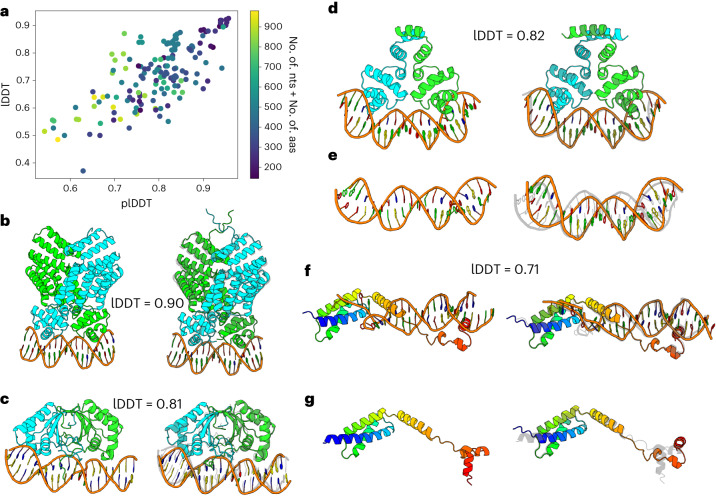
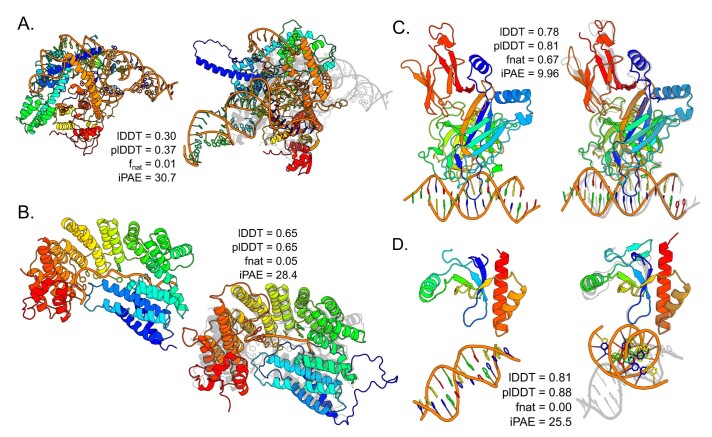
Protein-RNA and protein-DNA complexes play critical roles in biology. Despite considerable recent advances in protein structure prediction, the prediction of the structures of protein-nucleic acid complexes without homology to known complexes is a largely unsolved problem. Here we extend the RoseTTAFold machine learning protein-structure-prediction approach to additionally predict nucleic acid and protein-nucleic acid complexes. We develop a single trained network, RoseTTAFoldNA, that rapidly produces three-dimensional structure models with confidence estimates for protein-DNA and protein-RNA complexes. Here we show that confident predictions have considerably higher accuracy than current state-of-the-art methods. RoseTTAFoldNA should be broadly useful for modeling the structure of naturally occurring protein-nucleic acid complexes, and for designing sequence-specific RNA and DNA-binding proteins.


Conflict of interest statement

The authors declare no competing interests.

Figures

Fig. 1
Fig. 1. Overview of the architecture of RoseTTAFoldNA.
The three-track architecture of RoseTTAFoldNA simultaneously updates sequence (1D), residue-pair (2D) and structural (3D) representations of protein–nucleic acid complexes. The areas in red highlight key changes necessary for the incorporation of nucleic acids: inputs to the 1D track include additional NA tokens, inputs to the 2D track represent template protein–NA and NA–NA distances (and orientations) and inputs to the 3D track represent template or recycled NA coordinates. Finally, the 3D track as well as the structure refinement module (upper right) can build all-atom nucleic acid models from a coordinate frame (representing the phosphate group) and a set of 10 torsion angles (six backbone, three ribose ring and one nucleoside). In this figure, dij are the template inter-residue distances, and SE(3) refers to the Special Euclidean Group in three dimensions.
Fig. 2
Fig. 2. Protein–nucleic acid structure prediction.
ac, Summary of results on 32 protein–NA cluster representatives from the validation set and 84 protein–NA structures released since May 2020. a, Scatterplot of prediction accuracy (true lDDT to native structure) versus prediction confidence (lDDT predicted by the model) shows that the model correctly identifies inaccurate predictions. b, The model seems to generalize well, with no clear performance difference between structures with and without sequence homologs in the protein–NA training set. c, Scatterplot of native interface contacts recapitulated in the prediction (FNAT) versus sequence similarity to training data. A total of 35% of predictions are ranked ‘acceptable’ or better by CAPRI metrics, and 78% of those with high confidence (mean interface PAE < 10). dg, Four examples of protein–NA complexes without homologs in the training set: the BpuJ1 endonuclease bound to a modified cognate DNA (d, PBD ID: 5hlt); tumor antigen p53 bound to cognate DNA with induced-fit sequence specificity (e, PDB ID: 3q05); SmpB bound to the tRNA-like domain of a transfer-messenger RNA (f, PDB ID: 1p6v); and a telomerase reverse transcriptase bound to the enzyme’s RNA component (g, PDB ID: 4o26). Source data
Fig. 3
Fig. 3. Modeling multichain protein–nucleic acid complexes.
a, Scatterplot of predicted model accuracy versus actual model accuracy for 161 protein–NA complexes with multiple protein chains or multiple nucleic acid chains/duplexes shows that the model accurately estimates error. bd,f, Examples of successful predictions without homologs in the training set, shown as the deposited model (left) and prediction (right). These include the viral chromatin anchor KSHV LANA (c, PDB ID: 4uzb), two dimeric helix-turn-helix transcription factors (b, PDB ID: 3u3w; panel D, PDB ID: 4jcy), and a replication origin unwinding complex (f, PDB ID: 3vw4). e,g, Example showing different predicted conformations of the same protein or DNA duplex alone (left) and with the other component (right), from the same complexes shown in d (e) and f (g). Source data
Extended Data Fig. 1
Extended Data Fig. 1. Failure modes of protein - nucleic acid structure prediction.
(ad) Comparisons of representative predictions showing common failure modes of predictions in cases with no training-set homologs. Left is the deposited model, and right is the prediction. (A) Example where the individual subunits predict with poor accuracy, resulting in an incorrect overall complex (pdb ID: 6XMF). Cases like this represent 50% of the examined failures and often result from very large or very small single-stranded nucleic acids (>100 or <20 nucleotides), large multi-domain proteins, or heavily distorted duplex DNAs. (B) Example where the subunits predict with reasonable accuracy and the relative orientation is correct but the details of the interface are wrong (pdb ID: 7A9X). Cases like this represent 20% of the examined failures, and can also result from small single-stranded nucleic acids or slight deviations in monomer structures. (C) Example where the subunits predict with high accuracy and the backbone-backbone binding mode is correct, but the interface is predicted at the wrong site on the DNA (pdb ID: 4J2X). Cases like this represent 10% of the examined failures. (D) Example where both subunits predict correctly but the relative orientation and interface are incorrect (pdb ID: 7LH9). Cases like this represent 20% of the examined failures, and can result from distorted or non-duplex DNA structures or slight deviations in monomer structures.
Extended Data Fig. 2
Extended Data Fig. 2. RNA structure prediction.
(ac) Summary of results on 55 RNA cluster representatives from the validation set and 43 RNA structures released since May 2020. (A) Model accuracy increases at higher confidence levels. The overall average lDDT is 0.64, and the average lDDT for very high confidence predictions (predicted lDDT > 0.9) is 0.78. (B) The model shows little to no performance decrease for RNA molecules with no sequence homologs in the training set. (C) Average accuracy improves as the number of sequences in the MSA increases, but many single-sequence examples are accurately predicted. (df) Four example predictions of RNA models with no detectable sequence homologs in the training set, two of which also have no detectable structural homology according to PDB structure similarity search. (D) a simple hairpin RNA fragment from the 16S rRNA (PDB id: 1i6u), (E) the 5S rRNA from a full ribosome structure (PDB id: 3jai), (F) the SARS-CoV-2 frameshifting pseudoknot RNA (PDB id: 7lyj), and (g) a 49-nt mRNA fragment, solved bound to a ribosomal protein (PDB id: 1u63). Source data
Extended Data Fig. 3
Extended Data Fig. 3. Comparing RoseTTAFoldNA to other methods for RNA prediction.
(a) Scatterplot of predicted accuracy for RoseTTAFoldNA versus DeepFoldRNA, a recent machine learning method for RNA structure prediction. RoseTTAFoldNA has similar performance to DeepFoldRNA, with average lDDTs of 0.64 and 0.64 respectively. (b) RoseTTAFold outperforms DeepFoldRNA if only RoseTTAFold’s high-confidence predictions (predicted lDDT > 0.9) are considered, which have an average lDDT of 0.72. (c) Scatterplot comparing RoseTTAFoldNA to FARFAR2, a Rosetta-based fragment assembly method for RNA structure prediction. FARFAR2 results show the best model by Rosetta energy, of 100 predictions or the number completed in 24 CPU-hours. RoseTTAFoldNA consistently and dramatically outperforms FARFAR2’s top-ranked models, which have an average lDDT of 0.44. (d) The performance gap is similar when only considering RoseTTAFoldNA confident predictions. (e, f) Comparisons between RoseTTAFoldNA and other machine learning methods on the CASP15 RNA targets (using model 1 of each method). RFNA performs somewhat worse than DeepFoldRNA and significantly worse than AIchemy_RNA, the leading machine learning method from the competition. Source data
Extended Data Fig. 4
Extended Data Fig. 4. Comparing RoseTTAFoldNA to docking of monomer predictions.
(a) Scatterplot comparing overall structure accuracy of RFNA versus the top 3 ranked docks from Hdock template-free docking of predicted protein monomers with predicted RNAs or B-form DNAs. (b) Scatterplot comparing interface contact recovery of RFNA predictions versus the top 3 models from the docking calculations. (c–f) Example predictions from both methods shown with the deposited model shown as a light gray silhouette. (C) Example where both RFNA and Hdock’s third-ranked dock successfully recover the correct interface (PDB id: 5HLT). Example where neither RFNA nor Hdock identify the correct orientation of protein and DNA (PDB id: 7V9F) []. Note that both RFNA and AF2 predict the protein in a different conformation than the one found in the deposited model, making complex formation difficult. (E) Example where RFNA predicts the correct complex while Hdock does not reproduce the interface (PDB id: 7K33). Note that the distorted DNA structure would be difficult to model using any traditional methods. (F) Another example where RFNA is successful but docking is not, again with a distorted DNA structure that is difficult to predict (PDB id: 3VW4). Source data
Extended Data Fig. 5
Extended Data Fig. 5. Using RoseTTAFoldNA to distinguish binding and non-binding DNA sequences for transcription factors.
(a) Plot showing distribution of the model’s interface confidence estimate for proteins predicted with binding and non-binding DNA sequences. (b) ROC curve showing how well the binding DNA sequences can be selected from the pool of binding and nonbinding sequences based on the model’s predicted accuracy scores. Curves are shown for all proteins and for the five most common protein families in the dataset. Source data

References

    1. Honorato RV, Roel-Touris J, Bonvin AMJJ. MARTINI-based protein-DNA coarse-grained HADDOCKing. Front. Mol. Biosci. 2019;6:102. doi: 10.3389/fmolb.2019.00102. - DOI - PMC - PubMed
    1. Tuszynska I, Magnus M, Jonak K, Dawson W, Bujnicki JM. NPDock: a web server for protein-nucleic acid docking. Nucleic Acids Res. 2015;43:W425–W430. doi: 10.1093/nar/gkv493. - DOI - PMC - PubMed
    1. Banitt I, Wolfson HJ. ParaDock: a flexible non-specific DNA-rigid protein docking algorithm. Nucleic Acids Res. 2011;39:e135. doi: 10.1093/nar/gkr620. - DOI - PMC - PubMed
    1. Baek M, et al. Accurate prediction of protein structures and interactions using a three-track neural network. Science. 2021;373:871–876. doi: 10.1126/science.abj8754. - DOI - PMC - PubMed
    1. Jumper J, et al. Highly accurate protein structure prediction with AlphaFold. Nature. 2021;596:583–589. doi: 10.1038/s41586-021-03819-2. - DOI - PMC - PubMed