

Benchmarking MicrobIEM - a user-friendly tool for decontamination of microbiome sequencing data
- PMID: 37996810
- PMCID: PMC10666409
- DOI: 10.1186/s12915-023-01737-5
Benchmarking MicrobIEM - a user-friendly tool for decontamination of microbiome sequencing data
Abstract
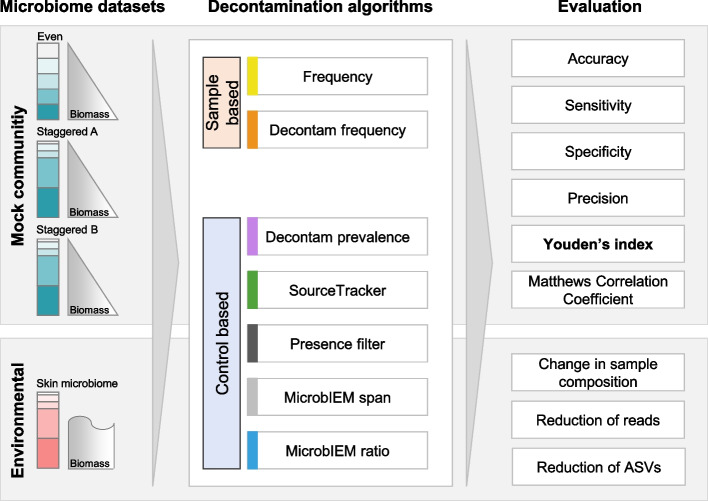
Background: Microbiome analysis is becoming a standard component in many scientific studies, but also requires extensive quality control of the 16S rRNA gene sequencing data prior to analysis. In particular, when investigating low-biomass microbial environments such as human skin, contaminants distort the true microbiome sample composition and need to be removed bioinformatically. We introduce MicrobIEM, a novel tool to bioinformatically remove contaminants using negative controls.
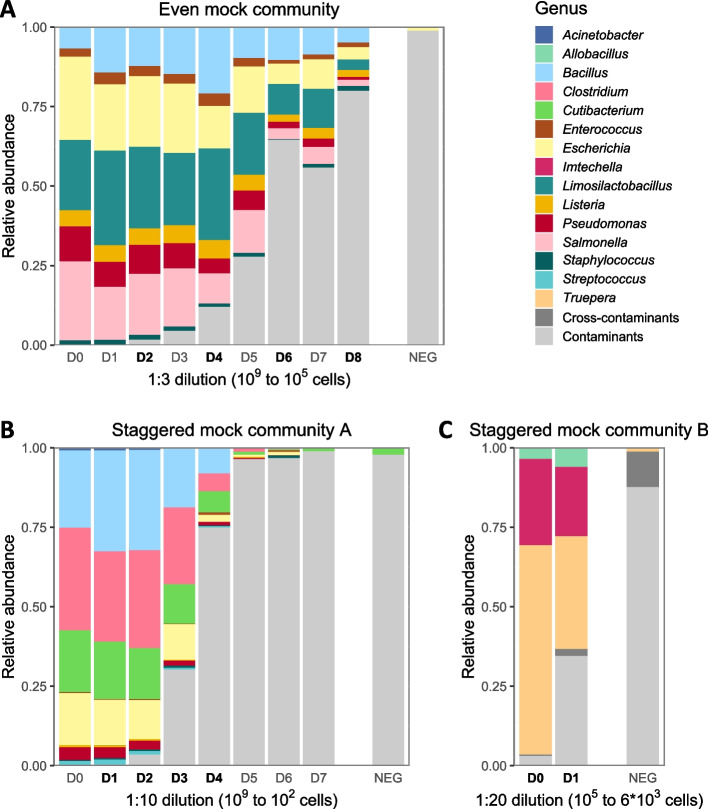
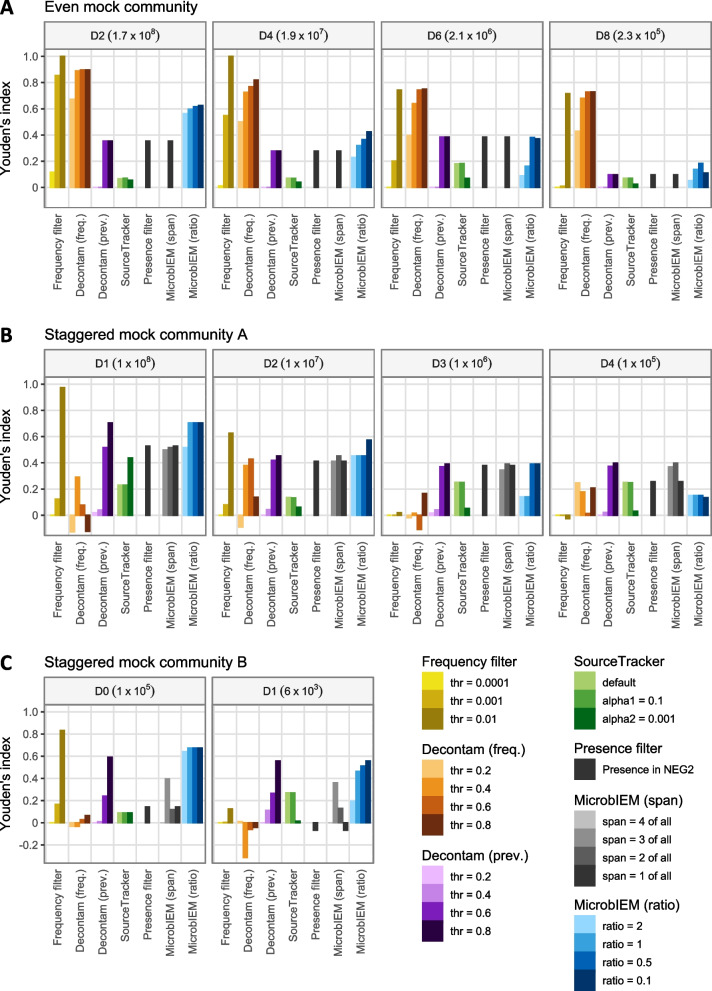
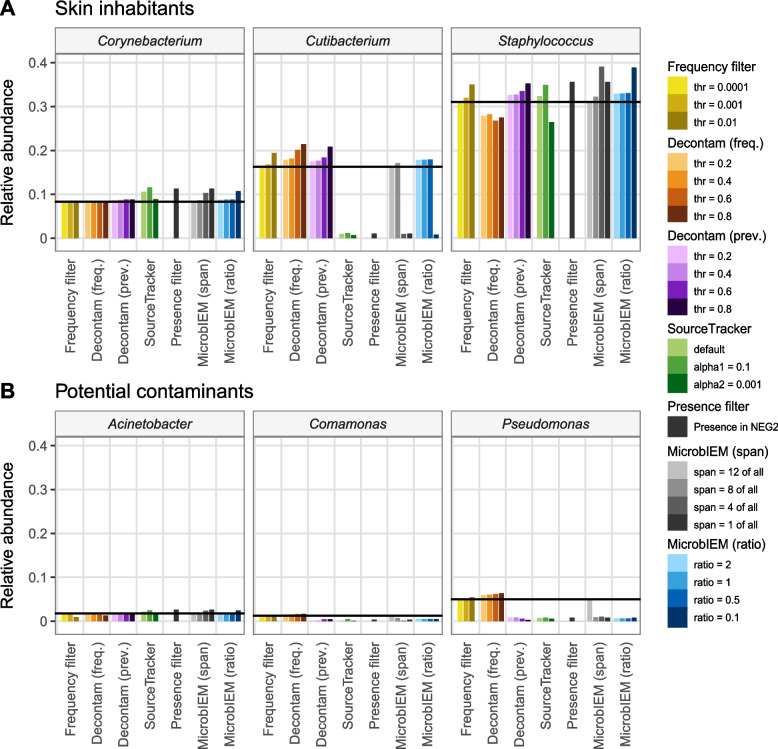
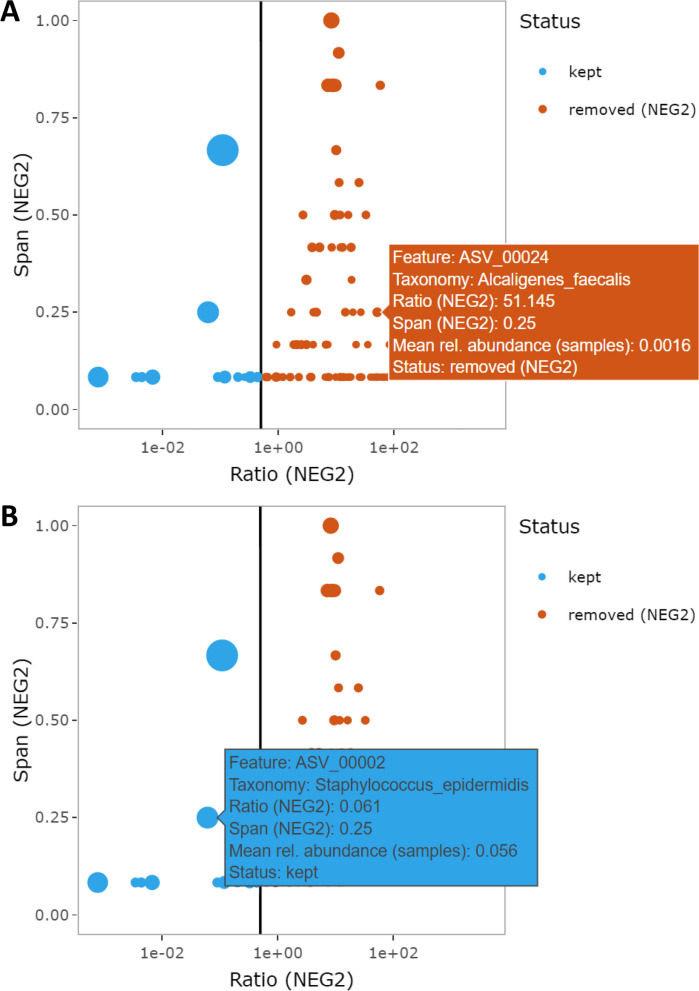
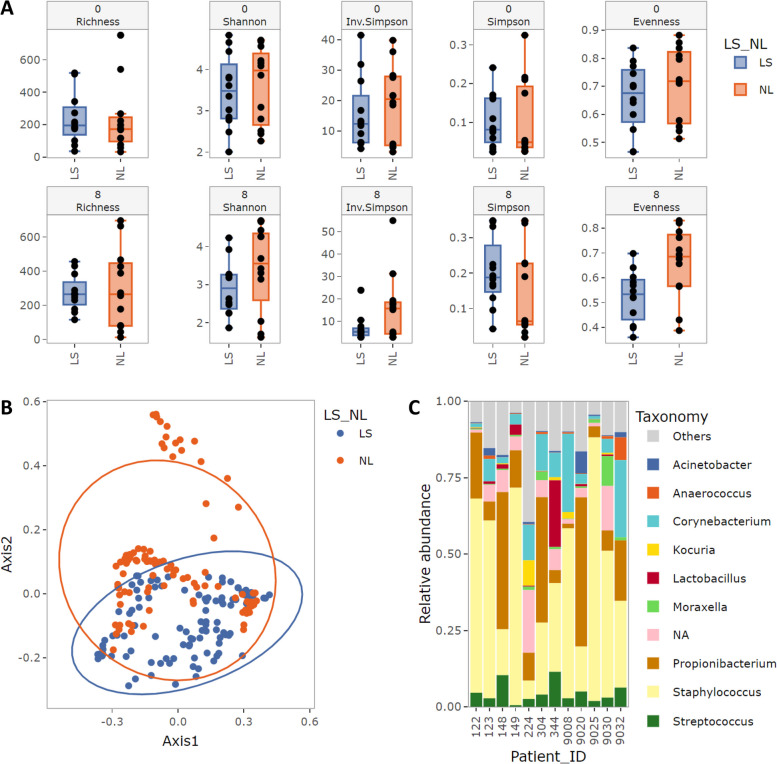
Results: We benchmarked MicrobIEM against five established decontamination approaches in four 16S rRNA amplicon sequencing datasets: three serially diluted mock communities (108-103 cells, 0.4-80% contamination) with even or staggered taxon compositions and a skin microbiome dataset. Results depended strongly on user-selected algorithm parameters. Overall, sample-based algorithms separated mock and contaminant sequences best in the even mock, whereas control-based algorithms performed better in the two staggered mocks, particularly in low-biomass samples (≤ 106 cells). We show that a correct decontamination benchmarking requires realistic staggered mock communities and unbiased evaluation measures such as Youden's index. In the skin dataset, the Decontam prevalence filter and MicrobIEM's ratio filter effectively reduced common contaminants while keeping skin-associated genera.
Conclusions: MicrobIEM's ratio filter for decontamination performs better or as good as established bioinformatic decontamination tools. In contrast to established tools, MicrobIEM additionally provides interactive plots and supports selecting appropriate filtering parameters via a user-friendly graphical user interface. Therefore, MicrobIEM is the first quality control tool for microbiome experts without coding experience.
Keywords: 16S rRNA gene sequencing; Bioinformatic decontamination; Decontam; Low-biomass microbiome; Negative control; SourceTracker; Youden’s index.
© 2023. The Author(s).
Conflict of interest statement
The authors declare that they have no competing interests.
Figures
Similar articles
-
De-biasing microbiome sequencing data: bacterial morphology-based correction of extraction bias and correlates of chimera formation.Microbiome. 2025 Feb 4;13(1):38. doi: 10.1186/s40168-024-01998-4. Microbiome. 2025. PMID: 39905530 Free PMC article.
-
Controlling for Contaminants in Low-Biomass 16S rRNA Gene Sequencing Experiments.mSystems. 2019 Jun 4;4(4):e00290-19. doi: 10.1128/mSystems.00290-19. mSystems. 2019. PMID: 31164452 Free PMC article.
-
CleanSeqU algorithm for decontamination of catheterized urine 16S rRNA sequencing data.Sci Rep. 2025 Jun 2;15(1):19270. doi: 10.1038/s41598-025-98875-3. Sci Rep. 2025. PMID: 40457019 Free PMC article.
-
Considerations and best practices in animal science 16S ribosomal RNA gene sequencing microbiome studies.J Anim Sci. 2022 Feb 1;100(2):skab346. doi: 10.1093/jas/skab346. J Anim Sci. 2022. PMID: 35106579 Free PMC article. Review.
-
Microbiome Sequencing Methods for Studying Human Diseases.Methods Mol Biol. 2018;1706:77-90. doi: 10.1007/978-1-4939-7471-9_5. Methods Mol Biol. 2018. PMID: 29423794 Review.
Cited by
-
Impact of microbiological molecular methodologies on adaptive sampling using nanopore sequencing in metagenomic studies.Environ Microbiome. 2025 May 5;20(1):47. doi: 10.1186/s40793-025-00704-7. Environ Microbiome. 2025. PMID: 40325409 Free PMC article.
-
Tissue-resident bacteria in metabolic diseases: emerging evidence and challenges.Nat Metab. 2024 Jul;6(7):1209-1224. doi: 10.1038/s42255-024-01065-0. Epub 2024 Jun 19. Nat Metab. 2024. PMID: 38898236 Review.
-
Bioinformatic approaches to blood and tissue microbiome analyses: challenges and perspectives.Brief Bioinform. 2025 Mar 4;26(2):bbaf176. doi: 10.1093/bib/bbaf176. Brief Bioinform. 2025. PMID: 40269515 Free PMC article. Review.
-
De-biasing microbiome sequencing data: bacterial morphology-based correction of extraction bias and correlates of chimera formation.Microbiome. 2025 Feb 4;13(1):38. doi: 10.1186/s40168-024-01998-4. Microbiome. 2025. PMID: 39905530 Free PMC article.
-
Nationwide multicentre study of Nanopore long-read sequencing for 16S rRNA-species identification.Eur J Clin Microbiol Infect Dis. 2025 Aug;44(8):1907-1916. doi: 10.1007/s10096-025-05158-w. Epub 2025 May 10. Eur J Clin Microbiol Infect Dis. 2025. PMID: 40348924 Free PMC article.
References
-
- Herzyk P. Chapter 8 - Next-Generation Sequencing. In: Padmanabhan S, editor. Handbook of Pharmacogenomics and Stratified Medicine. San Diego: Academic Press; 2014. pp. 125–145.
Publication types
MeSH terms
Substances
LinkOut - more resources
Full Text Sources
