

Immersive virtual reality gameplay detects visuospatial atypicality, including unilateral spatial neglect, following brain injury: a pilot study
- PMID: 37996834
- PMCID: PMC10668447
- DOI: 10.1186/s12984-023-01283-9
Immersive virtual reality gameplay detects visuospatial atypicality, including unilateral spatial neglect, following brain injury: a pilot study
Abstract
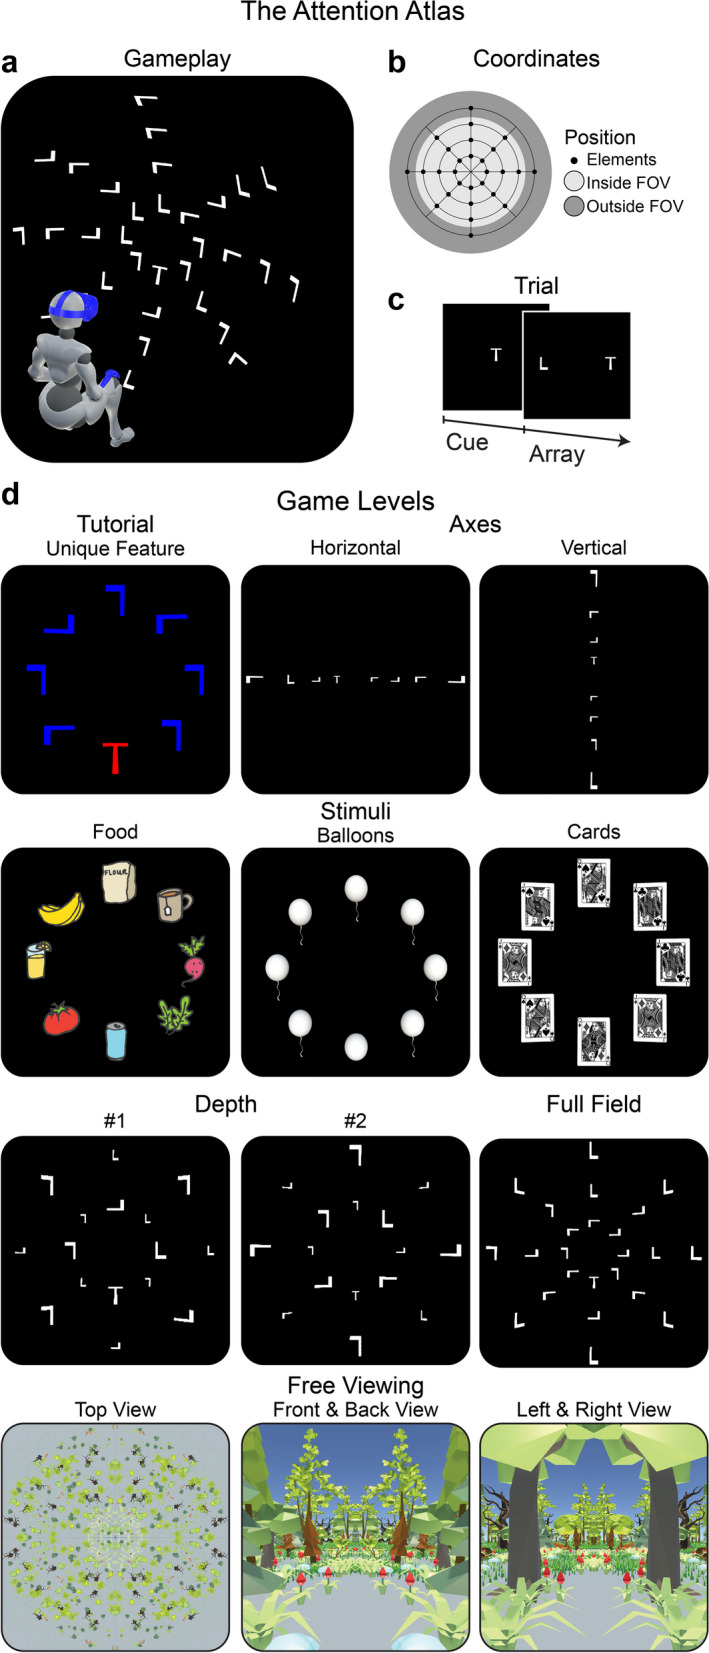
Background: In neurorehabilitation, problems with visuospatial attention, including unilateral spatial neglect, are prevalent and routinely assessed by pen-and-paper tests, which are limited in accuracy and sensitivity. Immersive virtual reality (VR), which motivates a much wider (more intuitive) spatial behaviour, promises new futures for identifying visuospatial atypicality in multiple measures, which reflects cognitive and motor diversity across individuals with brain injuries.
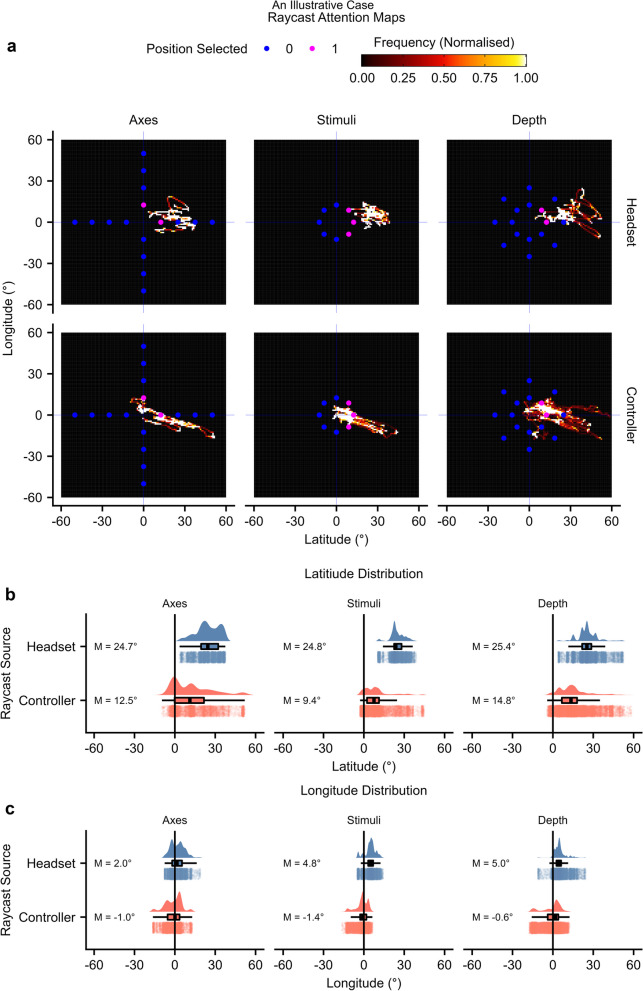
Methods: In this pilot study, we had 9 clinician controls (mean age 43 years; 4 males) and 13 neurorehabilitation inpatients (mean age 59 years; 9 males) recruited a mean of 41 days post-injury play a VR visual search game. Primary injuries included 7 stroke, 4 traumatic brain injury, 2 other acquired brain injury. Three patients were identified as having left sided neglect prior to taking part in the VR. Response accuracy, reaction time, and headset and controller raycast orientation quantified gameplay. Normative modelling identified the typical gameplay bounds, and visuospatial atypicality was defined as gameplay beyond these bounds.
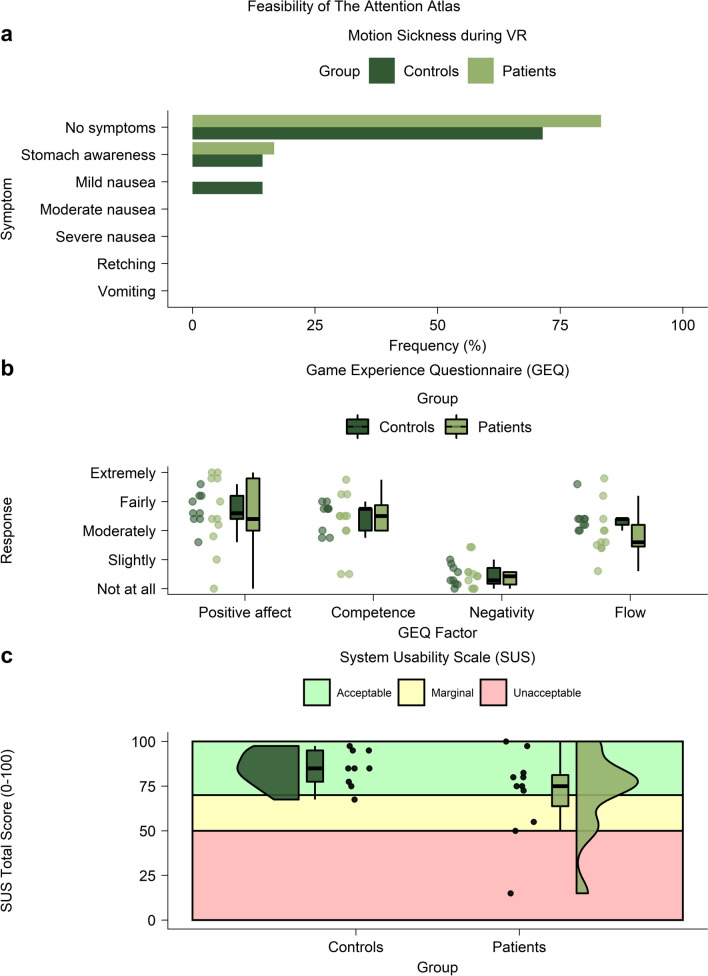
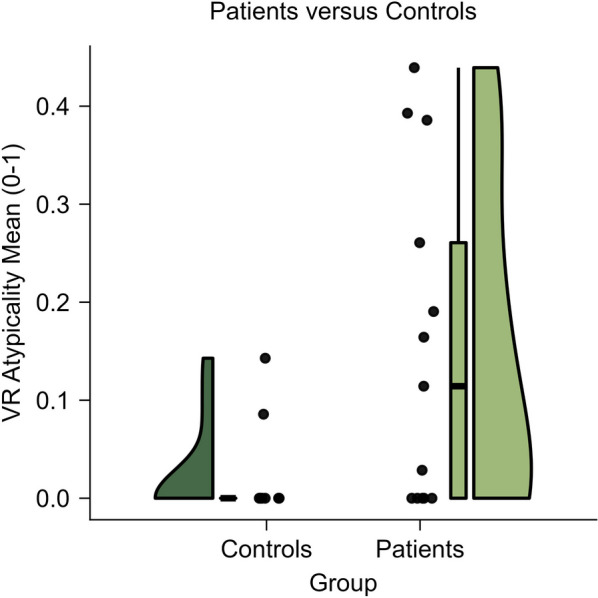
Results: The study found VR to be feasible, with only minor instances of motion sickness, positive user experiences, and satisfactory system usability. Crucially, the analytical method, which emphasized identifying 'visuospatial atypicality,' proved effective. Visuospatial atypicality was more commonly observed in patients compared to controls and was prevalent in both groups of patients-those with and without neglect.
Conclusion: Our research indicates that normative modelling of VR gameplay is a promising tool for identifying visuospatial atypicality after acute brain injury. This approach holds potential for a detailed examination of neglect.
Keywords: Brain injury; Classification; Cognitive assessment; Immersive virtual reality; Unilateral visuospatial neglect.
© 2023. The Author(s).
Conflict of interest statement
The authors declare no competing interests.
Figures

Similar articles
-
Virtual reality gameplay classification illustrates the multidimensionality of visuospatial neglect.Brain Commun. 2024 May 3;6(4):fcae145. doi: 10.1093/braincomms/fcae145. eCollection 2024. Brain Commun. 2024. PMID: 39165478 Free PMC article.
-
Validation of an immersive virtual reality system for training near and far space neglect in individuals with stroke: a pilot study.Top Stroke Rehabil. 2017 Oct;24(7):533-538. doi: 10.1080/10749357.2017.1351069. Epub 2017 Jul 12. Top Stroke Rehabil. 2017. PMID: 28701101
-
The attention atlas virtual reality platform maps three-dimensional (3D) attention in unilateral spatial neglect patients: a protocol.Brain Impair. 2023 Dec;24(3):548-567. doi: 10.1017/BrImp.2022.15. Epub 2022 May 30. Brain Impair. 2023. PMID: 38167362
-
Virtual Reality and Eye-Tracking Assessment, and Treatment of Unilateral Spatial Neglect: Systematic Review and Future Prospects.Front Psychol. 2022 Mar 22;13:787382. doi: 10.3389/fpsyg.2022.787382. eCollection 2022. Front Psychol. 2022. PMID: 35391965 Free PMC article.
-
Uses of virtual reality for diagnosis, rehabilitation and study of unilateral spatial neglect: review and analysis.Cyberpsychol Behav. 2009 Apr;12(2):175-81. doi: 10.1089/cpb.2008.0208. Cyberpsychol Behav. 2009. PMID: 19361298 Review.
Cited by
-
Is Virtual Reality Orientation Therapy Useful to Optimize Cognitive and Behavioral Functioning Following Severe Acquired Brain Injury? An Exploratory Study.Brain Sci. 2024 Apr 23;14(5):410. doi: 10.3390/brainsci14050410. Brain Sci. 2024. PMID: 38790389 Free PMC article.
-
Virtual reality gameplay classification illustrates the multidimensionality of visuospatial neglect.Brain Commun. 2024 May 3;6(4):fcae145. doi: 10.1093/braincomms/fcae145. eCollection 2024. Brain Commun. 2024. PMID: 39165478 Free PMC article.
-
Immersive Virtual Reality for Treatment of Unilateral Spatial Neglect via Eye-Tracking Biofeedback: RCT Protocol and Usability Testing.Brain Sci. 2024 Mar 15;14(3):283. doi: 10.3390/brainsci14030283. Brain Sci. 2024. PMID: 38539671 Free PMC article.
References
Publication types
MeSH terms
Grants and funding
LinkOut - more resources
Full Text Sources
Medical
