. 2023 Nov 23;21(1):843.
doi: 10.1186/s12967-023-04733-z.

Talniflumate abrogates mucin immune suppressive barrier improving efficacy of gemcitabine and nab-paclitaxel treatment in pancreatic cancer

Affiliations

Talniflumate abrogates mucin immune suppressive barrier improving efficacy of gemcitabine and nab-paclitaxel treatment in pancreatic cancer

Antonio Agostini et al. J Transl Med. .

Abstract

Background: Pancreatic ductal adenocarcinoma (PDAC) is a lethal disease. This is due to its aggressive course, late diagnosis and its intrinsic drugs resistance. The complexity of the tumor, in terms of cell components and heterogeneity, has led to the approval of few therapies with limited efficacy. The study of the early stages of carcinogenesis provides the opportunity for the identification of actionable pathways that underpin therapeutic resistance.

Methods: We analyzed 43 Intraductal papillary mucinous neoplasms (IPMN) (12 Low-grade and 31 High-grade) by Spatial Transcriptomics. Mouse and human pancreatic cancer organoids and T cells interaction platforms were established to test the role of mucins expression on T cells activity. Syngeneic mouse model of PDAC was used to explore the impact of mucins downregulation on standard therapy efficacy.

Results: Spatial transcriptomics showed that mucin O-glycosylation pathway is increased in the progression from low-grade to high-grade IPMN. We identified GCNT3, a master regulator of mucins expression, as an actionable target of this pathway by talniflumate. We showed that talniflumate impaired mucins expression increasing T cell activation and recognition using both mouse and human organoid interaction platforms. In vivo experiments showed that talniflumate was able to increase the efficacy of the chemotherapy by boosting immune infiltration.

Conclusions: Finally, we demonstrated that combination of talniflumate, an anti-inflammatory drug, with chemotherapy effectively improves anti-tumor effect in PDAC.

Keywords: Intraductal mucinous neoplasms (IPMNs); Organoid interaction platform; Pancreatic ductal adenocarcinoma (PDAC); Spatial transcriptomics; Syngeneic mouse models.


Conflict of interest statement

The authors have no competing interests to disclose.

Figures

Fig. 1
Fig. 1
GeoMX spatial transcriptomics analysis. a Low-grade (LG), and High-grade (HG) IPMN FPPE samples were stained with PanCk (green) markers for tumor cells, and CD45 (orange) for immune cells detection. Syto13 was used as nuclear staining (blue). b GeoMX data was analyzed with Seurat and differential expression analysis was performed for HG compared to LG IPMN. c, d Mucin genes were consistently overexpressed together with the genes responsible for their O-glycosylation. e We calculated module score for the mucin O-glycosylation signature obtained from Reactome using the addmodulescore() function from Seurat. HG IPMNs showed consistent higher scores in respect to LG, and borderline IPMNs
Fig. 2
Fig. 2
GCNT3, MUC1, and MUC5AC expression in IPMN and PDAC patients. a GCNT3 gene expression values (normalized TPM) from tumor and adjacent normal tissues were reported. T-Student test p < 0.001; b Pearson’s R correlation coefficient to assess relationships between the mRNA expression levels of GCNT3, MUC1 and MUC5AC genes. P < 0.05 was considered as statistically significant (GCNT3 Vs MUC1, Cor = 0.48; GCNT3 Vs MUC5AC, Cor = 0.51; MUC1 Vs MUC5AC, Cor 0.57); c survival probability curves for TCGA data. Kaplan–Meier survival probability curves for log survival time in the TCGA PDAC data patients. Patients predicted to have long survival times (in black) and for the patients predicted to have short survival times (in red). GCNT3, HR = 1.64 (1.02 < CI < 2.63), P = 0.039; MUC5AC, HR = 1.64 (1.31 < CI < 3.18), P = 0.0013; MUC1, HR = 2.56 (1.45 < CI < 4.54), P = 0.00081; d Multiplex IF analysis for PanCK, GCNT3, MUC1, MUC5AC, CD4, CD8, CD163, CD68. Images shown are representative of 1 out of more than 20 fields acquired. e Plot showing the counts of positive cell per area (20 ROIs). Kruskal–Wallis test was used to compare differences between sample groups with Low-grade IPMN as control. *** = Pvalue < 0.01, ** = 0.01 > Pvalue < 0.05, * = 0.025 > Pvalue < 0.05. (LG-IPMN) lowgrade IPMN, (HG-IPMN) High-grade IPMN, (PDAC) Pancreatic Ductal Adenocarcinoma
Fig. 3
Fig. 3
Validation of identified markers in cancer derived graft (CDG) models of pancreatic cancer. a PCA plot showing that Mucin-specific O-Glycosylation signature distinguish cancer derived grafts (CDG) PDAC murine cell lines DT4313, FC1242, FC1245 analysed for RNAseq. (DIM1, 74.6%, DIM2. 18.8%). Arrows showing Gcnt3, Muc1 and Muc5ac contributions to variance; b Gcnt3, Muc1 and Muc5ac expression in CDG cells
Fig. 4
Fig. 4
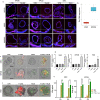
In vitro GCNT3 specific inhibition suppressed mucins deposition promoting T cells infiltration. a Immunostaining analysis for GCNT3, MUC1 and MUC5AC. Protein analyzed (in red) and nuclei (in blue) were reported. Images shown are representative of 1–2 out of more than 10 of the 3D cancer cultures acquired. 100X and 200X magnification were reported. b Boxplot showing normalized RNA-seq counts for Tert gene in 13KC and KPC06 models. c In vitro recognition platform between Telomerase specific T cells and 3D-pancreatic cancer cultures from 13 KC and KPC06 mouse model. T cells are stained with CMPTX (red) and Caspase 3/7 activity is shown in green. d In vitro recognition platform between patient derived organoids (PDO) and T cells isolated from the same patient. T cells are stained with CMPTX (red) and Caspase 3/7 activity is shown in green. e Barplot showing the fold increase in Caspase 3/7 activity in comparison to control (CTR). The fold increase is calculated as the ratio between the mean of Corrected Total Fluorescence (CTCF) quantified in each group and the mean of control. ****Pvalue < 0.0001, *Pvalue < 0.05. f Barplot showing the expression of Interferon γ in pg/ml assessed by ELISA in the conditioned medium from each condition of the interaction platform. ****Pvalue < 0.0001
Fig. 5
Fig. 5
GCNT3 inhibition enhanced Gem/Txl standard therapy efficacy in orthotopic syngeneic PDAC mouse model. a Plot showing individual tumor growth curves of KPC06 tumor bearing mice (n = 5) randomly assigned to receive saline (CTR), standard therapy (Gem/Txl), talniflumate (TALN) and talniflumate-Gem/Txl combination treatment (COMB). b Barplot showing tumor growth grouped by treatment. Wilcoxon signed-rank test was used to compare differences between treatments. *** = Pvalue < 0.01, * = Pvalue < 0.05, NS = not significant. c Plot showing the overall survival of KPC mice divided according each experimental condition
Fig. 6
Fig. 6
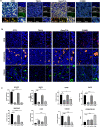
Immunofluorescence analysis on orthotopic syngeneic PDAC mouse model. a Multiplex IF analysis showing the correlation of PanCK, GCNT3, MUC1, MUC5AC in KPC06 mice models randomly assigned to receive saline (CTR), standard therapy (Gem/Txl), talniflumate (TALN) and talniflumate-Gem/Txl combination treatment (COMB). Images shown are representative of 1 out of more than 10 fields acquired and reviewed by pathologist. b IF showing the expression of CD8, CD68, iNOS, and CD163 in the same experimental groups. Images shown are representative of 1 out of more than 10 fields acquired and reviewed by pathologist. c Barplots show percentage of positive cells per area grouped by treatments. Kruskal–Wallis test was used to compare differences between treatments and control. **** = Pvalue < 0.0001, *** = Pvalue < 0.001, *** = Pvalue < 0.01,* = Pvalue < 0.05
Fig. 7
Fig. 7
Graphical summary of the study main results. a) GCNT3 and Mucin expression increase throughout the IPMN from Low-grade IPMN to High-grade IPMN and PDAC. b O-glycosilated Mucins shield the tumor cells from T cells improving immune escape. c Talniflumate abrogates GCNT3 activity and impairs teh enzyme expression together with MUC1 and MUC5AC favoring T cell recognition and activation

Similar articles

Cited by

References

    1. Siegel RL, Miller KD, Fuchs HE, Jemal A. Cancer statistics, 2022. CA Cancer J Clin. 2022;72:7–33. doi: 10.3322/caac.21708. - DOI - PubMed
    1. Chun JW, Lee SH, Kim JS, Park N, Huh G, Cho IR, et al. Comparison between FOLFIRINOX and gemcitabine plus nab-paclitaxel including sequential treatment for metastatic pancreatic cancer: a propensity score matching approach. BMC Cancer. 2021;21:537. doi: 10.1186/s12885-021-08277-7. - DOI - PMC - PubMed
    1. Beatty PL, van der Geest R, Hashash JG, Kimura T, Gutkin D, Brand RE, et al. Immunobiology and immunosurveillance in patients with intraductal papillary mucinous neoplasms (IPMNs), premalignant precursors of pancreatic adenocarcinomas. Cancer Immunol Immunother. 2016;65:771–778. doi: 10.1007/s00262-016-1838-1. - DOI - PMC - PubMed
    1. Roth S, Zamzow K, Gaida MM, Heikenwälder M, Tjaden C, Hinz U, et al. Evolution of the immune landscape during progression of pancreatic intraductal papillary mucinous neoplasms to invasive cancer. EBioMedicine. 2020;54:102714. doi: 10.1016/j.ebiom.2020.102714. - DOI - PMC - PubMed
    1. Terris B, Dubois S, Buisine M-P, Sauvanet A, Ruszniewski P, Aubert J-P, et al. Mucin gene expression in intraductal papillary-mucinous pancreatic tumours and related lesions. J Pathol. 2002;197:632–637. doi: 10.1002/path.1146. - DOI - PubMed

Publication types