. 2023 Nov 23;20(1):276.
doi: 10.1186/s12974-023-02963-y.

Naïve Huntington's disease microglia mount a normal response to inflammatory stimuli but display a partially impaired development of innate immune tolerance that can be counteracted by ganglioside GM1

Affiliations

Naïve Huntington's disease microglia mount a normal response to inflammatory stimuli but display a partially impaired development of innate immune tolerance that can be counteracted by ganglioside GM1

Noam Steinberg et al. J Neuroinflammation. .

Abstract

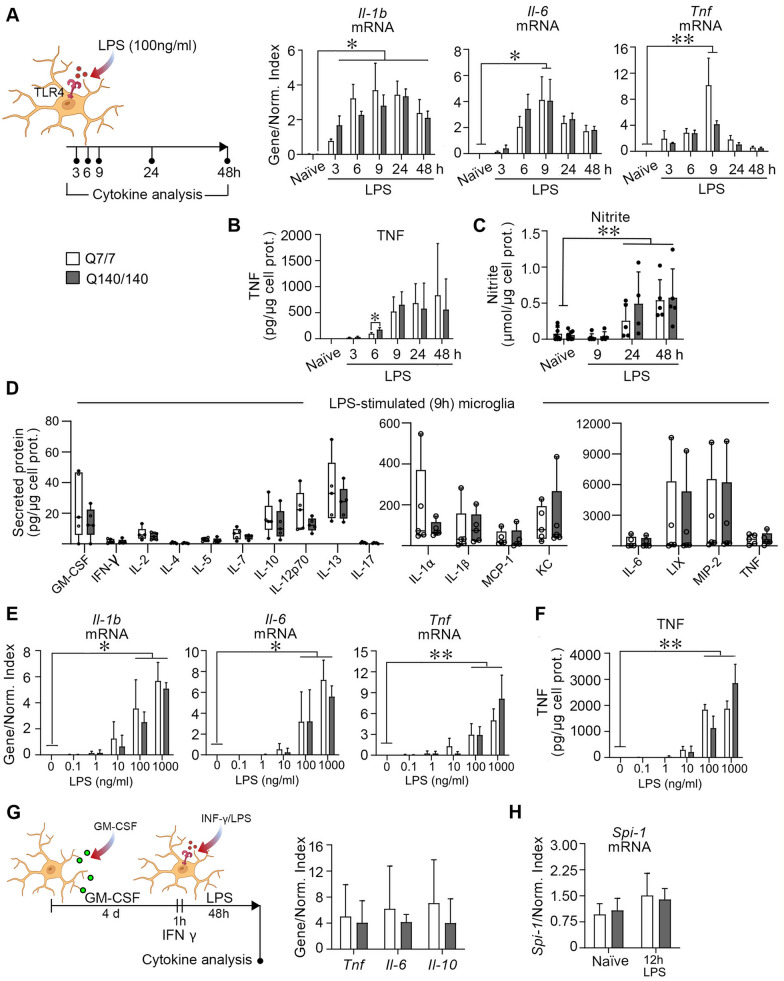
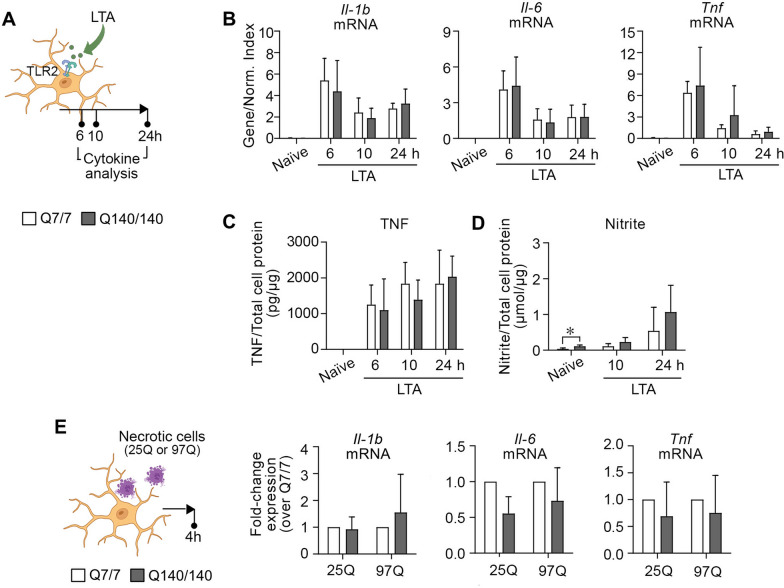
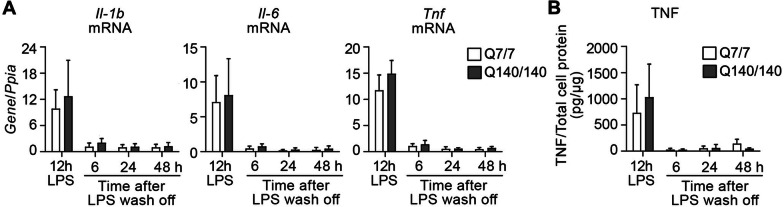
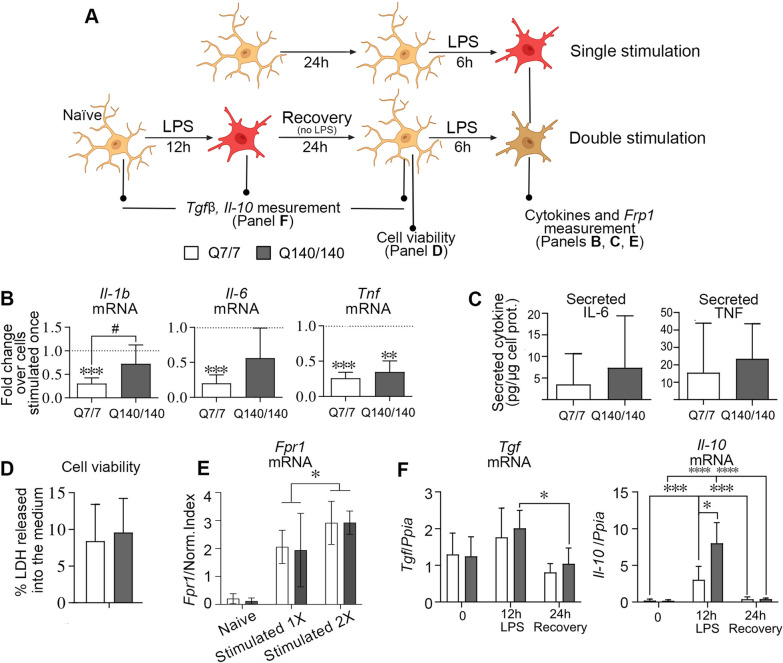
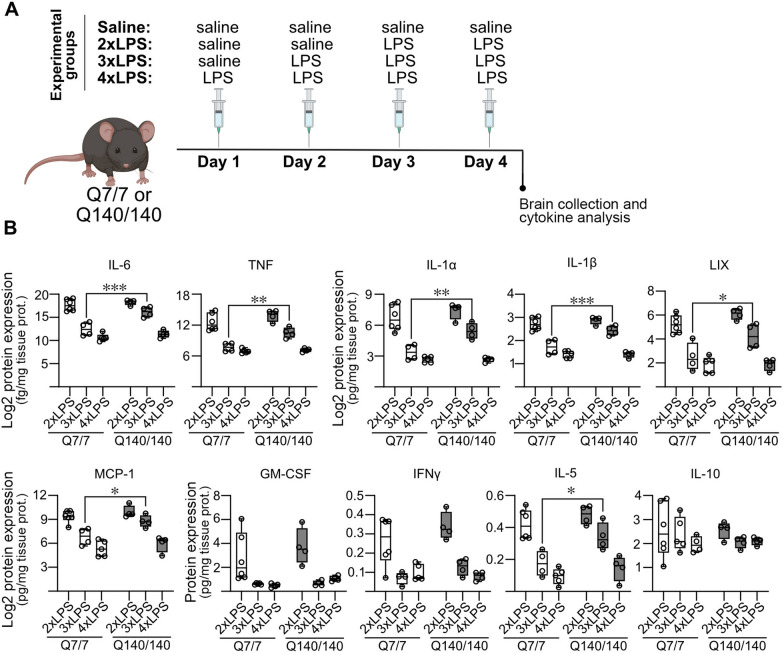
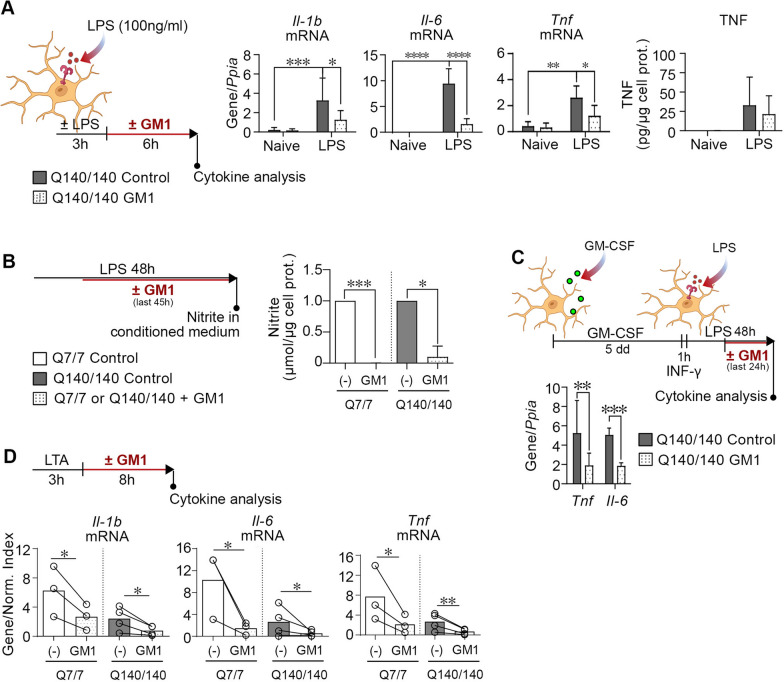
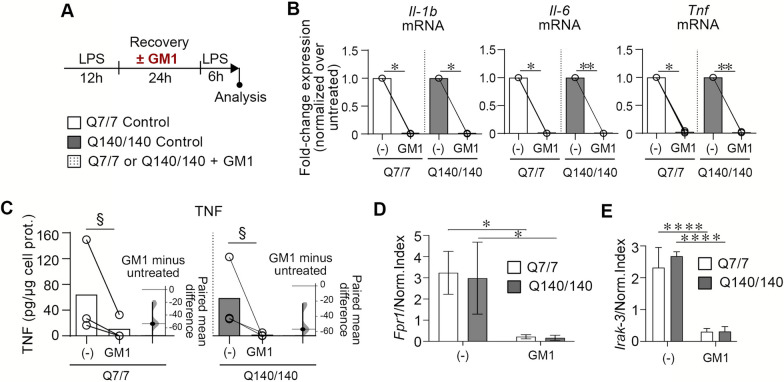
Chronic activation and dysfunction of microglia have been implicated in the pathogenesis and progression of many neurodegenerative disorders, including Huntington's disease (HD). HD is a genetic condition caused by a mutation that affects the folding and function of huntingtin (HTT). Signs of microglia activation have been observed in HD patients even before the onset of symptoms. It is unclear, however, whether pro-inflammatory microglia activation in HD results from cell-autonomous expression of mutant HTT, is the response of microglia to a diseased brain environment, or both. In this study, we used primary microglia isolated from HD knock-in (Q140) and wild-type (Q7) mice to investigate their response to inflammatory conditions in vitro in the absence of confounding effects arising from brain pathology. We show that naïve Q140 microglia do not undergo spontaneous pro-inflammatory activation and respond to inflammatory triggers, including stimulation of TLR4 and TLR2 and exposure to necrotic cells, with similar kinetics of pro-inflammatory gene expression as wild-type microglia. Upon termination of the inflammatory insult, the transcription of pro-inflammatory cytokines is tapered off in Q140 and wild-type microglia with similar kinetics. However, the ability of Q140 microglia to develop tolerance in response to repeated inflammatory stimulations is partially impaired in vitro and in vivo, potentially contributing to the establishment of chronic neuroinflammation in HD. We further show that ganglioside GM1, a glycosphingolipid with anti-inflammatory effects on wild-type microglia, not only decreases the production of pro-inflammatory cytokines and nitric oxide in activated Q140 microglia, but also dramatically dampen microglia response to re-stimulation with LPS in an experimental model of tolerance. These effects are independent from the expression of interleukin 1 receptor associated kinase 3 (Irak-3), a strong modulator of LPS signaling involved in the development of innate immune tolerance and previously shown to be upregulated by immune cell treatment with gangliosides. Altogether, our data suggest that external triggers are required for HD microglia activation, but a cell-autonomous dysfunction that affects the ability of HD microglia to acquire tolerance might contribute to the establishment of neuroinflammation in HD. Administration of GM1 might be beneficial to attenuate chronic microglia activation and neuroinflammation.

Keywords: GM1; Ganglioside; Huntington’s disease; LPS; Microglia; Neuroinflammation; Q140/140 knock-in mice; TLR2; TLR4; Tolerance.


Conflict of interest statement

SS and the University of Alberta hold a patent for the use of GM1 in HD. There are no other competing interests to declare.

Figures

Fig. 1
Fig. 1
Comparable responses of Q7/7 and Q140/140 microglia stimulated with LPS. A Microglia were stimulated with LPS (100 ng/ml) for the indicated times. Expression of Il-1b, Il-6 and Tnf mRNA at each time-point was normalized over the geometric mean of three housekeeping genes (Normalization Index). N ≥ 3. B TNF secreted in the conditioned medium was estimated by ELISA. N ≥ 3. C Nitrite in the conditioned medium. N = 8 for naïve microglia, N ≥ 4 for stimulated microglia. No statistically significant differences between genotypes were found for any of the measurements indicated above at any of the time points, except for TNF secretion at 6 h of LPS stimulation. D Proteins secreted in the conditioned medium after 9 h of cell treatment with 100 ng/ml LPS were quantified using a Luminex® multiplex assay. No statistically significant differences between genotypes were found for any of the cytokines and proteins measured. N = 5. E, F Dose–response of LPS stimulation. Microglia were stimulated for 6 h with LPS at the indicated concentrations and mRNA was quantified by qPCR. No differences in the expression of Il-1b, Il-6 and Tnf mRNA (E), and the amount of TNF released in the medium (F) were observed between Q7/7 and Q140/140 microglia at all concentrations of LPS tested. N = 3 for Q7/7 and N = 4 for Q140/140 microglia. G Microglia were primed with GM-CSF for 4 days, followed by 1 h incubation in IFN-γ and 48 h in LPS to induce a pro-inflammatory state. Expression of Tnf, Il-6 and Il-10 was normalized as in (A). N ≥ 4. H mRNA expression of Spi-1 was measured in control conditions and after stimulation for 12 h with LPS (100 ng/ml) and normalized as in (A). N ≥ 4. In AC and EF, a one-way ANOVA was used to confirm the effect of treatment in each genotype. The paired two-tailed t-test was used to compare differences between genotypes at each time point and LPS concentration. In D, two-tailed t-test was used to compare cytokine expression between genotypes. In H, a two-way ANOVA with Tukey’s comparisons test was used. Bars are mean values ± STDEV. *, p < 0.05; **, p < 0.01
Fig. 2
Fig. 2
Q7/7 and Q140/140 microglia display similar levels of activation in response to TLR2 ligands and necrotic cells. A Schematic experimental design showing the time points for cytokine analysis. Q7/7 and Q140/140 microglia stimulated with LTA (10 μg/ml) for 6, 10 and 24 h express similar levels of Il-1b, Il-6 and Tnf mRNAs (B), and secrete similar amounts of TNF (C) and nitric oxide (D) in the medium. Gene expression was normalized over the geometric mean of three housekeeping genes (Normalization Index). One-way ANOVA was used to confirm an effect of treatment in each genotype. Unpaired two-tailed t-test was used to compare between genotypes at each time point. N ≥ 3. E Microglia were incubated with necrotic N2a cells expressing wild-type HTT exon 1(25Q) or mutant HTT exon 1 (97Q) at the ratio of 1:2 (microglia to necrotic cells). mRNA expression of Il-1b, Il-6 and Tnf was measured after 4 h by qPCR. Graphs show fold change of mRNA expression in Q140/140 microglia compared to Q7/7 microglia exposed to the same type of necrotic cells. N ≥ 4. Ratio paired t-test was used to compare between the genotypes following activation with each specific type of necrotic cell. Bars are mean values ± STDEV. *p < 0.05
Fig. 3
Fig. 3
Q7/7 and Q140/140 microglia display similar kinetics of recovery after LPS stimulation. Q7/7 and Q140/140 microglia were pre-incubated with LPS (100 ng/ml) for 12 h, washed and further incubated in serum-free medium for 6, 24 and 48 h. Expression of Il-1b, Il-6 and Tnf (A, N ≥ 3) and levels of TNF secreted into the medium (B, N ≥ 4) were measured at the end of the incubation with LPS (12 h LPS) and during the recovery phase without LPS. mRNA levels were normalized over the housekeeping gene Ppia (encoding cyclophilin A). One-way ANOVA was used to confirm the effect of time on microglia phenotype of each genotype. An unpaired two-tail t-test was used to compare genotypes at each time-point. Bars are mean values ± STDEV. *p < 0.05, **p < 0.01, ****p < 0.0001
Fig. 4
Fig. 4
Development of tolerance is partially impaired in Q140/Q140 microglia. A Schematic experimental design. Microglia were pre-treated with LPS (100 ng/ml) for 12 h, washed and incubated in serum free medium for an additional 24 h (recovery). A second stimulation with LPS (100 ng/ml) was performed for 6 h. Control groups were stimulated only once with LPS for 6 h. B Expression of Il-1b, Il-6 and Tnf after the second stimulation with LPS is reported as fold-change compared to cells stimulated only once (baseline represented by the horizontal dotted line in each graph). mRNA levels were normalized over the geometric mean of three housekeeping genes. Ratio t-test. Asterisks show significant differences compared to the baseline of cells stimulated only once. The symbol # shows a statistically significant difference between genotypes. N ≥ 5. C Levels of IL-6 (N ≥ 4) and TNF (N ≥ 5) released by microglia in the culture medium. D Quantification of LDH released in the medium during 24 h recovery period following the first LPS stimulation. Similar levels of LDH released in the medium by Q7/7 and Q140/140 cells indicate microglia were healthy and had similar viability at the time of the second stimulation with LPS. Two-tailed paired t-test. N = 3. E Expression of the non-tolerizeable gene Fpr1 is increased to a similar extent in Q7/7 and Q140/140 microglia stimulated for a second time with LPS, indicating gene priming. Two-way ANOVA and Sidak’s multiple comparisons post-test. F Il-10 and Tgfb mRNA expression in naïve microglia, at the end of the first stimulation with LPS and immediately prior exposure to the second dose of LPS (24 h recovery). mRNA levels were normalized over cyclophilin A levels. N ≥ 4 One-way ANOVA and Tukey’s multiple comparison post-test were used to compare gene expression changes across time points for each genotype. Comparisons between genotypes at each time point were performed with the unpaired two-tail t-test. Bars are mean values ± STDEV. *p < 0.05, **p < 0.01, ***p < 0.001, ****p < 0.0001
Fig. 5
Fig. 5
In vivo development of tolerance is partially impaired or delayed in the brain of Q140/140 mice. A Schematic experimental design. Q7/7 and Q140/140 mice received daily intraperitoneal injections of saline or LPS (0.5 mg/kg) for 4 consecutive days, according to the indicated scheme. Two injections of LPS (2X LPS) on consecutive days were used to trigger inflammation in the brain. Three or four injections of LPS were performed to induce tolerance. B Cytokines in brain cortex homogenates were measured with a Luminex® multiplex assay. In tolerized (3X LPS) Q140/140 mice, the levels of several pro-inflammatory cytokines were significantly higher than in Q7/7 mice. A fourth LPS injection was needed to lower Q140/140 cytokine levels to Q7/7 levels. N ≥ 4. Two-way ANOVA with Sidak’s multiple comparisons test. *, p < 0.05; **, p < 0.01; ***, p < 0.001
Fig. 6
Fig. 6
GM1 dampens pro-inflammatory cytokines and NO production in Q140/140 and Q7/7 microglia. A Schematic experimental design and cytokine measurements. Q140/140 microglia were pre-treated with or without LPS (100 ng/ml) for 3 h, followed by washes and incubation with GM1 (50 µM) or vehicle (PBS) for 6 h. GM1 incubation significantly decreases the expression of Il-1b, Il-6 and Tnf (N ≥ 4). Gene expression was normalized over the housekeeping gene Ppia. TNF secreted in the conditioned medium (N = 5) was normalized over the total cell protein content of the cells in each well. Two-way ANOVA with Tukey's multiple comparisons test. *p < 0.05, **p < 0.01, ***p < 0.001, ****p < 0.0001. B Microglia were treated with 100 ng/ml LPS for 3 h, followed by incubation with or without GM1 for 45 h. Levels of nitrite in the conditioned medium were normalized to total cell proteins. N ≥ 3. Two-way ANOVA with Sidak multiple comparison test. C Q140/140 microglia were polarized towards a pro-inflammatory phenotype by incubation with GM-CSF for 4 days, followed by 1 h priming with INF-γ and 48 h stimulation with LPS. GM1 or control vehicle were added for the last 24 h of incubation in LPS. Gene expression was normalized over Ppia. Ratio paired t-test. D Q7/7 and Q140/140 microglia were incubated with or without LTA (10 μg/ml) for 3 h, followed by washes and treatment with vehicle or GM1 (50 µM) for 8 h. GM1 significantly reduces the expression of Il-1b, Il-6 and Tnf mRNA. Gene expression was normalized over the geometric mean of three housekeeping genes (Normalization Index). Ratio paired t-test. Bars are mean values ± STDEV. *p < 0.05, **p < 0.01, ***p < 0.001
Fig. 7
Fig. 7
GM1 dampens microglia reactivation in an experimental model of tolerance. A Experimental design. Microglia were stimulated with LPS (100 ng/ml) for 12 h, then washed and let recover in serum-free medium for 24 h in the presence or absence of GM1 (50 µM). After several washes to remove GM1, a second stimulation with LPS (100 ng/ml) was performed for 6 h, at the end of which, cytokine expression and secretion were measured. B Expression of Il-1b, Il-6 and Tnf mRNA was normalized over the geometric mean of three housekeeping genes (Normalization Index). N = 3. Ratio paired t-test. C TNF secreted in medium. Data are presented as a paired estimation plot including individual data points (independent experiments), mean values shown by bars, and the bootstrap 95% confidence interval for the effect size. N = 3. §, p = 0 as per paired estimation plot. D Fpr1 expression was measured in microglia stimulated twice with LPS as per experimental design in (A). GM1 presence during the recovery period represses the expression of the non-tolerizeable gene Fpr1. E Cells were treated as in (A). The expression of Irak-3 is similar in Q7/7 and Q140/140 cells. The presence of GM1 during the recovery period prevents upregulation of Irak-3 after re-stimulation with LPS. Two-way ANOVA with Sidak’s multiple comparison post-test was conducted in D and E. Bars are mean values ± STDEV. *p < 0.05, **p < 0.01, ****p < 0.0001

Similar articles

Cited by

References

    1. Reiner A, Dragatsis I, Dietrich P. Genetics and neuropathology of Huntington's disease. Int Rev Neurobiol. 2011;98:325–372. doi: 10.1016/B978-0-12-381328-2.00014-6. - DOI - PMC - PubMed
    1. A novel gene containing a trinucleotide repeat that is expanded and unstable on Huntington's disease chromosomes. The Huntington's Disease Collaborative Research Group. Cell. 1993;72(6):971–83. - PubMed
    1. Warby SC, Montpetit A, Hayden AR, Carroll JB, Butland SL, Visscher H, et al. CAG expansion in the Huntington disease gene is associated with a specific and targetable predisposing haplogroup. Am J Hum Genet. 2009;84(3):351–366. doi: 10.1016/j.ajhg.2009.02.003. - DOI - PMC - PubMed
    1. Tabrizi SJ, Flower MD, Ross CA, Wild EJ. Huntington disease: new insights into molecular pathogenesis and therapeutic opportunities. Nat Rev Neurol. 2020;16(10):529–546. doi: 10.1038/s41582-020-0389-4. - DOI - PubMed
    1. Hazeki N, Nakamura K, Goto J, Kanazawa I. Rapid aggregate formation of the huntingtin N-terminal fragment carrying an expanded polyglutamine tract. Biochem Biophys Res Commun. 1999;256(2):361–366. doi: 10.1006/bbrc.1999.0337. - DOI - PubMed