. 2023 Nov 23;21(1):845.
doi: 10.1186/s12967-023-04694-3.

Altered m6A RNA methylation governs denervation-induced muscle atrophy by regulating ubiquitin proteasome pathway

Affiliations

Altered m6A RNA methylation governs denervation-induced muscle atrophy by regulating ubiquitin proteasome pathway

Junjie Sun et al. J Transl Med. .

Abstract

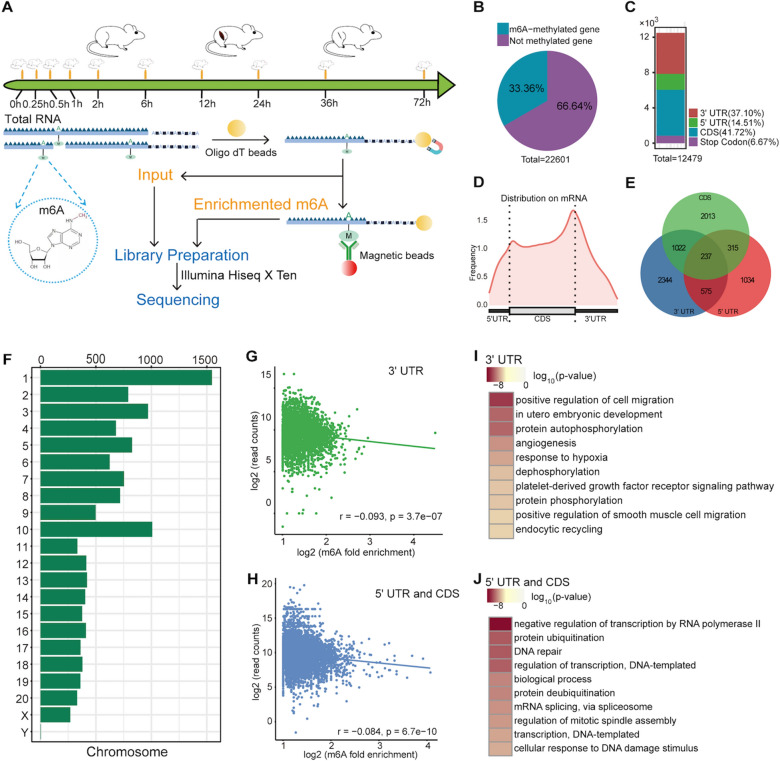
Background: Denervation-induced muscle atrophy is complex disease involving multiple biological processes with unknown mechanisms. N6-methyladenosine (m6A) participates in skeletal muscle physiology by regulating multiple levels of RNA metabolism, but its impact on denervation-induced muscle atrophy is still unclear. Here, we aimed to explore the changes, functions, and molecular mechanisms of m6A RNA methylation during denervation-induced muscle atrophy.

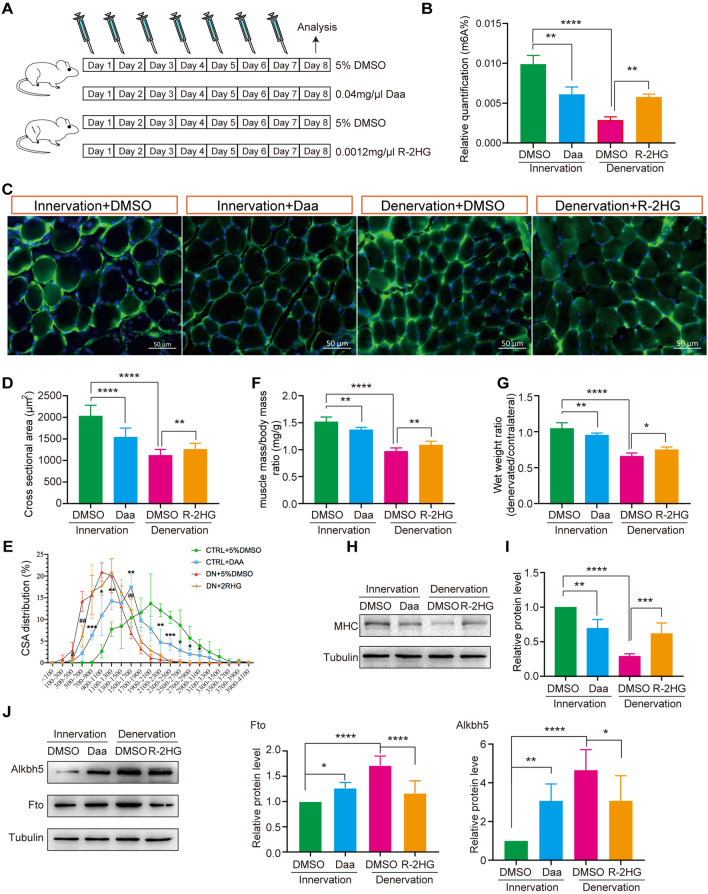
Methods: During denervation-induced muscle atrophy, the m6A immunoprecipitation sequencing (MeRIP-seq) as well as enzyme-linked immunosorbent assay analysis were used to detect the changes of m6A modified RNAs and the involved biological processes. 3-deazidenosine (Daa) and R-2-hydroxyglutarate (R-2HG) were used to verify the roles of m6A RNA methylation. Through bioinformatics analysis combined with experimental verification, the regulatory roles and mechanisms of m6A RNA methylation had been explored.

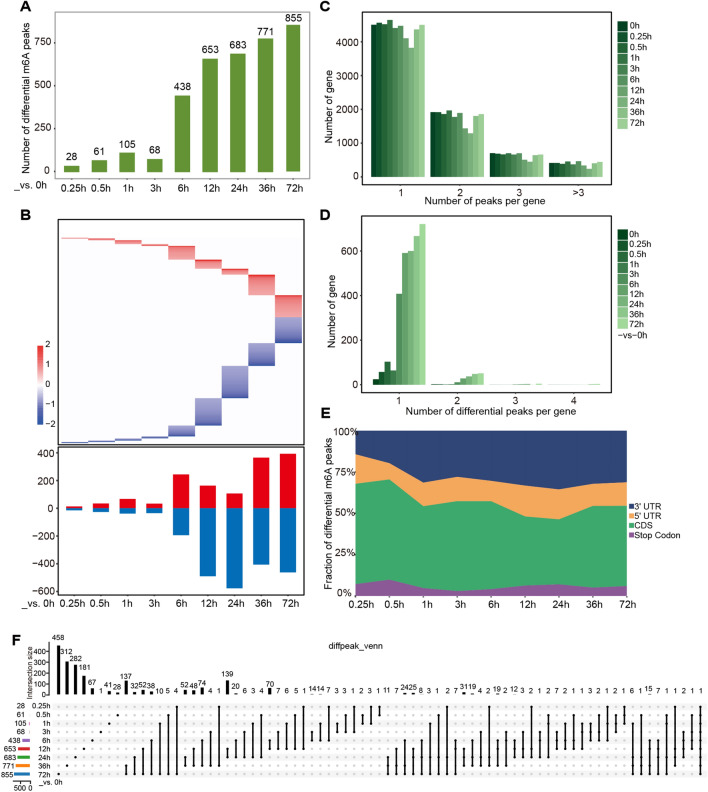
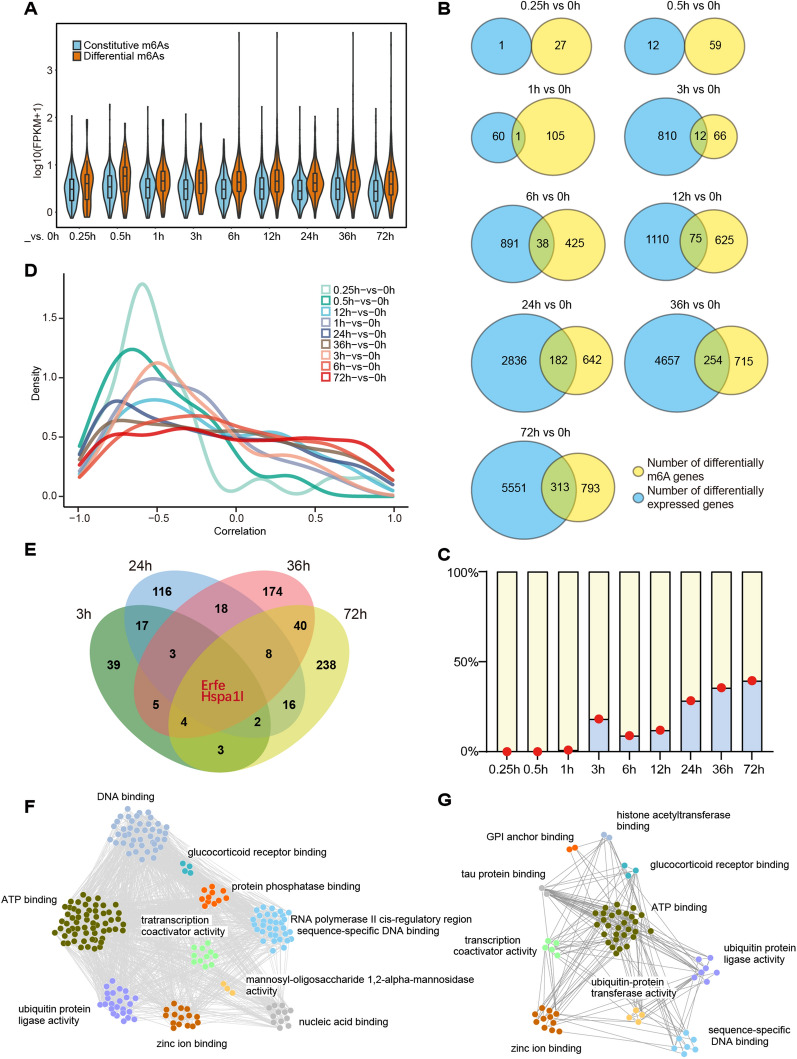
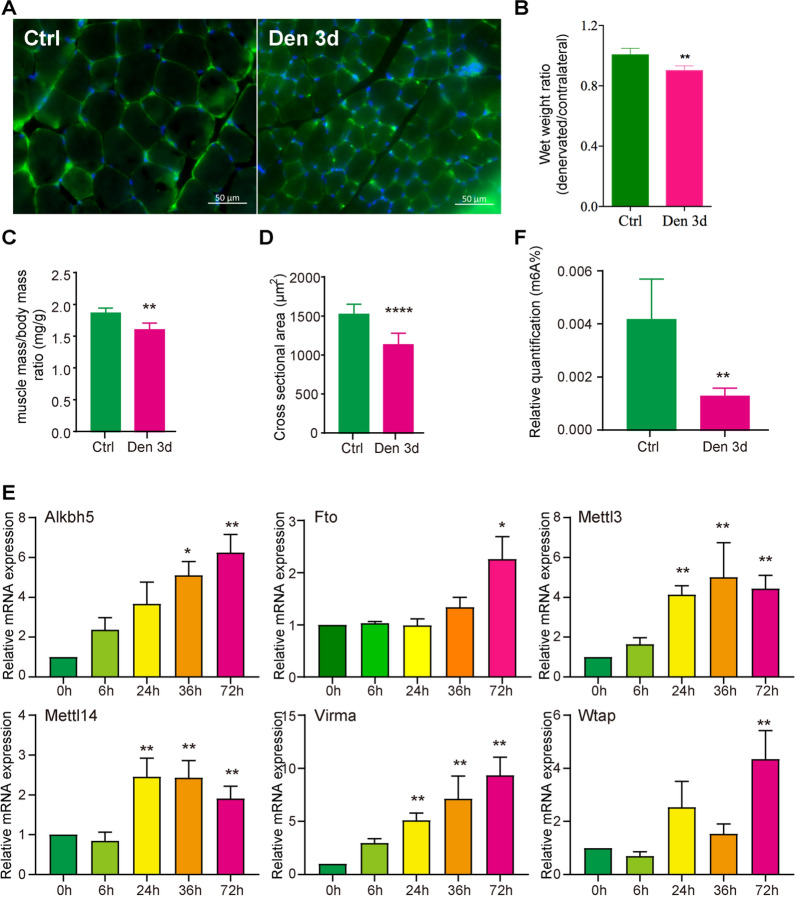
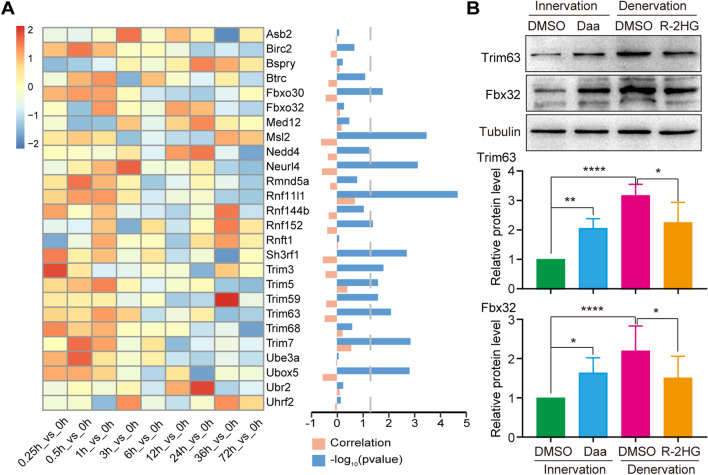
Results: There were many m6A modified RNAs with differences during denervation-induced muscle atrophy, and overall, they were mainly downregulated. After 72 h of denervation, the biological processes involved in the altered mRNA with m6A modification were mainly related to zinc ion binding, ubiquitin protein ligase activity, ATP binding and sequence-specific DNA binding and transcription coactivator activity. Daa reduced overall m6A levels in healthy skeletal muscles, which reduced skeletal muscle mass. On the contrary, the increase in m6A levels mediated by R-2HG alleviated denervation induced muscle atrophy. The m6A RNA methylation regulated skeletal muscle mass through ubiquitin-proteasome pathway.

Conclusion: This study indicated that decrease in m6A RNA methylation was a new symptom of denervation-induced muscle atrophy, and confirmed that targeting m6A alleviated denervation-induced muscle atrophy.

Keywords: Denervation; Muscle atrophy; Ubiquitin–proteasome pathway; m6A.


Conflict of interest statement

The authors declare that they have no competing interests.

Figures

Fig. 1
Fig. 1
m6A features of pre-atrophic skeletal muscle. A A schematic diagram for the construction of the denervation-induced muscle atrophy model and MeRIP-seq library. B The proportion of genes with and without m6A methylated modification in pre-atrophic skeletal muscle. C, D The distribution of m6A peaks in various regions of mRNA transcripts. E The Venn diagram of m6A modified genes across transcription regions. F The distribution of m6A modification on different chromosomes. G The correlation analysis between the expression level of methylated transcripts and m6A in 3′ UTR. The x-axis represents the m6A enrichment multiple of log2 conversion, and the y-axis represents the read numbers of transcripts that undergos log2 conversion. H. Correlation analysis between the expression levels of transcripts containing methylation modifications and m6A in 5′ UTR and CDS. I. The functional analysis of 3′ UTR containing methylation modified genes. The darker the color, the higher the significance of this pathway. J. The functional analysis of 5′ UTR and CDS containing methylation modified genes
Fig. 2
Fig. 2
m6A methylation changes during denervation-induced muscle atrophy. A The number of differential m6A peaks at different time points during denervation-induced muscle atrophy. B The fold changes of differential m6A peaks at different time points. The above heat map displayed the distribution of the fold change, while the below column chart showed the number of m6A peaks up (red) and down (blue), respectively. C The proportion of host genes containing differential m6A peaks. D The proportion of genes containing varying numbers of differential m6A peaks at different time points. E The percentage of differential m6A distributed in different gene regions during denervation-induced muscle atrophy. F The Venn diagram of differential m6A peaks at different time points during denervation-induced muscle atrophy. (The intersections of m6A genes and convert the peak information into gene names to summarize the list in Additional file 2: File S1.)
Fig. 3
Fig. 3
m6A methylation regulates muscle gene expression after denervation. A The expression levels of constitutive and differential m6A host genes. The violin diagram showed the maximum and minimum values, as well as the histogram of gene expression levels. The box plot in the middle represented the interquartile range. B The statistics of the numbers of differentially expressed genes (blue), differential m6A host genes (yellow), and overlapping genes (green) at different time points. C The proportion of overlapped genes in B among all differential m6A host genes (represented by red dots). D Correlation analysis between the differential m6A gene and its corresponding gene expression at 9 time points in B. The y-axis represented the density of the genes, while the x-axis centered around 0 represented negative correlation on the left and positive correlation on the right. E. For the four time points with the higher proportion in C, the overlapping genes, Erfe and Hspa1l, were differentially expressed genes regulated by m6A at each time point. F Functional analysis of differential m6A host genes at 72 h of denervation. The biological processes of TOP10 were displayed, and the lines indicated the interactions between genes. G Functional analysis of m6A methylated differentially expressed genes at 72 h of denervation. The biological processes of TOP10 were displayed, and the genes were analyzed by PPI. The lines indicated the interactions between genes
Fig. 4
Fig. 4
Changes in m6A regulators expression during denervation-induced muscle atrophy. A Immunofluorescence staining of skeletal muscles after denervation for 0 h (Ctrl) and 72 h (Den 3d), Bar = 50 μm, blue: DAPI, green: laminin. B Statistical results of wet weight ratio after denervation for 0 h (Ctrl) and 72 h (Den 3d). C Statistical results of the muscle mass/body mass ratio after 0 h and 72 h of denervation, n = 5. D Statistical results of cross-sectional area of skeletal muscle fibers after 0 h and 72 h of denervation, n = 5. E The qPCR results of several common m6A regulators, Alkbh5, Fto, Mettl3, Mettl14, Virma, and Wtap, during the denervation-induced muscle atrophy, n = 3. F The statistical results of m6A levels in skeletal muscle after 0 h and 72 h of denervation, n = 4. The p values were calculated through unpaired t-test, *p < 0.05, **p < 0.01, ****p < 0.0001. Unmarked columns have no statistical significance
Fig. 5
Fig. 5
Increased m6A methylation level alleviates denervated muscle atrophy. A Schematic diagram of drug injection. B The levels of m6A in skeletal muscle after drug injection, p-value calculated through unpaired t-test, n = 4, **p < 0.01. C Immunofluorescence staining results of skeletal muscles after drug injection, Bar = 50 μm, blue: DAPI, green: laminin. D Statistical results of cross-sectional area of skeletal muscle fibers. E The distribution of muscle fiber cross sectional area after different drug treatments, p-value calculated through unpaired t-test, n = 4, *p < 0.05, **p < 0.01, ***p < 0.001, ****p < 0.0001 vs Inn + DMSO group; #p < 0.05, ##p < 0.01, ###p < 0.001 vs Den + DMSO group. F Statistical results of the muscle mass/body mass ratio after drug treatment. G Statistical results of skeletal muscle wet weight ratio after drug treatment. H Western blot results of MHC expression after drug treatment. I Statistical results of MHC protein level. J Western blot and statistical results of Alkbh5 and Fto levels after drug treatment. p-value calculated through unpaired t-test, n = 3, *p < 0.05, **p < 0.01, ***p < 0.001, ****p < 0.0001
Fig. 6
Fig. 6
m6A methylation regulates ubiquitin proteasome system. A Expression analysis of ubiquitin proteasome related genes. The heat map on the left showed the expression changes of the ubiquitin proteasome related genes with differential m6A methylation during muscle atrophy. The orange column in the right figure represented the correlation between gene m6A modification and gene expression, while the blue column represented the p-value corresponding to the correlation. B The effects of Daa and R-2HG on the levels of two E3 ubiquitin ligases (Trim63 and Fbx32). Tubulin was used as a loading control, p-value calculated through unpaired t-test, n = 5, *p < 0.05, **p < 0.01, ****p < 0.0001

References

    1. Cohen S. Role of calpains in promoting desmin filaments depolymerization and muscle atrophy. Biochim Biophys Acta Mol Cell Res. 2020;1867(10):118788. doi: 10.1016/j.bbamcr.2020.118788. - DOI - PubMed
    1. Scheib J, Höke A. Advances in peripheral nerve regeneration. Nat Rev Neurol. 2013;9(12):668–676. doi: 10.1038/nrneurol.2013.227. - DOI - PubMed
    1. Zhang L, Li M, Wang W, Yu W, Liu H, Wang K, Chang M, Deng C, Ji Y, Shen Y, et al. Celecoxib alleviates denervation-induced muscle atrophy by suppressing inflammation and oxidative stress and improving microcirculation. Biochem Pharmacol. 2022;203:115186. doi: 10.1016/j.bcp.2022.115186. - DOI - PubMed
    1. Ji Y, Li M, Chang M, Liu R, Qiu J, Wang K, Deng C, Shen Y, Zhu J, Wang W, et al. Inflammation: roles in skeletal muscle atrophy. Antioxidants (Basel) 2022;11(9):1686. doi: 10.3390/antiox11091686. - DOI - PMC - PubMed
    1. Huang L, Li M, Deng C, Qiu J, Wang K, Chang M, Zhou S, Gu Y, Shen Y, Wang W, et al. Potential therapeutic strategies for skeletal muscle atrophy. Antioxidants (Basel) 2022;12(1):44. doi: 10.3390/antiox12010044. - DOI - PMC - PubMed

Publication types

LinkOut - more resources