. 2023 Nov 23;24(1):265.
doi: 10.1186/s13059-023-03107-4.

Multi-omics analysis reveals the molecular response to heat stress in a "red tide" dinoflagellate

Affiliations

Multi-omics analysis reveals the molecular response to heat stress in a "red tide" dinoflagellate

Katherine E Dougan et al. Genome Biol. .

Abstract

Background: "Red tides" are harmful algal blooms caused by dinoflagellate microalgae that accumulate toxins lethal to other organisms, including humans via consumption of contaminated seafood. These algal blooms are driven by a combination of environmental factors including nutrient enrichment, particularly in warm waters, and are increasingly frequent. The molecular, regulatory, and evolutionary mechanisms that underlie the heat stress response in these harmful bloom-forming algal species remain little understood, due in part to the limited genomic resources from dinoflagellates, complicated by the large sizes of genomes, exhibiting features atypical of eukaryotes.

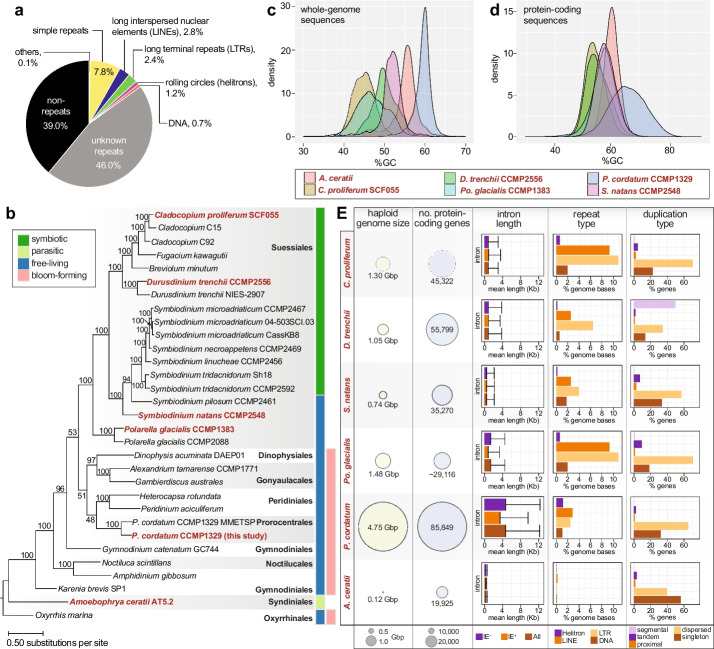
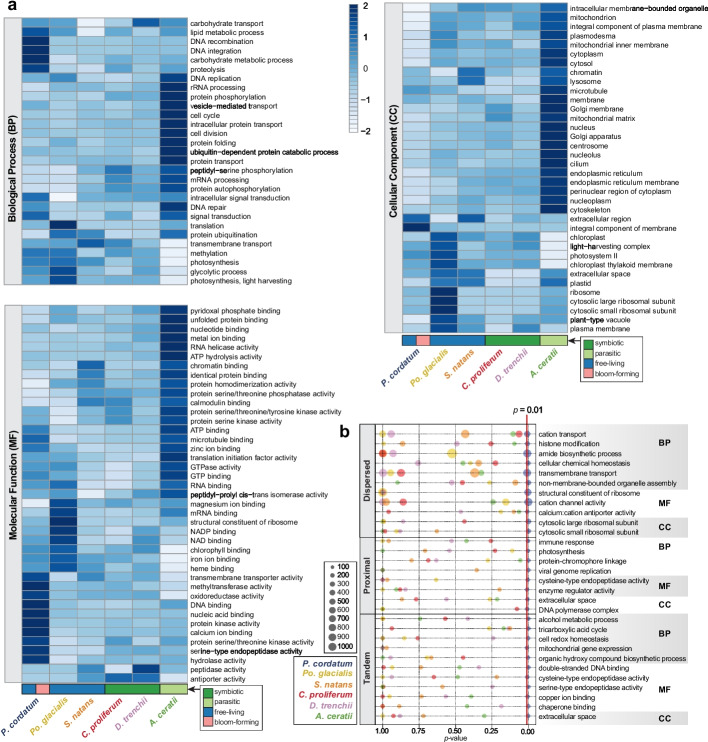
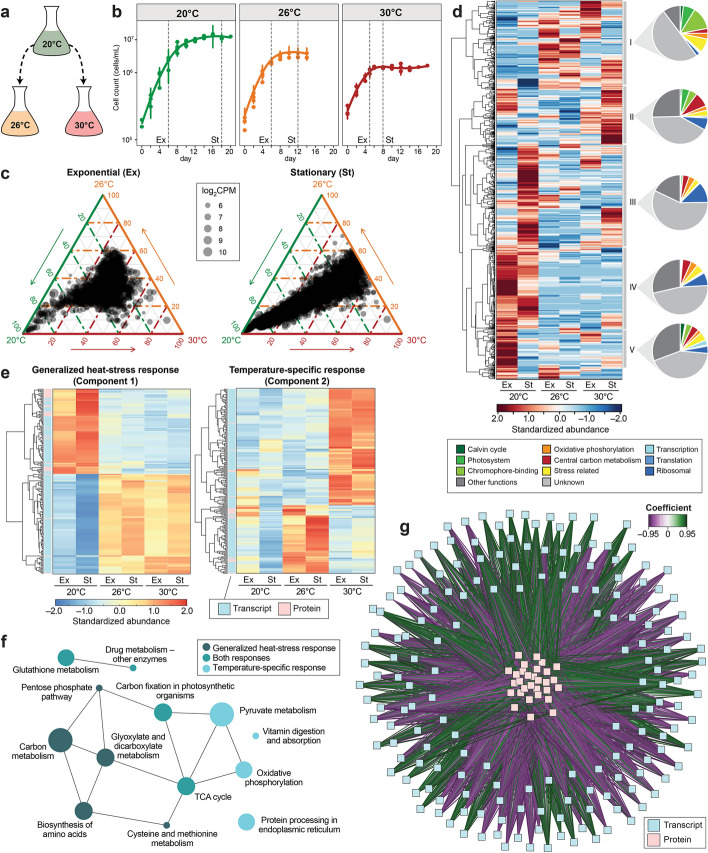
Results: We present the de novo assembled genome (~ 4.75 Gbp with 85,849 protein-coding genes), transcriptome, proteome, and metabolome from Prorocentrum cordatum, a globally abundant, bloom-forming dinoflagellate. Using axenic algal cultures, we study the molecular mechanisms that underpin the algal response to heat stress, which is relevant to current ocean warming trends. We present the first evidence of a complementary interplay between RNA editing and exon usage that regulates the expression and functional diversity of biomolecules, reflected by reduction in photosynthesis, central metabolism, and protein synthesis. These results reveal genomic signatures and post-transcriptional regulation for the first time in a pelagic dinoflagellate.

Conclusions: Our multi-omics analyses uncover the molecular response to heat stress in an important bloom-forming algal species, which is driven by complex gene structures in a large, high-G+C genome, combined with multi-level transcriptional regulation. The dynamics and interplay of molecular regulatory mechanisms may explain in part how dinoflagellates diversified to become some of the most ecologically successful organisms on Earth.

Keywords: Dinoflagellates; Genome evolution; Harmful algal bloom; Heat stress; Molecular regulation; Molecular response.


Conflict of interest statement

The authors declare that they have no competing interests.

Figures

Fig. 1
Fig. 1
Genome features of P. cordatum. a Distribution of repeat types in the P. cordatum genome. b Maximum likelihood tree inferred using 3507 strictly orthologous, single-copy protein sets among 31 dinoflagellate taxa, with ultrafast bootstrap support (based on 2000 replicate samples) shown at each internal node; unit of branch length is number of substitutions per site. The ecological niche for each taxon is shown on the right of the tree. The five representative taxa and P. cordatum from this study are highlighted on the tree in red text. Distribution of G+C content for c whole-genome sequences and d protein-coding sequences relative to the other five representative genomes. e Genome and gene features of P. cordatum relative to the other five taxa, showing haploid genome size estimated based on sequence data, number of protein-coding genes, intron lengths, and separately for introns that contain introner elements (IE+), and those that lack these elements (IE), known repeat types, and types of duplicated genes
Fig. 2
Fig. 2
Gene functions encoded in the P. cordatum genome. a Gene functions encoded in the genome of P. cordatum and the other five representative taxa based on relative abundance of Gene Ontology (GO) terms per genome, shown for categories of Biological Process (BP), Molecular Function (MF), and Cellular Component (CC). The ecological niche for each taxon is shown at the bottom of the heatmaps. b GO terms that are significantly enriched (p < 0.01) among genes for each duplication type (i.e., dispersed, proximal and tandem) in P. cordatum, relative to p-values observed for the other taxa, and the associated number of genes for each GO term
Fig. 3
Fig. 3
Integrated analysis of the transcriptome and proteome response of P. cordatum to heat stress. a Experimental design. b Growth of P. cordatum at 20, 26, and 30°C. Collection of cells for multi-omics analysis is indicated by dashed vertical lines (Ex: exponential, St: stationary phase). c Ternary plots of highly expressed gene models with mean log2(count per million) > 5 in response to temperature and growth phase (8593 transcripts in each plot). d Clustering of 2098 differentially abundant proteins in response to temperature and growth phase. Abundances of proteins were calculated from standardized peptide counts. e Heatmap of transcripts and proteins showing significant correlations for generalized heat stress response (component 1) and temperature-specific response (component 2). f Over-represented KEGG pathways in the networks of generalized and temperature-specific heat stress response. g DIABLO network of generalized heat stress response (component 1) revealing positive and negative correlations (coefficient ≥ 0.7) between transcripts and proteins
Fig. 4
Fig. 4
Heat stress response of central modules of energy and carbon metabolism in P. cordatum. a Temperature-dependent dynamics of sub-transcriptomes (left) and sub-proteomes (right) associated with photosynthesis (PH), central metabolism (CM), and oxidative phosphorylation (OP). Colored circles represent individual transcripts and proteins, respectively, with their areas proportional to the determined abundances. For the proteome, heights of the CM- and OP-bands (marked with an asterisk) were magnified tenfold to allow easier comparison with the PH-band. Expression of transcripts, proteins, and metabolites is shown for functions specific to b light reaction of photosynthesis, showing CCP, carotenoid/chlorophyll-binding protein; CP, chlorophyll-binding protein; FCP, fucoxanthin/chlorophyll-binding protein; FNR, ferredoxin:NADP oxidoreductase; OEC, oxygen evolving complex; and PS, photosystem; c central metabolism including CO2-concentrating Calvin cycle, central carbon metabolism, and selected biosynthesis of amino acids, showing PEPC, phosphoenolpyruvate carboxylase; GBSS, granule-bound starch synthase (NDP-glucose-starch glycosyltransferase); GLS, glutamine synthetase; PGK, phosphoglycerate kinase; PRK, phosphoribulokinase; PSPH, phosphoserine phosphatase; and SS, starch synthase; and d oxidative phosphorylation. A detailed scheme is presented in Additional File 2: Fig. S12
Fig. 5
Fig. 5
The transcriptome landscape under heat stress. The expression pattern of dispersed duplicated genes under treatments comparing 26°C against 20°C at St phase, shown for homologous sequence sets that contain a two and b three copies, in three possible outcomes: upregulated (+), downregulated (−), and not significant (·). c Proportion of dispersed DEGs that share similar expression pattern in homologous sets containing ≥ 3 of such copies. d Heatmap and clusters of gene expression pattern across triplicate samples at 20, 26, and 30°C in the St phase, showing eight superclusters (SCs). Centered log2(FPKM + 1) values are shown. e Post-transcriptional regulation in P. cordatum, shown for 4550 genes in distinct duplication modes (counter-clockwise): dispersed, tandem, proximal, and singleton. Features shown from the inner-most to the outer-most circle: differential exon usage (blue), differential editing of mRNA per gene in response to growth phase (green/brown), and differential mRNA editing per gene in response to temperature (red/purple). In each circle, a bar in a light shade indicates the number of corresponding features identified in a gene, a bar in a dark shade indicates the number of statistically significant features in a gene. The bottom-left legend shows the distinct scenarios for identifying sites for mRNA editing in all transcripts versus differentially edited sites
Fig. 6
Fig. 6
Expression and structure of multi-protein-coding genes in P. cordatum. The example of HSP70 is shown for a clustering of distinct gene models based on gene expression pattern in a heatmap across growth conditions, with cumulative abundance of transcripts and proteins indicated at the bottom, and b the relative exon usage, CDS structure, and mRNA editing of gene model s12246_g74608 that harbors multiple CUs. Exon (E) is connected by introns (kinked line); each of E01, E03, E05, and E07 encodes a complete HSP70, E09, and E10 each encodes N-/C-terminal fragments, whereas the other exons encode spacers. The example of RuBisCo is shown for c clustering of gene models based on gene expression pattern in a heatmap across growth conditions, with cumulative abundance of transcripts and proteins indicated at the bottom, and d protein structures corresponding to complete CUs, N- and C-terminal fragments, spacer, and putative leader sequences, with detected peptides indicated at the bottom. e Aligned upstream regions of 16 complete RuBisCo proteins of P. cordatum, including leader sequence and representative spacer sequences where available. Basic residues are marked in dark blue and conserved regions are highlighted in a purple background

References

    1. Brown AR, Lilley M, Shutler J, Lowe C, Artioli Y, Torres R, et al. Assessing risks and mitigating impacts of harmful algal blooms on mariculture and marine fisheries. Rev Aquac. 2020;12:1663–1688. doi: 10.1111/raq.12403. - DOI
    1. Wells ML, Karlson B, Wulff A, Kudela R, Trick C, Asnaghi V, et al. Future HAB science: directions and challenges in a changing climate. Harmful Algae. 2020;91:101632. doi: 10.1016/j.hal.2019.101632. - DOI - PubMed
    1. Karlson B, Andersen P, Arneborg L, Cembella A, Eikrem W, John U, et al. Harmful algal blooms and their effects in coastal seas of Northern Europe. Harmful Algae. 2021;102:101989. doi: 10.1016/j.hal.2021.101989. - DOI - PubMed
    1. Murray SA, Kohli GS, Farrell H, Spiers ZB, Place AR, Dorantes-Aranda JJ, et al. A fish kill associated with a bloom of Amphidinium carterae in a coastal lagoon in Sydney Australia. Harmful Algae. 2015;49:19–28. doi: 10.1016/j.hal.2015.08.003. - DOI - PMC - PubMed
    1. Gobler CJ. Climate change and harmful algal blooms: insights and perspective. Harmful Algae. 2020;91:101731. doi: 10.1016/j.hal.2019.101731. - DOI - PubMed

Publication types