. 2023 Nov 23;42(1):315.
doi: 10.1186/s13046-023-02877-w.

Transcriptomic landscape based on annotated clinical features reveals PLPP2 involvement in lipid raft-mediated proliferation signature of early-stage lung adenocarcinoma

Affiliations

Transcriptomic landscape based on annotated clinical features reveals PLPP2 involvement in lipid raft-mediated proliferation signature of early-stage lung adenocarcinoma

Yibei Wang et al. J Exp Clin Cancer Res. .

Abstract

Background: Image-based screening improves the detection of early-stage lung adenocarcinoma (LUAD)but also highlights the issue of high false-positive diagnoses, which puts patients at a risk of unnecessary over-treatment. Therefore, more precise discrimination criteria are required to ensure that patients with early-stage LUAD receive appropriate treatments.

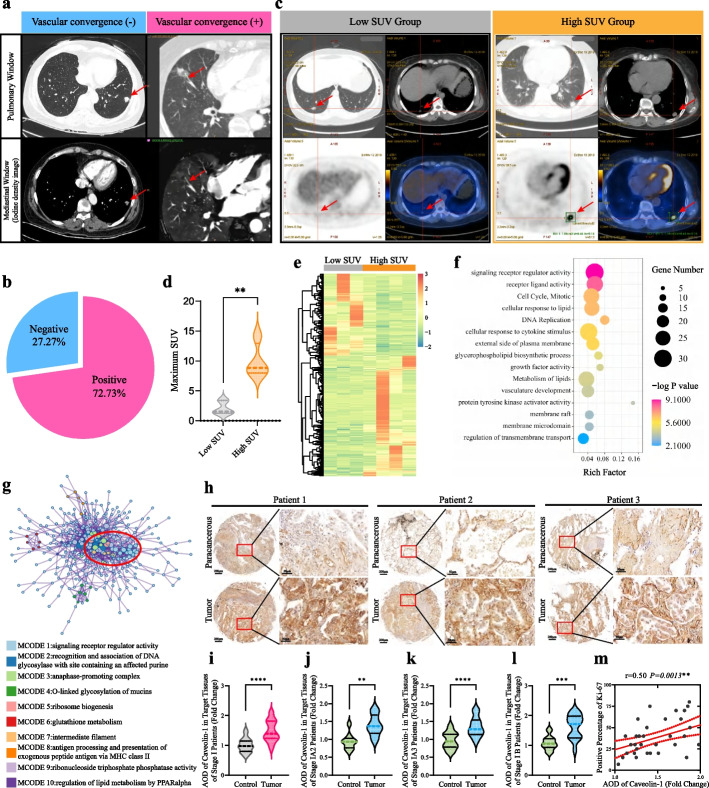
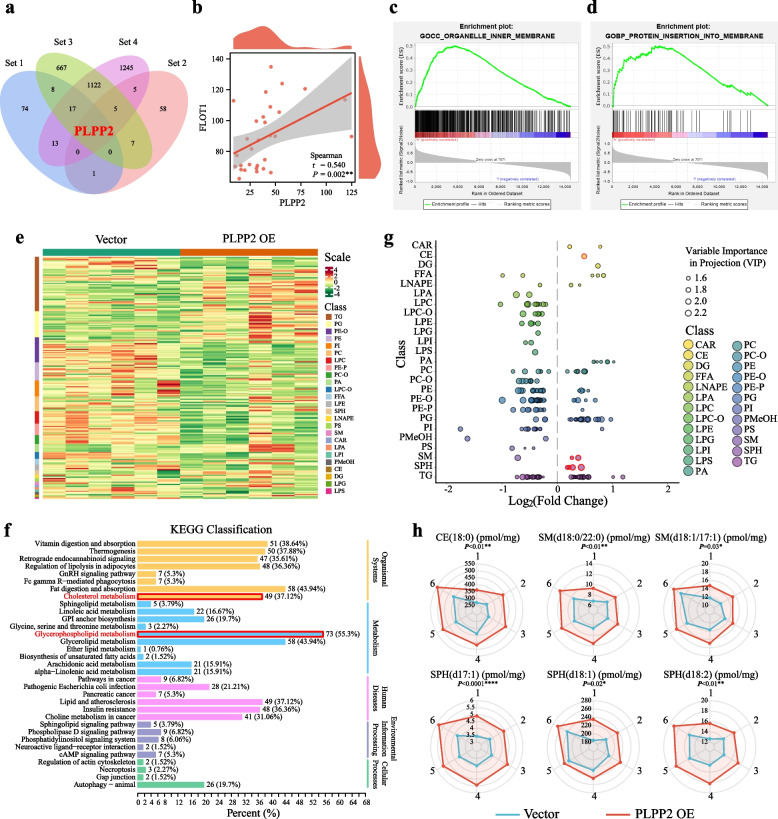
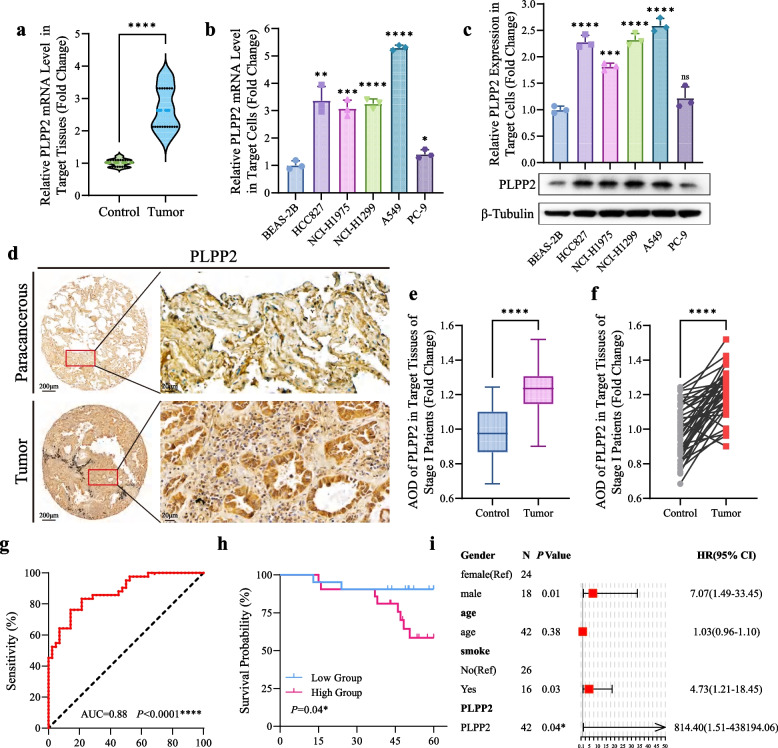
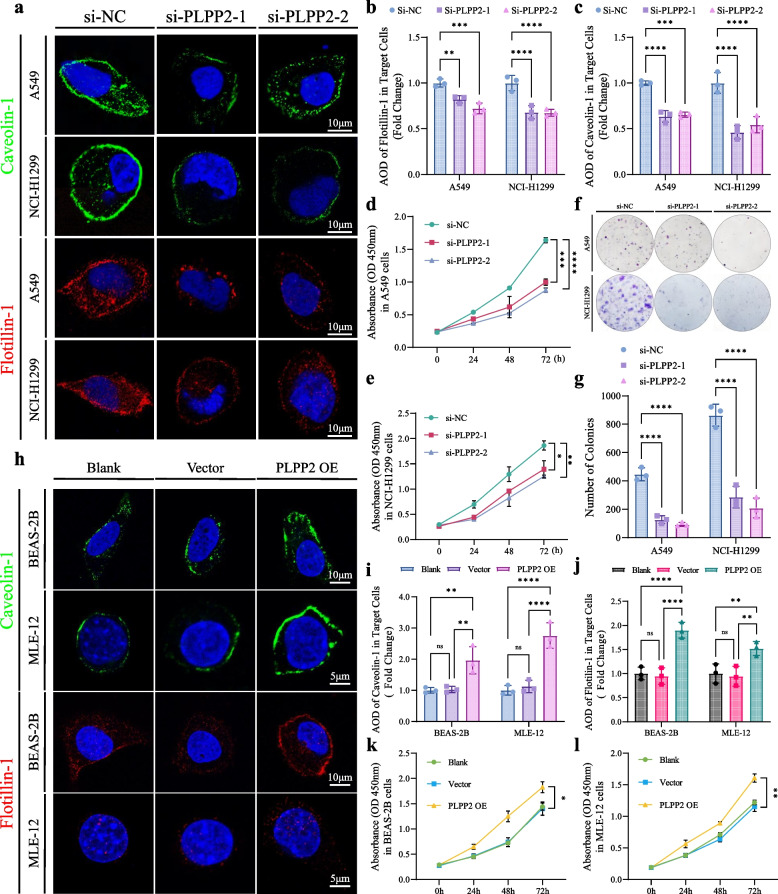
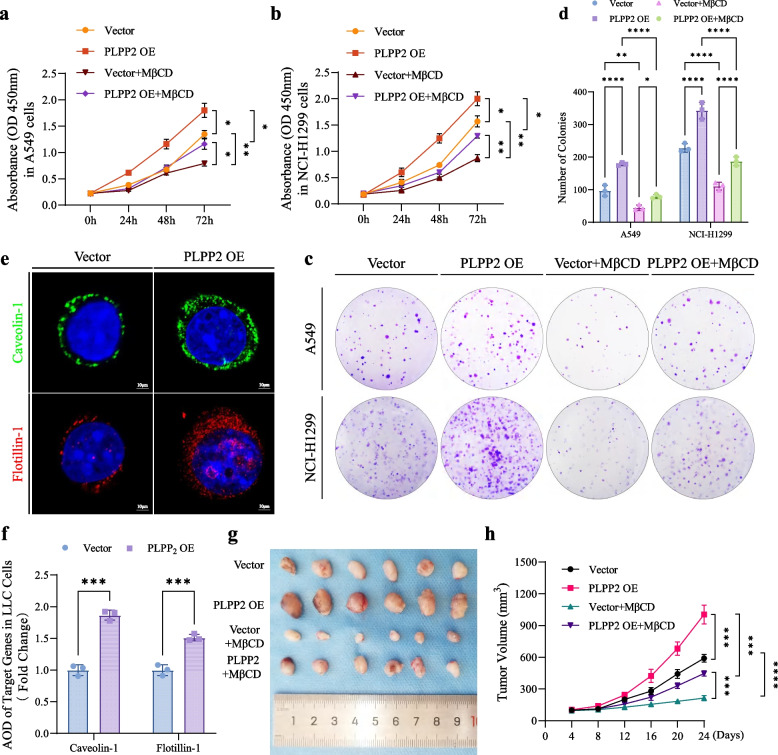
Methods: We integrated 158 early-stage LUAD cases from 2 independent cohorts, including 30 matched resected specimens with complete radiological and pathological information, and 128 retrospective pathological pair-samples with partial follow-up data. This integration allowed us to conduct a correlation analysis between clinical phenotype and transcriptome landscape. Immunohistochemistry was performed using tissue microarrays to examine the expression of phospholipid phosphatase 2 (PLPP2) and lipid-raft markers. Lipidomics analysis was used to determine the changes of lipid components in PLPP2-overexpressed cells. To assess the effects of PLPP2 on the malignant phenotypes of LUAD cells, we conducted mice tumor-bearing experiments and in vitro cellular experiments by knocking down PLPP2 and inhibiting lipid raft synthesis with MβCD, respectively.

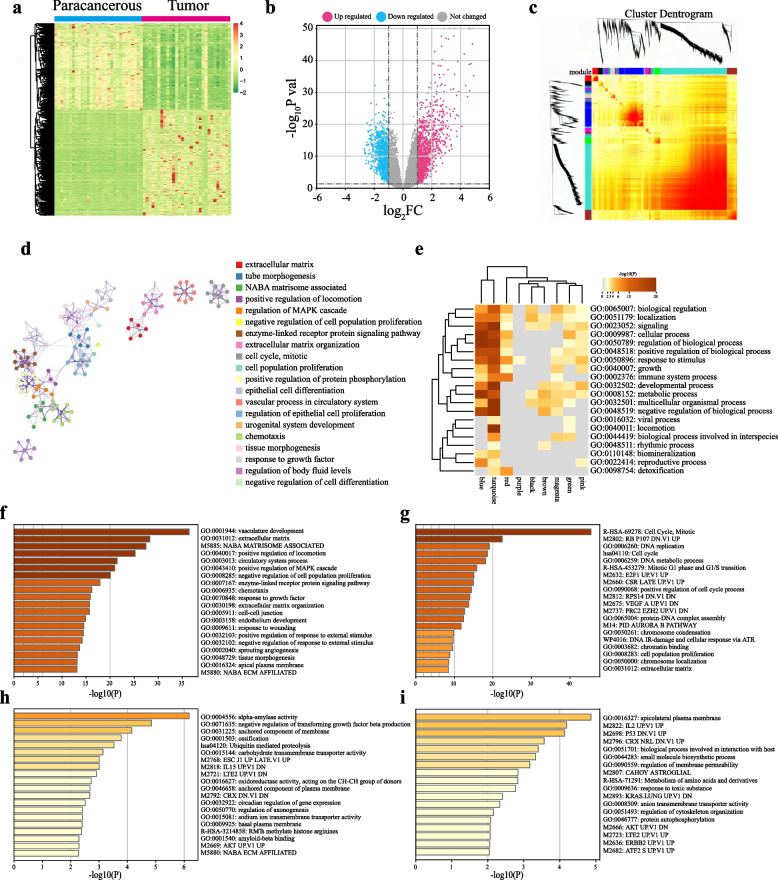
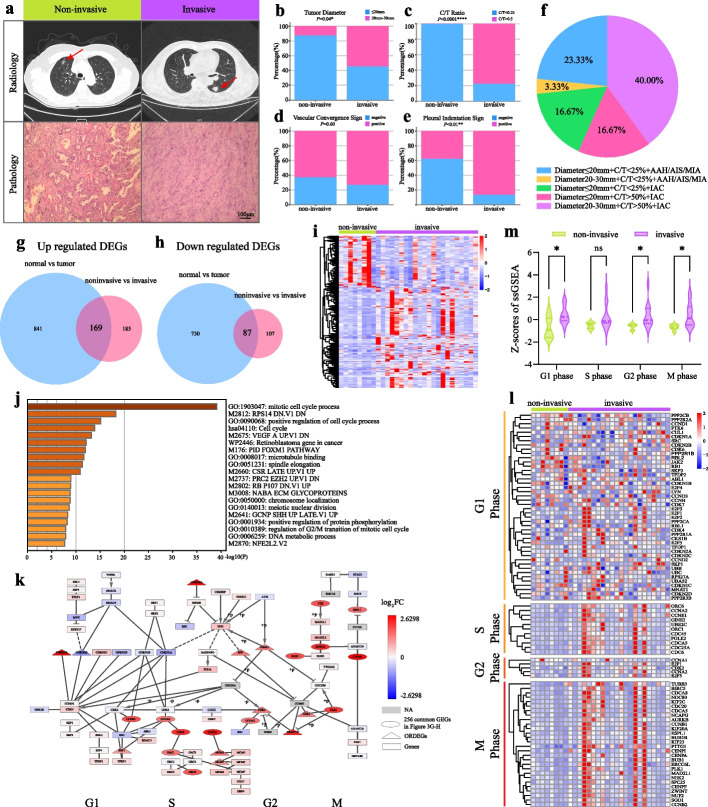
Results: Bioinformatics analysis indicated that the co-occurrence of lipid raft formation and rapid cell proliferation might exhibit synergistic effects in driving oncogenesis from lung preneoplasia to adenocarcinoma. The enhanced activation of the cell cycle promoted the transition from non-invasive to invasive status in early-stage LUAD, which was related to an increase in lipid rafts within LUAD cells. PLPP2 participated in lipid raft formation by altering the component contents of lipid rafts, such as esters, sphingomyelin, and sphingosine. Furthermore, elevated PLPP2 levels were identified as an independent prognostic risk factor for LUAD patients. Further results from in vivo and in vitro experiments confirmed that PLPP2 could induce excessive cell proliferation by enhancing lipid raft formation in LUAD cells.

Conclusions: Our study has revealed the characteristics of gene expression profiles in early-stage LUAD patients with the different radiological and pathological subtypes, as well as deciphered transcriptomic evolution trajectory from preneoplasia to invasive LUAD. Furthermore, it suggests that PLPP2-mediated lipid raft synthesis may be a significant biological event in the initiation of early-stage LUAD, offering a potential target for more precise diagnosis and therapy in clinical settings.

Keywords: Cell proliferation; Early stage lung adenocarcinoma; Lipid rafts; Phospholipid phosphatase 2; Transcriptome sequencing.


Conflict of interest statement

The authors have no conflicts of interests and declare no competing financial interests.

Figures

Fig. 1
Fig. 1
WGCNA and functional annotations for DEGs in different modules. a The heatmap showed the DEGs between 30 paracancerous tissues and 30 tumour tissues. b The volcano plot showed the DEGs between 30 paracancerous tissues and 30 tumour tissues. The red dots represented up-regulated significant DEGs and the blue dots represented sown-regulated significant DEGs. c WGCNA network heatmap showed cluster dendrogram and genetic similarity among different modules. d Functional annotations for 1827 ORDEGs. e Top-level gene ontology biological processes enrichment of turquoise module、blue module、brown module and green module. f Functional annotations for ORDEGs in turquoise module. g Functional annotations for ORDEGs in blue module. h Functional annotations for ORDEGs in brown module. i Functional annotations for ORDEGs in green module
Fig. 2
Fig. 2
Cell-cycle activation was the primary feature of early-stage LUAD onset and progression. a Representative image showed the pathological and radiological features of patients in cohort 1. b-e Statistic analyses of tumour diameters, C/T ratios, vascular convergence sign and pleural indentation sign in patients with non-invasive and invasive nodes. *P < 0.05, **P < 0.01, ****P < 0.0001, the student’s t test. f Pie chart showed the percentage of patients with different pathological and radiological features. g Venn showed 169 common up regulated DEGs between ORDEGs and DEGs in non-invasive versus invasive group. h Venn showed 87 common down regulated DEGs between ORDEGs and DEGs in non-invasive versus invasive group. i The heatmap showed the DEGs between non-invasive and invasive tissues. j Functional annotations for 256 common DEGs in Fig. 3G-H. k Enrichment analysis of cell cycle pathway in KEGG database. l The heatmap showed the marker genes in G1, S, G2, M phase between non-invasive and invasive tissues. m Statistic analysis of ssGSEA z-scores in G1, S, G2, M phase marker genes between non-invasive and invasive tissues. *P < 0.05, ns: no significance, the student’s t test
Fig. 3
Fig. 3
Lipid rafts drove cell-cycle activation and invasiveness in early-stage LUAD. a Representative image of patients with or without vascular convergence sign. b Pie chart showed the percentage of patients with or without vascular convergence sign in invasive group. c Representative PET-CT images of patients in low SUV and high SUV group. d Statistic analysis of patients’ maximum SUV in low SUV and high SUV group. **P < 0.01, the student’s t test. e The heatmap showed the DEGs between low SUV tissues and high SUV tissues. f Functional annotations for 475 DEGs between low SUV tissues and high SUV tissues. g Protein–protein interaction network among 10 densely connected components calculated by MCODE algorithm. h Representative images of IHC assay detecting levels of caveolin-1 expression in paracancerous and tumour tissues of LUAD patients in cohort 2. i Statistic analysis of caveolin-1 AOD values in paired paracancerous and tumour tissues of stage I LUAD patients in cohort 2, n = 38. Bars, SD; ****P < 0.0001; the student’s t test. j Statistic analysis of caveolin-1 AOD values in paired paracancerous and tumour tissues of stage I A2 patients in cohort 2, n = 9. Bars, SD; **P < 0.01, the student’s t test. k Statistic analysis of caveolin-1 AOD values in paired paracancerous and tumour tissues of stage I A3 patients in cohort 2, n = 14. Bars, SD; ****P < 0.0001, the student’s t test. l Statistic analysis of caveolin-1 AOD values in paired paracancerous and tumour tissues of stage I B patients in cohort 2, n = 15. Bars, SD; ***P < 0.001, the student’s t test. m Correlation analysis of caveolin-1 AOD fold changes and Ki-67 positive percentages in paracancerous and tumour tissues of stage I LUAD patients, n = 38. **P < 0.01; spearman correlation test
Fig. 4
Fig. 4
Transcriptomics and lipidomics analyses implicated PLPP2 in lipid raft formation during early-stage LUAD. a Venn showed common gene PLPP2 among 4 gene sets. Set 1: lipid raft gene set from molecular signatures database (MSigDB); set 2: glycerophospholipid metabolism gene set from MSigDB; set 3: ORDEGs; set 4: DEGs of paracancerous and tumour tissues of stage I LUAD patients in TCGA database. b Correlation analysis of PLPP2 and flotillin-1 levels in tumour tissues of patients in cohort 1, n = 30. **P < 0.01; spearman correlation test. c-d GSEA of PLPP2 levels in 30 tumour tissues of patients in cohort 1. e The heatmap showed differential metabolites between NCI-H1299 vector cells and PLPP2 OE cells. f KEGG annotation of differential metabolites between NCI-H1299 vector cells and PLPP2 OE cells. g Scatter plot showed the content differences of different subclasses of lipids in two groups of samples. Each point in the figure represented a type of lipid, and different colors represented different lipid subclasses. h Radar charts showed the levels of indicated lipids in NCI-H1299 vector cells and PLPP2 OE cells. *P < 0.05, **P < 0.01, ****P < 0.0001; the student’s t test
Fig. 5
Fig. 5
The elevated PLPP2 in LUAD served as an independent prognostic risk factor for LUAD. a PLPP2 mRNA levels in paired paracancerous and tumour tissues of patients in cohort 1 were tested by Q-PCR, n = 30. ****P < 0.0001; the student’s t test. b PLPP2 mRNA levels in BEAS-2B cells and LUAD cells were tested by Q-PCR, n = 3. Bars, SD; *P < 0.05, **P < 0.01, ***P < 0.001, ****P < 0.0001; the student’s t test. c The level of PLPP2 expressions in BEAS-2B cells and LUAD cells were tested by western blot, representative pictures were shown, n = 3. Bars, SD; ***P < 0.001, ****P < 0.0001; the student’s t test. d Representative images of IHC assay detecting levels of PLPP2 expression in paracancerous and tumour tissues of LUAD patients in cohort 2. e–f Statistic analysis of PLPP2 AOD values in paired paracancerous and tumour tissues of stage I LUAD patients in cohort 2, n = 42. Bars, SD; ****P < 0.0001; the student’s t test. g ROC analysis was used to evaluate the diagnostic accuracy of PLPP2 and calculate AUC value of stage I LUAD patients, n = 42. ****P < 0.0001. h 5-year survival probabilities of stage I LUAD patients in high and low PLPP2 groups were evaluated and showed by Kaplan–Meier curves, n = 42. *P < 0.05; Log-rank test. i Multivariate Cox hazard regression analysis of different clinical characters including age, gender and PLPP2 levels, n = 42
Fig. 6
Fig. 6
Effects of PLPP2 on the content of lipid rafts and cell proliferation. a A549 and NCI-H1299 cells were fixed after transfected with target siRNAs and IF was performed with antibodies recognizing flotillin-1 (red) and caveolin-1 (green). b-c Statistic analyses of flotillin-1 and caveolin-1 AOD values in A549 and NCI-H1299 cells after transfected with target siRNAs, n = 3. Bars, SD; **P < 0.01, ***P < 0.001, ****P < 0.0001; one way ANOVA. d-e Effects of PLPP2 knockdown on cell proliferation by CCK-8 in A549 and NCI-H1299 cells, n = 3. Bars, SD; *P < 0.05, ***P < 0.001, ****P < 0.0001; one way ANOVA. f-g Effects of PLPP2 knockdown on cell proliferation by colony formation assays in A549 and NCI-H1299 cells, n = 3. Bars, SD; ****P < 0.0001; one way ANOVA. h BEAS-2B and MLE-12 cells were fixed after transfected with target lentivirus particles and IF was performed with antibodies recognizing flotillin-1 (red) and caveolin-1 (green). i-j Statistic analyses of flotillin-1 and caveolin-1 AOD values in BEAS-2B and MLE-12 cells after transfected with target lentivirus particles, n = 3. Bars, SD; ns: no significance, **P < 0.01, ****P < 0.0001; one way ANOVA. k-l Effects of PLPP2 OE on cell proliferation by CCK-8 in BEAS-2B and MLE-12 cells, n = 3. Bars, SD; *P < 0.05, **P < 0.01; one way ANOVA
Fig. 7
Fig. 7
Inhibiting lipid raft synthesis in LUAD cells impeded the tumour-promoting effects of PLPP2. a-b Effects of PLPP2 OE on cell proliferation by CCK-8 in A549 and NCI-H1299 cells, n = 3. Bars, SD; *P < 0.05, **P < 0.01; two way ANOVA. c-d Effects of PLPP2 OE on cell proliferation by colony formation assays in A549 and NCI-H1299 cells, n = 3. Bars, SD; **P < 0.01, ***P < 0.001, ****P < 0.0001; two way ANOVA. e LLC cells were fixed after infected with target lentivirus particles and IF was performed with antibodies recognizing flotillin-1 (red) and caveolin-1 (green). f Statistic analyses of flotillin-1 and caveolin-1 AOD values in LLC cells after infected with target lentivirus particles, n = 3. Bars, SD; ***P < 0.001; the student’s t test. g Subcutaneous tumour images of LLC-vector group, LLC-PLPP2 OE group, LLC-vector plus MβCD treatment group and LLC-PLPP2 OE plus MβCD treatment group in C57BL/6 mice. h Tumour growth curves derived from target groups were shown, n = 6. Bars, SD; ***P < 0.001, ****P < 0.0001; two way ANOVA

Similar articles

Cited by

References

    1. Wang L, Zhang M, Pan X, Zhao M, Huang L, Hu X, et al. Integrative serum metabolic fingerprints based multi-modal platforms for lung adenocarcinoma early detection and pulmonary nodule classification. Adv Sci (Weinh) 2022;9(34):e2203786. doi: 10.1002/advs.202203786. - DOI - PMC - PubMed
    1. Su H, Dai C, Xie H, Ren Y, She Y, Kadeer X, et al. Risk factors of recurrence in patients with clinical stage IA adenocarcinoma presented as ground-glass nodule. Clin Lung Cancer. 2018;19(5):e609–e617. doi: 10.1016/j.cllc.2018.04.020. - DOI - PubMed
    1. Tsutani Y, Miyata Y, Nakayama H, Okumura S, Adachi S, Yoshimura M, et al. Oncologic outcomes of segmentectomy compared with lobectomy for clinical stage IA lung adenocarcinoma: propensity score-matched analysis in a multicenter study. J Thorac Cardiovasc Surg. 2013;146(2):358–364. doi: 10.1016/j.jtcvs.2013.02.008. - DOI - PubMed
    1. Chen J, Yang H, Teo ASM, Amer LB, Sherbaf FG, Tan CQ, et al. Genomic landscape of lung adenocarcinoma in East Asians. Nat Genet. 2020;52(2):177–186. doi: 10.1038/s41588-019-0569-6. - DOI - PubMed
    1. Zhang C, Zhang Z, Zhang G, Zhang Z, Luo Y, Wang F, et al. Clinical significance and inflammatory landscapes of a novel recurrence-associated immune signature in early-stage lung adenocarcinoma. Cancer Lett. 2020;479:31–41. doi: 10.1016/j.canlet.2020.03.016. - DOI - PubMed

Substances