. 2023 Nov 23;24(1):266.
doi: 10.1186/s13059-023-03103-8.

CREaTor: zero-shot cis-regulatory pattern modeling with attention mechanisms

Affiliations

CREaTor: zero-shot cis-regulatory pattern modeling with attention mechanisms

Yongge Li et al. Genome Biol. .

Abstract

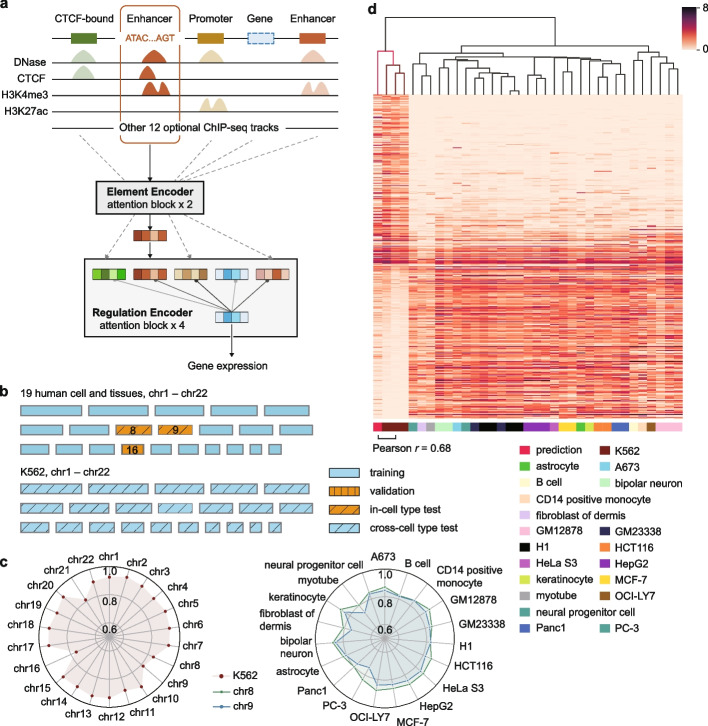
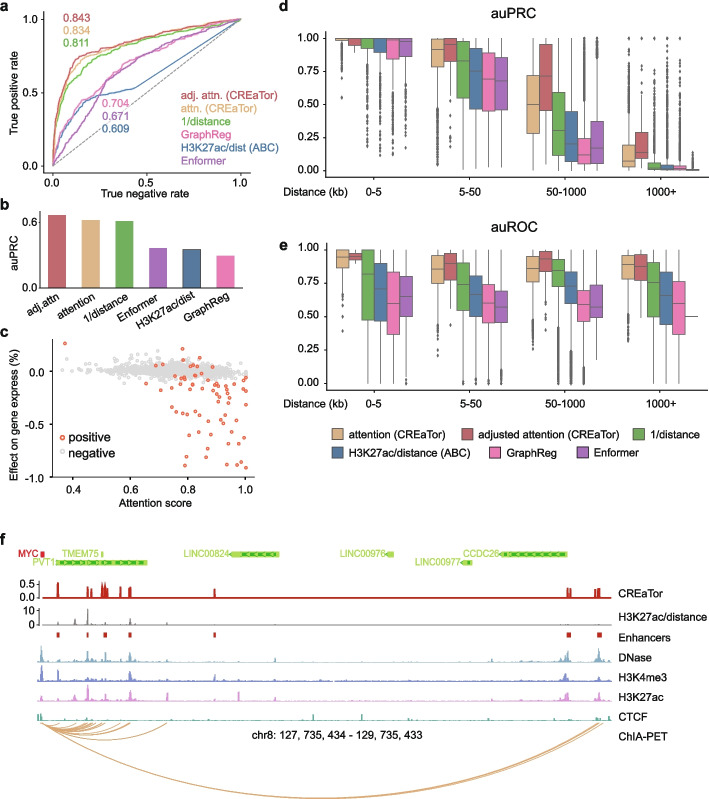
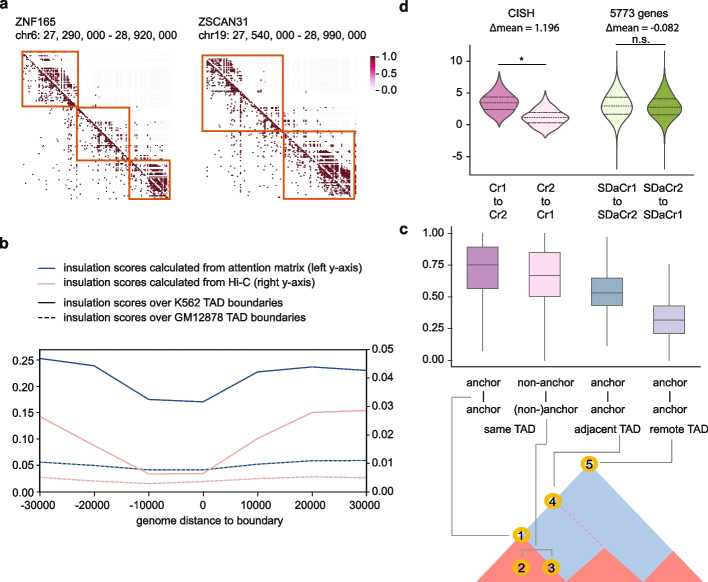
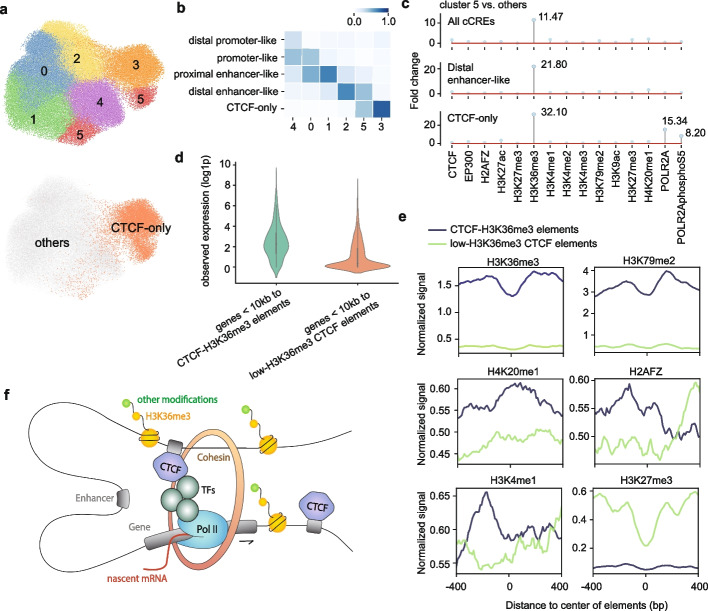
Linking cis-regulatory sequences to target genes has been a long-standing challenge. In this study, we introduce CREaTor, an attention-based deep neural network designed to model cis-regulatory patterns for genomic elements up to 2 Mb from target genes. Coupled with a training strategy that predicts gene expression from flanking candidate cis-regulatory elements (cCREs), CREaTor can model cell type-specific cis-regulatory patterns in new cell types without prior knowledge of cCRE-gene interactions or additional training. The zero-shot modeling capability, combined with the use of only RNA-seq and ChIP-seq data, allows for the ready generalization of CREaTor to a broad range of cell types.

Keywords: Cis-regulatory pattern; Enhancer-gene interaction; Epigenetics; Gene expression; Gene regulation.


Conflict of interest statement

P.D., F.J., H.X., L.H., L.W., J.Z., and B.S. are paid employees of Microsoft Research. Y.L., Z.C., and Y.Q. declare no competing interests.

Figures

Fig. 1
Fig. 1
Accurate gene expression prediction with CREaTor. a Schema of CREaTor. The model predicts target gene expression from the flanking cCREs with a hierarchical transformer structure. Localization of cCREs was obtained from ENCODE consortium. A combination of genomic sequences, chromatin accessibility, and a collection (3–13 types) of ChIP-seq profiles was used as input features for each cCRE. b Visualization of data split strategy: we trained our model on gene expression of 19 autosomes from 19 different cell lines and tissues respectively. Genes on chr16 from the 19 cell lines and tissues were used for parameter tuning (validation), while genes on chr8, 9 were used for model evaluation (in-cell type test chromosomes). Genes from all autosomes in K562 (cross-cell type test chromosomes) were detailly evaluated to demonstrate the model’s ability on cross-cell type gene expression and regulation modeling (Additional file 1: Fig. S2). c Pearson r between observed and predicted expression of genes. Left: Pearson r between observed and predicted expressions of genes on cross-cell type test chromosomes. Right: Pearson r between observed and predicted expressions of genes on in-cell type test chromosomes. Green and blue dots indicate chr8 and 9 respectively. See Additional file 2: Table S3 for results with different random seeds. d Clustering map of predicted and observed expression of K562 specific genes (calculated with RSME; see the “Methods” section) in different cell types. The leftmost column is the predicted value, which is clustered with the K562 observed gene expression data using the hierarchical clustering method. Expression values were transformed with log1p. Observed gene expression profiles from different sources (with different experiment IDs on ENCODE) for the same cell type are calculated independently
Fig. 2
Fig. 2
Attention matrix of CREaTor implies cCRE-gene interactions. a, b auROC (a) and auPRC (b) of CREaTor outperform its counterparts on cCRE-gene pair classification. Attention (attn., yellow): normalized attention weights (genes to cCREs) in CREaTor. Adjusted attention (adj. attn., red): attention scores/log10 (distance). H3K27ac/dist (blue): approximate of the ABC score. Distance quantifies relative genomic distances between genes and cCREs. H3K27ac value of a cCRE is calculated as the sum of H3K27ac peak values of the element. Labels (positive/negative) of cCRE-gene pairs were collected from 3 independent CRISPR perturbation experiments [–15]. c Attention scores derived from attention weights are significantly correlated with the effect of enhancer on gene expression quantified by Fulco et al. [13]. As the quantification measures the change of target gene expression upon enhancer knock-down using CRISPR perturbation, the quantitative effect values are inversely related to enhancer activities. d, e auPRC (d) and auROC (e) of CREaTor and its counterparts on the classification of cCRE-gene pairs collected from a Pol-II mediated ChIA-PET experiment. The performance is evaluated for each gene and each distance group separately. Groups with < 10 samples were filtered out. Center line, median; box limits, upper and lower quartiles; whiskers, 1.5 × interquartile range; points, outliers. f MYC locus showing predicted and previously reported regulators in K562 cells. For CREaTor (red) and H3K27ac/distance (gray), peaks on the tracks represent the scores of different cCRE regions. Enhancers track (red squares) denotes reported active regulators of MYC. Representative DNase, H3K4me3, H3K27ac, and CTCF tracks, as well as ChIA-PET interactions in K562, are also annotated
Fig. 3
Fig. 3
CREaTor captures hierarchically higher-order genome organizations. a Example genomic regions showing the similarity between attention matrix (above the diagonal) and Hi-C contact matrix (below the diagonal). Orange boxes indicate TAD domains. b Average insulation scores across the K562 genome at 10-kb resolution calculated from attention matrix and Hi-C. Blue line and left y-axis: insulation scores of attention matrix. Pink line and right y-axis: the insulation scores of Hi-C. Solid lines indicate insulation scores over K562 TAD boundaries and dashed lines indicate insulation scores over GM12878 boundaries. The x-axis is centered on TAD boundaries. c Upper panel: Statistics of attention weights between CTCF-bound element pairs with different topological relationships. Center line, median; box limits, upper and lower quartiles; whiskers, 1.5 × interquartile range. Lower panel: illustration of CTCF-bound element pairs used for the analysis. The red triangle represents TAD domains called from the Hi-C matrix (blue). d Average attention scores between elements without normalization. p-value is calculated with Mann–Whitney U test
Fig. 4
Fig. 4
cCRE representations learned by CREaTor suggest a new role of CTCF-bound elements. a Uniform Manifold Approximation and Projection (UMAP) of cCRE embeddings in K562. Upper: colored and numbered as clusters grouped by the Leiden algorithm. Bottom: colored and labeled by element type. b Composition of different element types in each cluster by percentage. Proximal elements: elements falling within 200 bp of an annotated TSS. Distal elements: elements more than 200 bp from any annotated TSS. Promoter-like: elements with high DNase and H3K4me3 signals. Enhancer-like: elements with high DNase and H3K27ac signals. CTCF-only: elements with high DNase and CTCF signals, as well as low H3K4me3 and H3K27ac signals. c Fold change of histone marker peaks of given types of cCREs in cluster 5 with respect to those in other clusters. Top: all cCREs. Middle: distal enhancer-like elements. Bottom: CTCF-only elements. d Expression value (log1p) distribution of genes within 10 kb of different types of CTCF-bound elements. e Average signals of H3K36me3, H3K79me2, H4K20me1, H2AFZ, H3K4me1, and H3K27me3 on different types of CTCF-bound elements. f Illustration for the proposed model of CTCF-H3K36me3 elements promoting transcription elongation
Fig. 5
Fig. 5
Feature ablation study demonstrates the importance of feature integration for modeling. a auROC and auPRC of 4 different models on cCRE-gene pair classification. Large (red): the model trained with 17 types of features. Medium (yellow): the model trained with 8 types of features (genomic sequence, DNase, CTCF, H3K27ac, H3K4me3, H3K9ac, EP300, and POLR2AphosphoS5). Small (blue): the model trained with 5 types of features (genomic sequence, DNase, CTCF, H3K27ac, and H3K4me3). b Large model trained with 17 types of features outperforms other models on cCRE-gene interaction classification tasks. Minus signs indicate the following type of feature is removed during model training. Labels (positive/negative) of cCRE-gene pairs were from the same source as Fig. 2. The colors of dots indicate the Pearson r between observed and predicted expression of K562-specific genes

Similar articles

Cited by

References

    1. Furlong EEM, Levine M. Developmental enhancers and chromosome topology. Science. 2018;361(6409):1341–1345. doi: 10.1126/science.aau0320. - DOI - PMC - PubMed
    1. Long HK, Prescott SL, Wysocka J. Ever-changing landscapes: transcriptional enhancers in development and evolution. Cell. 2016;167(5):1170–1187. doi: 10.1016/j.cell.2016.09.018. - DOI - PMC - PubMed
    1. Plank JL, Dean A. Enhancer function: mechanistic and genome-wide insights come together. Mol Cell. 2014;55(1):5–14. doi: 10.1016/j.molcel.2014.06.015. - DOI - PMC - PubMed
    1. Sakabe NJ, Savic D, Nobrega MA. Transcriptional enhancers in development and disease. Genome Biol. 2012;13(1):238. doi: 10.1186/gb-2012-13-1-238. - DOI - PMC - PubMed
    1. Claringbould A, Zaugg JB. Enhancers in disease: molecular basis and emerging treatment strategies. Trends Mol Med. 2021;27(11):1060–1073. doi: 10.1016/j.molmed.2021.07.012. - DOI - PubMed

MeSH terms

LinkOut - more resources