

Eating patterns in Korean adults, 1998-2018: increased energy contribution of ultra-processed foods in main meals and snacks
- PMID: 37999737
- PMCID: PMC10799128
- DOI: 10.1007/s00394-023-03258-x
Eating patterns in Korean adults, 1998-2018: increased energy contribution of ultra-processed foods in main meals and snacks
Abstract
Purpose: Unfavorable changes in eating patterns over time may contribute to upward trends in chronic diseases, such as obesity. We examined 20-year trends in the percentage of energy from main meals and snacks and the food sources of each eating occasion among Korean adults.
Methods: This study used nationally representative data from the 1st, 4th, and 7th Korea National Health and Nutrition Examination Surveys (1998, 2007-2009, and 2016-2018) among adults aged 20-69 years (n = 29,389). Each eating occasion (breakfast, lunch, dinner, and snacks) was defined by respondents during a 24-h dietary recall interview. To identify the food sources of each eating occasion, we used the NOVA system. The percentage of energy at each eating occasion and that from each NOVA group across survey cycles were estimated, and tests for linear trends were conducted using orthogonal polynomial contrasts in linear regression models. All analyses accounted for the complex survey design.
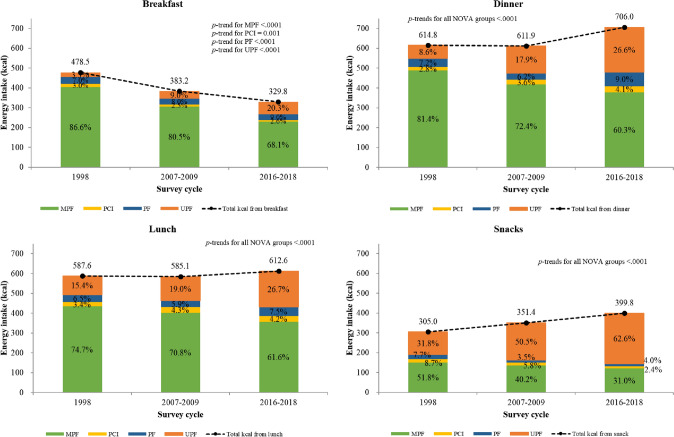
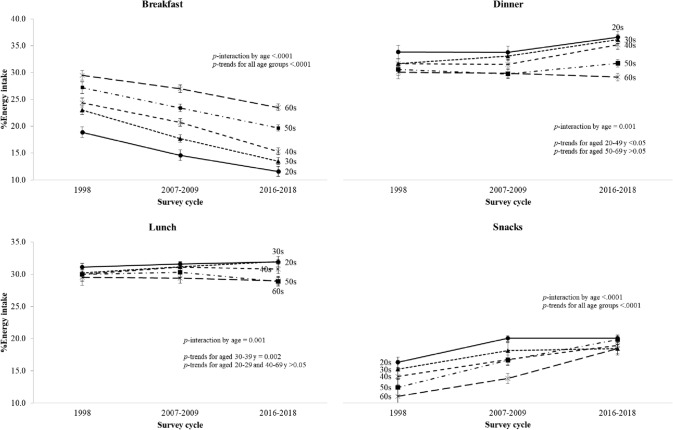
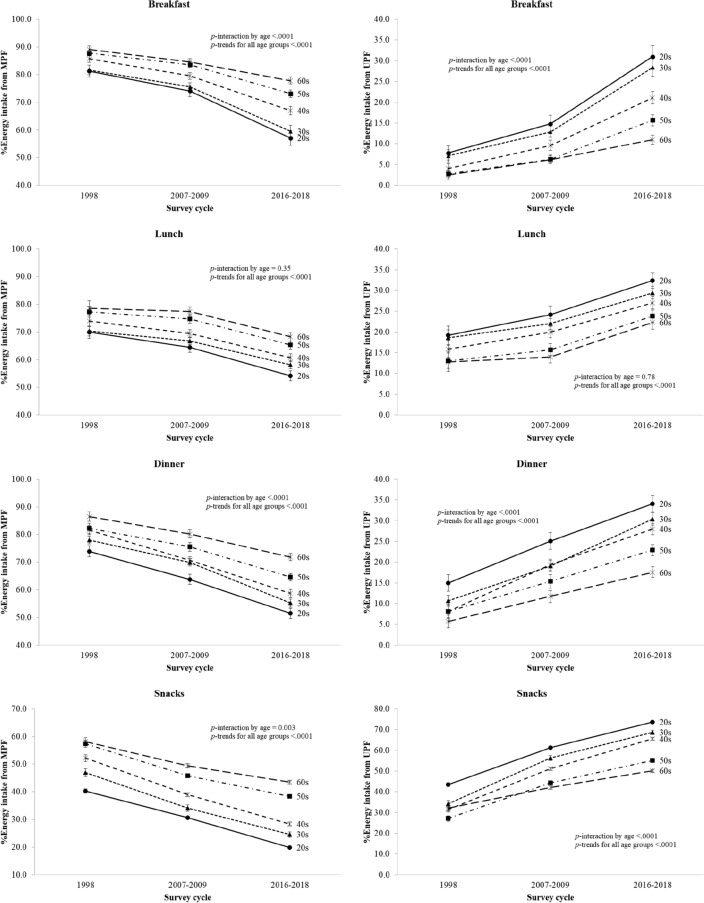
Results: After adjusting for age and sex, the percentage of energy from breakfast decreased from 25.0% in 1998 to 16.7% in 2018 (difference, - 8.2%; standard error [SE], 0.3), whereas that from dinner and snacks increased from 31.1 to 33.8% (difference, + 2.7%; SE, 0.4) and from 14.0 to 19.0% (difference, + 5.0%; SE, 0.5), respectively (all P < 0.001). At all eating occasions, the percentage of energy from minimally processed foods declined (difference, - 18.6% for breakfast; - 13.1% for lunch; - 21.1% for dinner; - 20.7% for snacks), while that from ultra-processed foods increased (difference, + 17.0% for breakfast; + 11.3% for lunch; + 18.0% for dinner; + 30.7% for snacks). When stratified by age, the given trends were shown to a greater extent in younger adults (< 50 years old) than in older adults (≥ 50 years old).
Conclusions: The eating patterns of Korean adults changed from 1998 to 2018, with the greatest decrease in energy intake from breakfast and the greatest increase from snacking. At all eating occasions, the contribution of minimally processed foods declined, while that of ultra-processed foods increased, especially among younger adults.
Keywords: Eating patterns; Energy intake; Korea National Health and Nutrition Examination Survey; Snacking; Trend.
© 2023. The Author(s).
Conflict of interest statement
The authors declare that they have no conflicts of interest.
Figures
References
-
- Kim S, Park GH, Yang JH, Chun SH, Yoon HJ, Park MS. Eating frequency is inversely associated with blood pressure and hypertension in Korean adults: analysis of the Third Korean National Health and Nutrition Examination Survey. Eur J Clin Nutr. 2014;68:481–489. doi: 10.1038/ejcn.2014.9. - DOI - PubMed
MeSH terms
Grants and funding
LinkOut - more resources
Full Text Sources
Medical
