

Cooperative Fe sites on transition metal (oxy)hydroxides drive high oxygen evolution activity in base
- PMID: 38001061
- PMCID: PMC10673886
- DOI: 10.1038/s41467-023-43305-z
Cooperative Fe sites on transition metal (oxy)hydroxides drive high oxygen evolution activity in base
Abstract
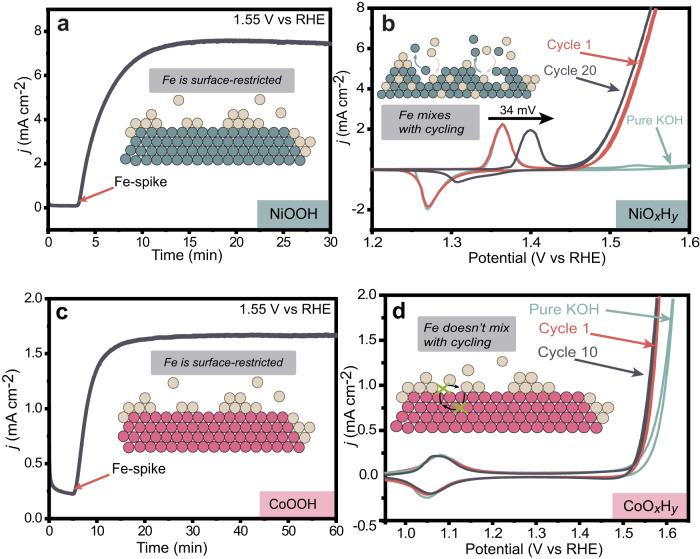
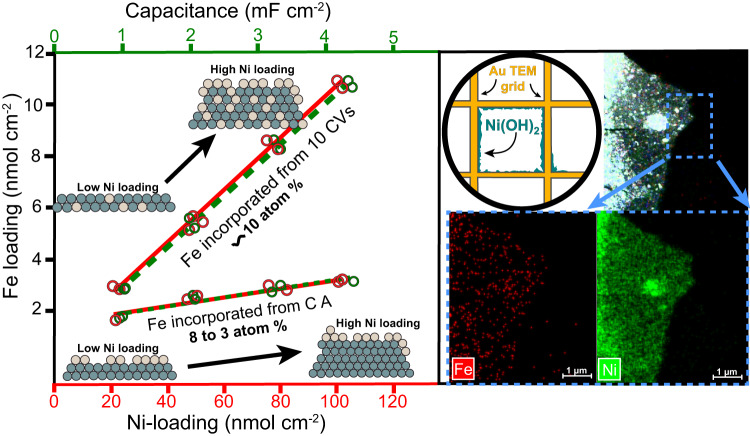
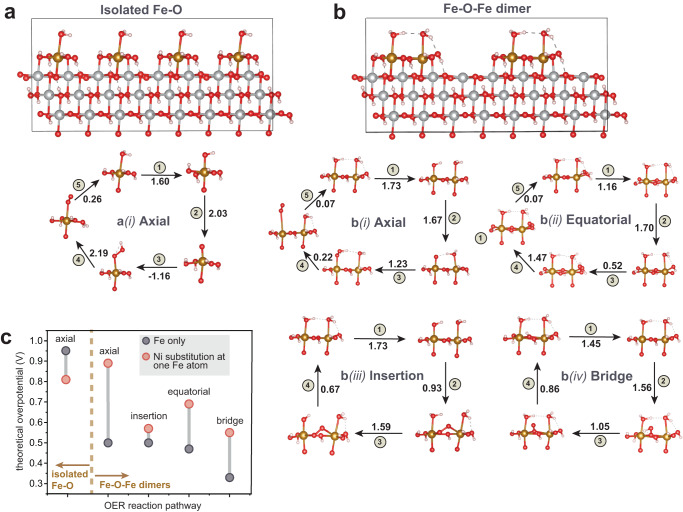
Fe-containing transition-metal (oxy)hydroxides are highly active oxygen-evolution reaction (OER) electrocatalysts in alkaline media and ubiquitously form across many materials systems. The complexity and dynamics of the Fe sites within the (oxy)hydroxide have slowed understanding of how and where the Fe-based active sites form-information critical for designing catalysts and electrolytes with higher activity and stability. We show that where/how Fe species in the electrolyte incorporate into host Ni or Co (oxy)hydroxides depends on the electrochemical history and structural properties of the host material. Substantially less Fe is incorporated from Fe-spiked electrolyte into Ni (oxy)hydroxide at anodic potentials, past the nominally Ni2+/3+ redox wave, compared to during potential cycling. The Fe adsorbed under constant anodic potentials leads to impressively high per-Fe OER turn-over frequency (TOFFe) of ~40 s-1 at 350 mV overpotential which we attribute to under-coordinated "surface" Fe. By systematically controlling the concentration of surface Fe, we find TOFFe increases linearly with the Fe concentration. This suggests a changing OER mechanism with increased Fe concentration, consistent with a mechanism involving cooperative Fe sites in FeOx clusters.
© 2023. The Author(s).
Conflict of interest statement
The authors declare no competing interests.
Figures


Similar articles
-
Modes of Fe Incorporation in Co-Fe (Oxy)hydroxide Oxygen Evolution Electrocatalysts.ChemSusChem. 2019 May 8;12(9):2015-2021. doi: 10.1002/cssc.201801975. Epub 2018 Nov 9. ChemSusChem. 2019. PMID: 30371020
-
Cobalt-iron (oxy)hydroxide oxygen evolution electrocatalysts: the role of structure and composition on activity, stability, and mechanism.J Am Chem Soc. 2015 Mar 18;137(10):3638-48. doi: 10.1021/jacs.5b00281. Epub 2015 Mar 4. J Am Chem Soc. 2015. PMID: 25700234
-
Effects of Metal Electrode Support on the Catalytic Activity of Fe(oxy)hydroxide for the Oxygen Evolution Reaction in Alkaline Media.Chemphyschem. 2019 Nov 19;20(22):3089-3095. doi: 10.1002/cphc.201900511. Epub 2019 Aug 8. Chemphyschem. 2019. PMID: 31287609
-
A Dynamic Active Site for OER Catalysis at Nickel-Vanadium-Phosphide Depends on V Surface Position and Fe in Alkaline.ACS Appl Mater Interfaces. 2025 Mar 26;17(12):17837-17854. doi: 10.1021/acsami.4c13670. Epub 2025 Jan 15. ACS Appl Mater Interfaces. 2025. PMID: 39813364 Review.
-
Engineering Bimetallic NiFe-Based Hydroxides/Selenides Heterostructure Nanosheet Arrays for Highly-Efficient Oxygen Evolution Reaction.Small. 2021 Feb;17(7):e2007334. doi: 10.1002/smll.202007334. Epub 2021 Jan 27. Small. 2021. PMID: 33501753 Review.
Cited by
-
The role of Fe incorporation into Ni-MOF-74 derived oxygen evolution electrocatalysts for anion exchange membrane water electrolysis.EES Catal. 2025 Feb 4;3(3):505-514. doi: 10.1039/d4ey00250d. eCollection 2025 May 8. EES Catal. 2025. PMID: 39917439 Free PMC article.
-
Transition-Metal-Doped Nickel-Cobalt Layered Double Hydroxide Catalysts for an Efficient Oxygen Evolution Reaction.Materials (Basel). 2025 Feb 17;18(4):877. doi: 10.3390/ma18040877. Materials (Basel). 2025. PMID: 40004400 Free PMC article.
-
Interfacial solvation pre-organizes the transition state of the oxygen evolution reaction.Nat Chem. 2025 Sep 3. doi: 10.1038/s41557-025-01932-7. Online ahead of print. Nat Chem. 2025. PMID: 40903497
-
Fabrication of Surfactant-Free Mixed-Metal Nanocatalyst-Carbon Fiber Paper Composites via Pulsed Laser Grafting.J Phys Chem C Nanomater Interfaces. 2025 Apr 24;129(18):8730-8746. doi: 10.1021/acs.jpcc.5c00641. eCollection 2025 May 8. J Phys Chem C Nanomater Interfaces. 2025. PMID: 40365424 Free PMC article.
-
Temperature-Dependent Kinetic Parameters for the Alkaline Oxygen Evolution Reaction on NiFeOOH.ACS Energy Lett. 2025 Jun 3;10(6):3040-3049. doi: 10.1021/acsenergylett.5c01387. eCollection 2025 Jun 13. ACS Energy Lett. 2025. PMID: 40535456 Free PMC article.
References
-
- Grigoriev SA, Fateev VN, Bessarabov DG, Millet P. Current status, research trends, and challenges in water electrolysis science and technology. Int. J. Hydrog. Energy. 2020;45:26036–26058. doi: 10.1016/j.ijhydene.2020.03.109. - DOI
-
- Schalenbach M, Zeradjanin AR, Kasian O, Cherevko S, Mayrhofer KJJ. A perspective on low-temperature water electrolysis—challenges in alkaline and acidic technology. Int. J. Electrochem. Sci. 2018;13:1173–1226. doi: 10.20964/2018.02.26. - DOI
-
- Krivina RA, et al. Oxygen electrocatalysis on mixed-metal oxides/oxyhydroxides: from fundamentals to membrane electrolyzer technology. Acc. Mater. Res. 2021;2:548–558. doi: 10.1021/accountsmr.1c00087. - DOI
-
- Corrigan DA. The catalysis of the oxygen evolution reaction by iron impurities in thin film nickel oxide electrodes. J. Electrochem. Soc. 1987;134:377. doi: 10.1149/1.2100463. - DOI
Grants and funding
LinkOut - more resources
Full Text Sources
Miscellaneous
