. 2023 Nov 24;14(1):7711.
doi: 10.1038/s41467-023-43019-2.

Paired single-cell multi-omics data integration with Mowgli

Affiliations

Paired single-cell multi-omics data integration with Mowgli

Geert-Jan Huizing et al. Nat Commun. .

Abstract

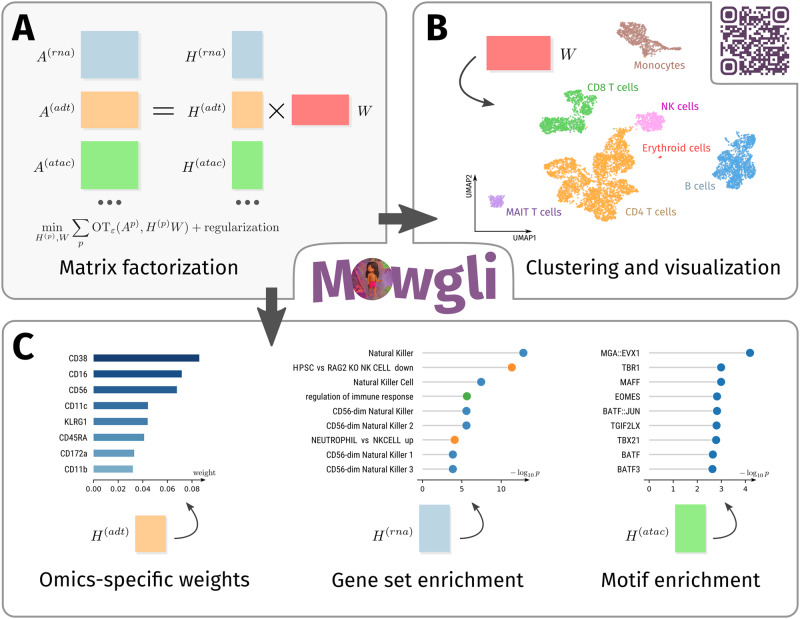
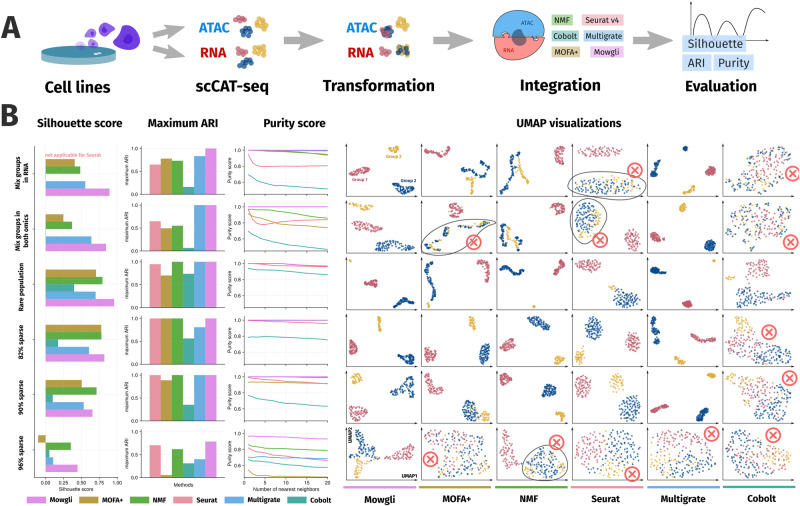
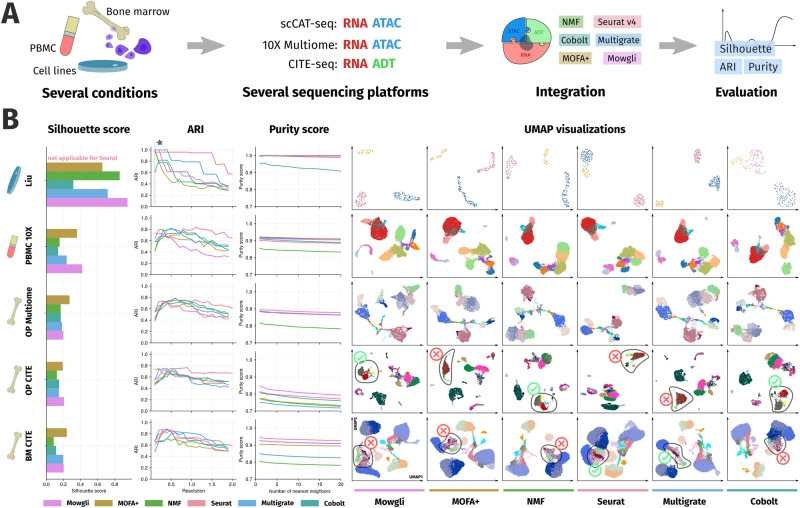
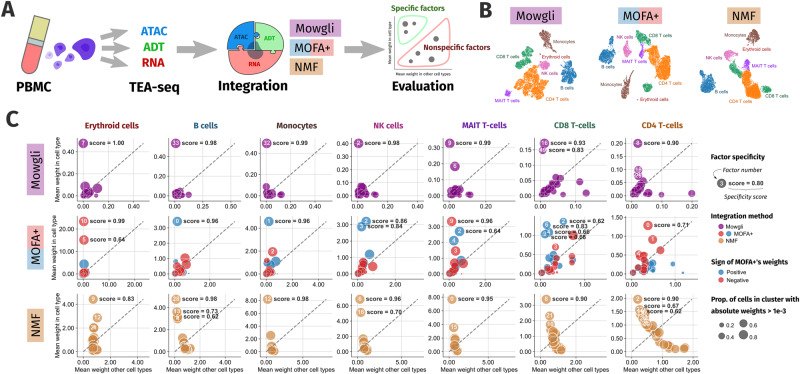
The profiling of multiple molecular layers from the same set of cells has recently become possible. There is thus a growing need for multi-view learning methods able to jointly analyze these data. We here present Multi-Omics Wasserstein inteGrative anaLysIs (Mowgli), a novel method for the integration of paired multi-omics data with any type and number of omics. Of note, Mowgli combines integrative Nonnegative Matrix Factorization and Optimal Transport, enhancing at the same time the clustering performance and interpretability of integrative Nonnegative Matrix Factorization. We apply Mowgli to multiple paired single-cell multi-omics data profiled with 10X Multiome, CITE-seq, and TEA-seq. Our in-depth benchmark demonstrates that Mowgli's performance is competitive with the state-of-the-art in cell clustering and superior to the state-of-the-art once considering biological interpretability. Mowgli is implemented as a Python package seamlessly integrated within the scverse ecosystem and it is available at http://github.com/cantinilab/mowgli .


Conflict of interest statement

The authors declare no competing interests.

Figures

Fig. 1
Fig. 1. Overview of Mowgli.
A Schematic visualization of Mowgli, an NMF-based model with an Optimal Transport loss; B the matrix W of Mowgli can be used for cell clustering and visualization; C The dictionaries Hp of Mowgli contain omics-specific weights for each latent dimension, which can be used for the biological characterization of the latent dimensions through gene set enrichment or motif enrichment analysis.
Fig. 2
Fig. 2. Cell embedding and clustering benchmark in controlled settings derived from cell lines data.
A Schematic representation of the benchmarking process; B The first three columns of this panel are devoted to silhouette scores, Adjusted Rand Indices (ARIs), and purity scores for the different methods on six controlled settings derived from cell lines data. The following six columns provide UMAP visualizations for the six benchmarked methods (Mowgli, MOFA+, NMF, Seurat v4, Multigrate, Cobolt) on six controlled settings derived from cell lines data. Different colors in these UMAP plots correspond to the three groups of cells imposed in the dataset.
Fig. 3
Fig. 3. Cell embedding and clustering benchmark in complex and heterogeneous datasets.
A Schematic representation of the benchmarking process; B The first three columns of this panel are devoted to silhouette scores, Adjusted Rand Indices (ARIs), and purity scores for the different methods on five complex paired single-cell multi-omics data already largely used to benchmark integrative methods. The following six columns provide UMAP visualizations for the six benchmarked methods (Mowgli, MOFA+, NMF, Seurat v4, Multigrate, Cobolt) on the same data. Different colors in these UMAP plots correspond to the different ground truth cell type annotations provided with the data.
Fig. 4
Fig. 4. Evaluation of biological interpretability in TEA-seq data.
A Schematic representation of the evaluation process on biological interpretability; B UMAP visualization of Mowgli’s, MOFA + ’s, and integrative NMF’s embeddings. The colors correspond to a marker-based cell-type annotation of the cells; C average weights within and outside of a cell type are plotted for each factor of Mowgli (violet), MOFA+ (red for the negative part and blue for the positive one), and integrative NMF (orange). For each cell type, the best specificity scores are reported in bold.
Fig. 5
Fig. 5. Characterization of the immune cell subpopulations identified by Mowgli in TEA-seq data.
A UMAP visualization of Mowgli’s embedding with focus on four specific immune subpopulations (Effector Memory CD8 T-cells, memory B cells, CD56dim NK cells, naive B cells) for which the UMAP is colored based on factor weights; B UMAP visualization of Mowgli’s embedding colored by factor weight and protein marker weight for other factors corresponding to specific subpopulations of cells; C Top genes, proteins, gene sets and Transcription Factors (TFs) for the 4 factors visualized in panel a. Stars denote gene sets and markers pertinent for the immune subpopulation associated with the factor and TFs targeting the top genes.

References

    1. Rajewsky N, et al. LifeTime and improving European healthcare through cell-based interceptive medicine. Nature. 2020;587:377–386. doi: 10.1038/s41586-020-2715-9. - DOI - PMC - PubMed
    1. Potter SS. Single-cell RNA sequencing for the study of development, physiology and disease. Nat. Rev. Nephrol. 2018;14:479–492. doi: 10.1038/s41581-018-0021-7. - DOI - PMC - PubMed
    1. Papalexi E, Satija R. Single-cell RNA sequencing to explore immune cell heterogeneity. Nat. Rev. Immunol. 2018;18:35–45. doi: 10.1038/nri.2017.76. - DOI - PubMed
    1. Lee J, Hyeon DY, Hwang D. Single-cell multiomics: technologies and data analysis methods. Exp. Mol. Med. 2020;52:1428–1442. doi: 10.1038/s12276-020-0420-2. - DOI - PMC - PubMed
    1. Stoeckius M, et al. Simultaneous epitope and transcriptome measurement in single cells. Nat. Methods. 2017;14:865–868. doi: 10.1038/nmeth.4380. - DOI - PMC - PubMed

Publication types

Associated data