. 2023 Nov 25;14(1):7726.
doi: 10.1038/s41467-023-43376-y.

Cytolytic circumsporozoite-specific memory CD4+ T cell clones are expanded during Plasmodium falciparum infection

Affiliations

Cytolytic circumsporozoite-specific memory CD4+ T cell clones are expanded during Plasmodium falciparum infection

Raquel Furtado et al. Nat Commun. .

Abstract

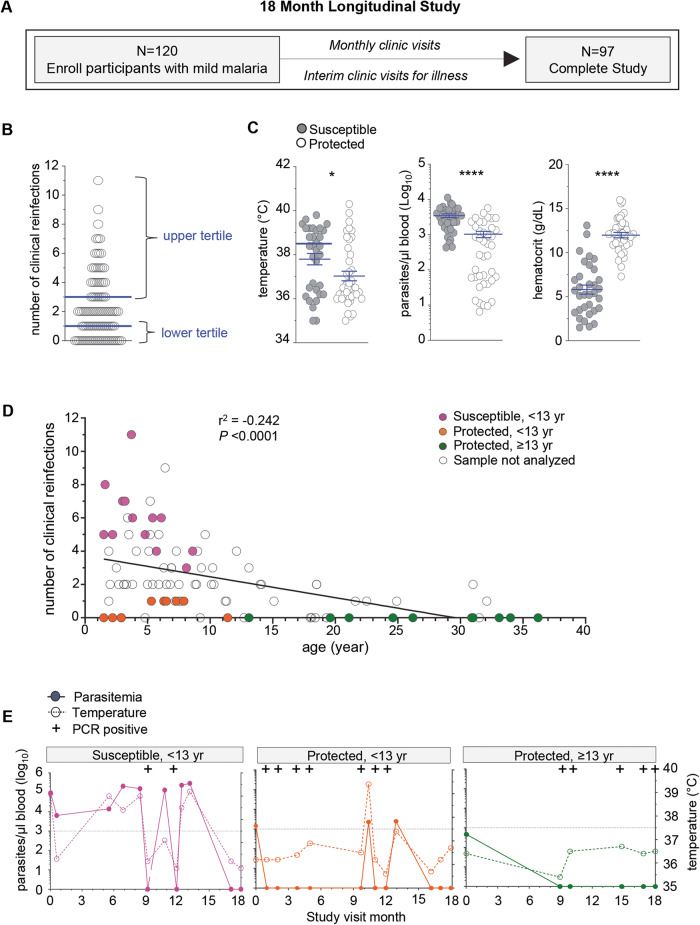
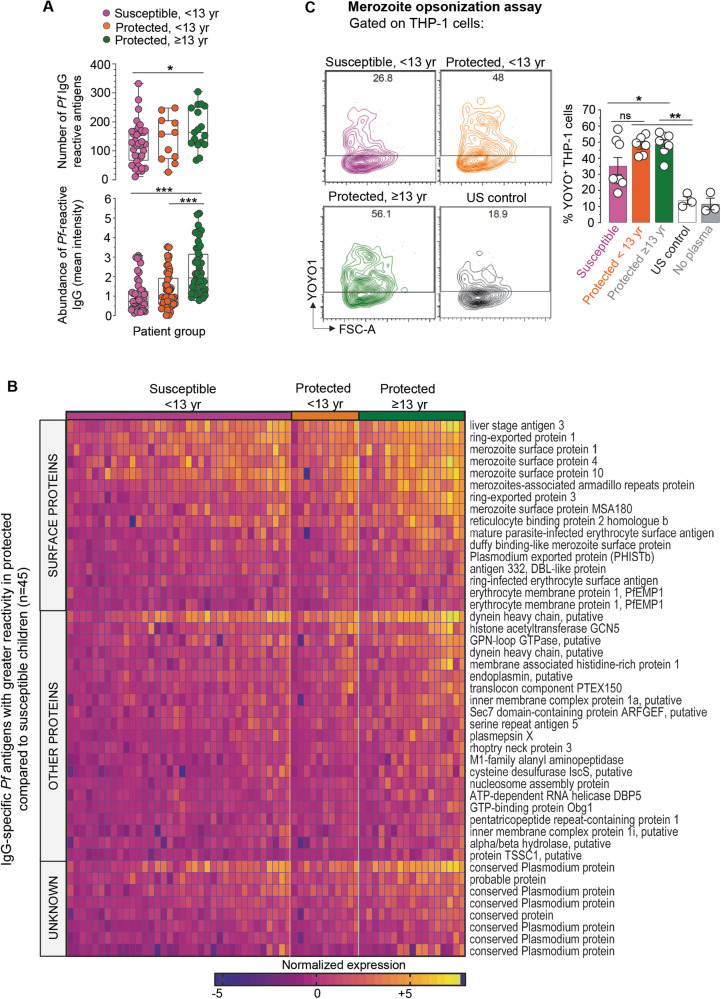
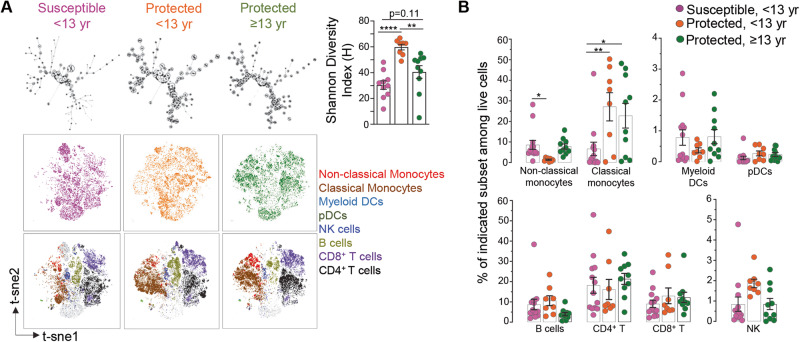
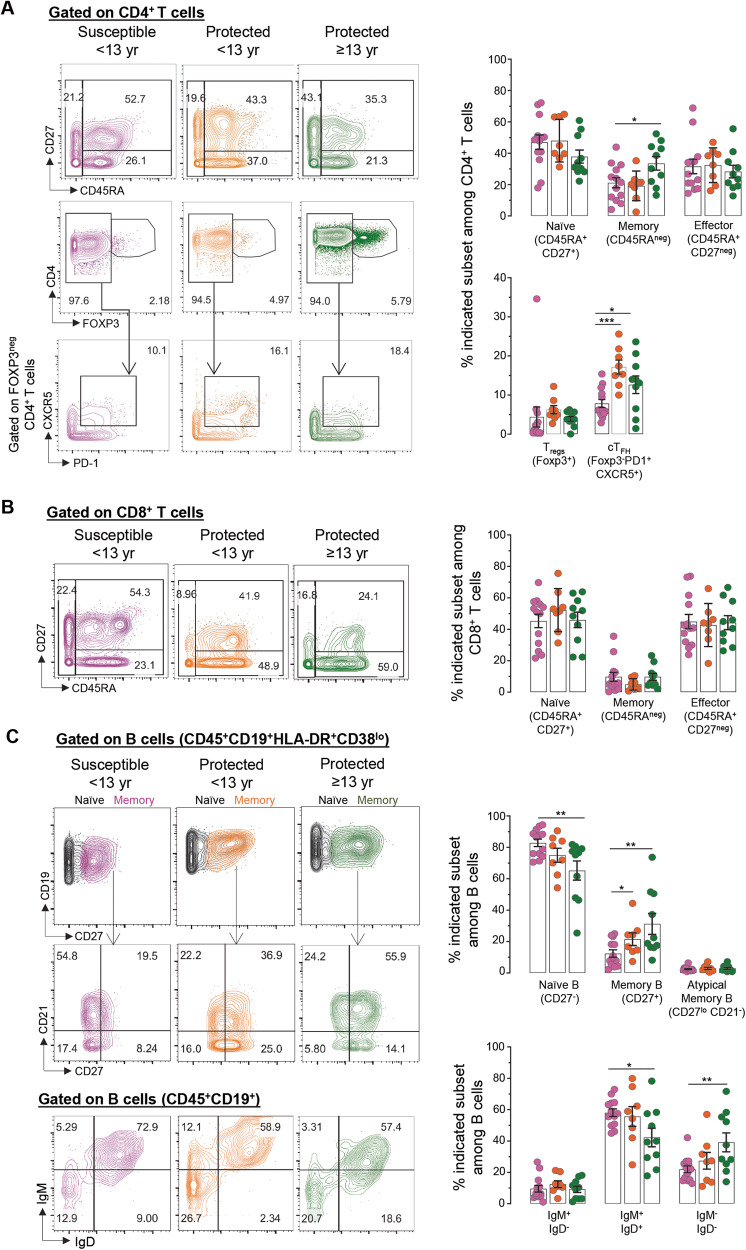
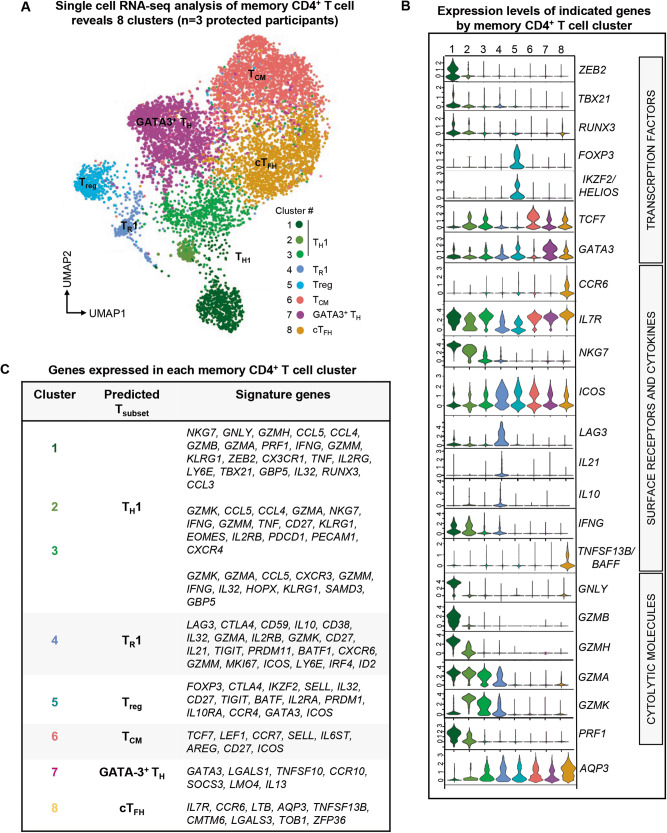
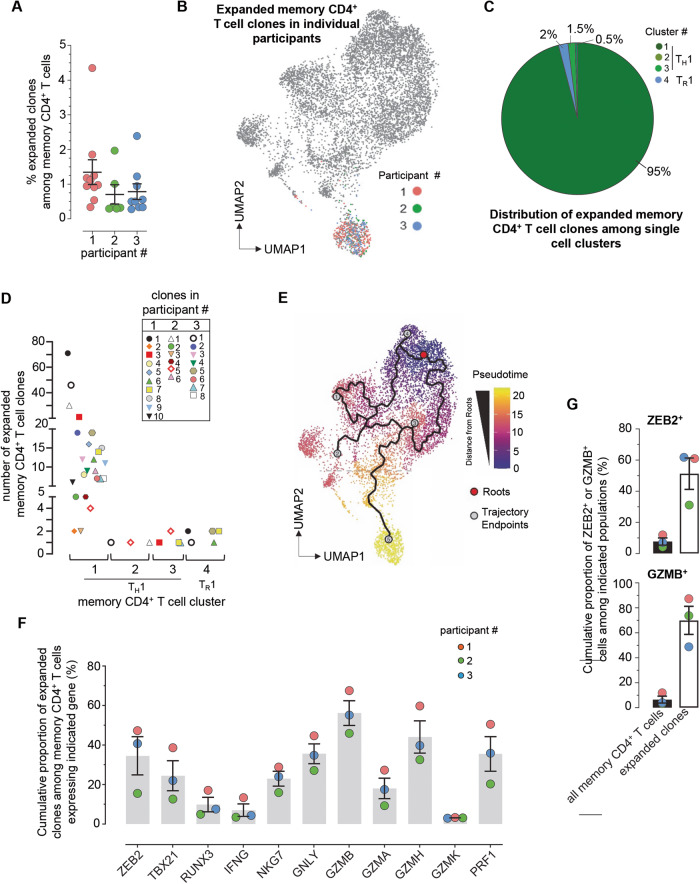
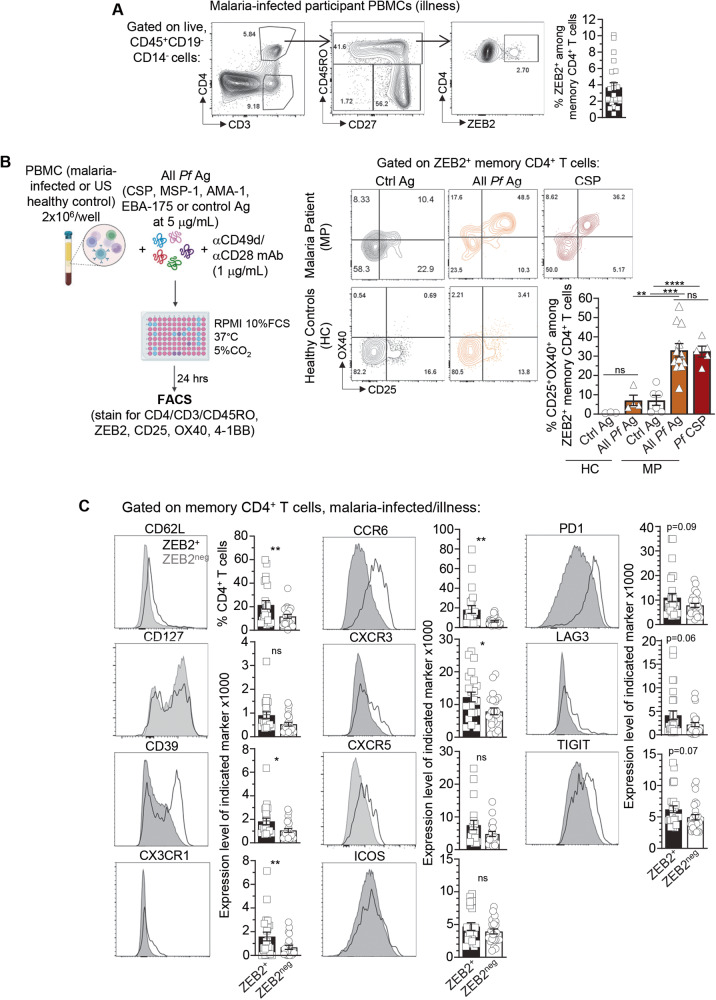
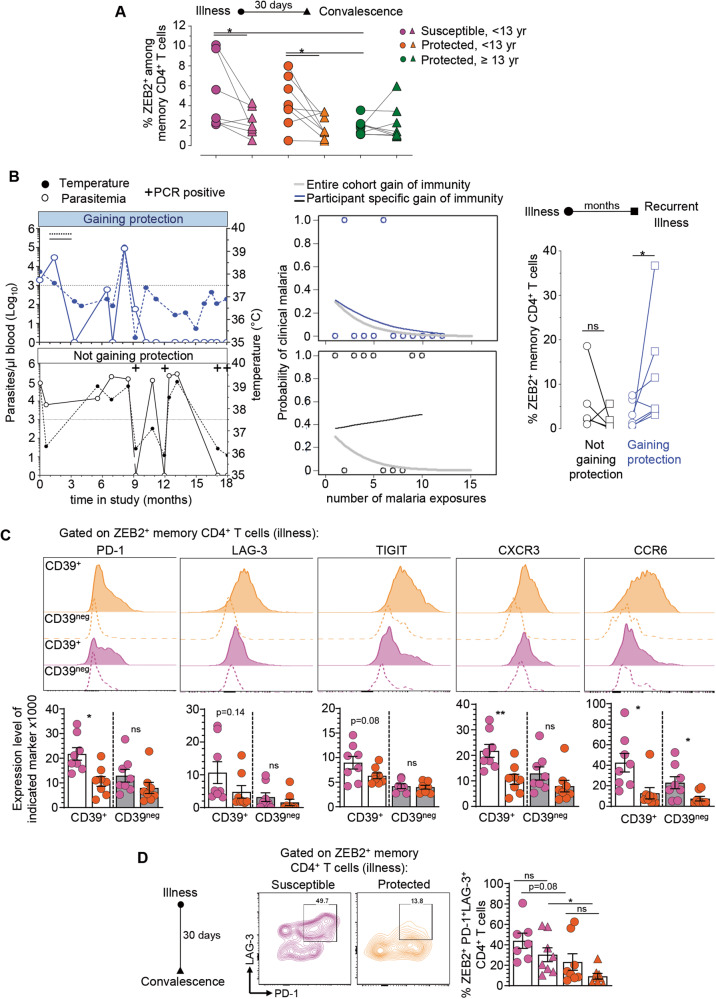
Clinical immunity against Plasmodium falciparum infection develops in residents of malaria endemic regions, manifesting in reduced clinical symptoms during infection and in protection against severe disease but the mechanisms are not fully understood. Here, we compare the cellular and humoral immune response of clinically immune (0-1 episode over 18 months) and susceptible (at least 3 episodes) during a mild episode of Pf malaria infection in a malaria endemic region of Malawi, by analysing peripheral blood samples using high dimensional mass cytometry (CyTOF), spectral flow cytometry and single-cell transcriptomic analyses. In the clinically immune, we find increased proportions of circulating follicular helper T cells and classical monocytes, while the humoral immune response shows characteristic age-related differences in the protected. Presence of memory CD4+ T cell clones with a strong cytolytic ZEB2+ T helper 1 effector signature, sharing identical T cell receptor clonotypes and recognizing the Pf-derived circumsporozoite protein (CSP) antigen are found in the blood of the Pf-infected participants gaining protection. Moreover, in clinically protected participants, ZEB2+ memory CD4+ T cells express lower level of inhibitory and chemotactic receptors. We thus propose that clonally expanded ZEB2+ CSP-specific cytolytic memory CD4+ Th1 cells may contribute to clinical immunity against the sporozoite and liver-stage Pf malaria.


Conflict of interest statement

The authors declare no competing interests.

Figures

Fig. 1
Fig. 1. Identification of participants with varied clinical immunity against malaria in a longitudinal study of an endemic region in Malawi.
A Overview of the 18-month longitudinal study of mild malaria participants with total enrollment number, clinical visits, and retention number at the end of the study. B Number of clinical reinfection episodes (symptoms, >2500 parasites/µl blood, with a prior episode at least 2 weeks apart) of each participant that completed the study. Upper tertile (67%) (≥3 clinical reinfections, susceptible, n = 33) and lower tertile (33%) (≤1 clinical reinfection, protected, n = 41) of participants are indicated. C Clinical parameters of temperature (°C), hematocrit (g/dL) and parasitemia (parasites/µl blood) of each protected (≤1 clinical reinfection, protected, n = 41) and susceptible participants (≥3 clinical reinfections, susceptible, n = 33) at the enrollment visit. D Number of total clinical reinfection episodes (y-axis, >2500 parasites/µl blood, at least 2 weeks apart) and participants’ age at time of enrollment (x-axis). Data was stratified by age, with susceptible participants (<13 yr, ≥3 clinical reinfections), protected participants (<13 yr, ≤1 clinical reinfection) and protected participants (≥13 yr, ≤1 clinical reinfection) are indicated. Pearson correlation coefficient and statistical significance are indicated. E Parasitemia (left axis), temperature (°C, right axis) and Pf PCR status indicated for each clinical visit of one representative susceptible, one protected age-matched and one protected adult participants over the 18-month longitudinal study. Dotted line is at 37.5 °C. Statistics: Two-sided Student’s t test was conducted between indicated groups, *p < 0.05, **p < 0.01, ***p < 0.001, ****p < 0.0001. Data are presented as means ± SEM (C).
Fig. 2
Fig. 2. Monitoring of P. falciparum specific antibody responses in participants during mild malaria illness.
A Number of Pf antigens recognized by participant’s plasma IgG (top) and abundance (bottom) of Pfalciparum-reactive plasma IgG antibodies (mean intensity) in plasma determined on Pf antigen array. The center line of box plots denotes medians of data points and the box hinges correspond to the 1st and 3rd quartiles, the whiskers of the box and whisker plot extend from the box to the minimum and maximum observations within 1.5 times the IQR of the lower and upper quartile, respectively. Two-sided Welch’s unpaired t-test was conducted between indicated groups (susceptible, <13 yr (n = 36, pink), protected, <13 yr (n = 11, orange) and protected, ≥13 yr (n = 17, green) *p < 0.05, **p < 0.01, ***p < 0.001. B Heatmap of normalized levels of IgG antibodies in individual participants (columns) against 45 Pf antigens (rows) that are significantly higher in protected versus susceptible groups (Two-sided Mann–Whitney test, p < 0.0001). C Pf merozoite opsonization assay with YOYO-1 labeled Pf merozoites incubated with indicated participant’s plasma, washed and then co-cultured with THP-1 cells. FACS plots of a representative sample within indicated groups, quantifying YOYO1+ THP1 cells after the co-culture (left). Summary of %YOYO1+ THP1 cells (right) indicating % Pf merozoite uptake when labeled merozoites were incubated with or without indicated plasma (n = 3) from susceptible (n = 8, pink), protected < 13yr (n = 6, orange), protected ≥13 yr (n = 7, green) and co-cultured with THP1 cells. Two-sided Welch’s unpaired t test were conducted between indicated groups, *p < 0.05, **p < 0.01, ***p < 0.001. Pool of two independent experiments represented as individual data and means ± SEM (C).
Fig. 3
Fig. 3. Overview of CyTOF analysis of immune cell populations in the blood of malaria-infected participants.
A FlowSOM (top) and t-SNE (bottom) visualization of live PBMCs of a representative sample within each indicated group based on lineage markers expressed on cells and detected by mass cytometry (CyTOF). Shannon Diversity Index for each group of patients (susceptible, <13 yr (n = 10, pink), protected, <13 yr (n = 8, orange) and protected, ≥ 13 yr (n = 10, green), with individual symbol representing one patient. Overlaid immune cell populations on the t-SNE plots are indicated. B Summary of innate and adaptive immune cell frequencies in PBMCs of malaria infected participants. Mean cell frequency is indicated for susceptible, <13 yr (n = 13, pink), protected, <13 yr (n = 8, orange) and protected, ≥ 13 yr (n = 10, green). Summary of the immune cell subset frequency in participants during malaria illness among indicated groups are shown. Bar graphs represent mean cell frequency values. Statistical significance is calculated by two-sided unpaired Student’s t test between indicated groups with correcting for multiple comparisons, *p < 0.05, **p < 0.01, ***p < 0.001, ****p < 0.0001. Pool of three independent experiments represented as individual data and means ± SEM (A, B).
Fig. 4
Fig. 4. CyTOF analysis of T and B cell populations in the blood of malaria infected participants.
AC Representative CyTOF plots of one participant from each group stained with a 33-marker heavy metal tagged antibody cocktail. Contour plots indicate the staining and gating strategy for CD4+, CD8+ T cell and B cell subsets among live PBMCs. Summary of the immune cell subset frequency in participants during malaria illness among susceptible, <13 yr (n = 13, pink), protected, <13 yr (n = 8, orange) and protected, ≥ 13 yr (n = 10, green) are shown. Bar graphs represent mean cell frequency values. Statistical significance is calculated by two-sided unpaired Student’s t test between indicated groups, *p < 0.05, **p < 0.01, ***p < 0.001. Pool of three independent experiments represented as individual data and means ± SEM (AC).
Fig. 5
Fig. 5. Single-cell transcriptomic analysis of memory CD4+ T cells from protected participants during malaria illness.
A UMAP visualization of integrated single-cell RNA-seq results on memory CD4+ T cells isolated from 3 protected participants (age 18.4, 24.6, 34 yrs) during malaria infection. Clusters of memory CD4+ T cells with distinct transcriptional profiles are colored as indicated in the legend. B Normalized expression levels of indicated genes within each distinct memory CD4+ T cell cluster defined in (A). C Table of top signature genes expressed in each distinct memory CD4+ T cell cluster defined in (A).
Fig. 6
Fig. 6. Expanded memory CD4+ T cell clones in malaria protected patients exhibit a cytolytic gene expression signature.
(A) Frequency of each expanded memory CD4+ T cell clone expressing an identical TCR clonotype among all memory CD4+ T cells in patient 1 (n=10, Orange), patient 2 (n=6, Green), patient 3 (n=9, Blue), as defined by single-cell TCR-seq. (B) Expanded memory CD4+ T cell clones (at least 10 cells sequenced with the exact same TCRα and TCRβ chains) in each of the 3 participants, highlighted on the concatenated UMAP visualization shown in Fig. 5A. (C) Pie-chart of expanded memory CD4+ T cell clone proportions across distinct transcriptional clusters defined in Fig. 5A and across the 3 protected participants. (D) Distribution of individual clones with identical TCR clonotype across memory CD4+ T cell cluster 1, 2, 3 and 4 (as defined in Fig. 5) and across the 3 protected participants. (E) Pseudotime analysis of the memory CD4+ T cell subsets of Fig. 5A. (F) Cumulative proportion of expanded memory CD4+ T cell clones expressing indicated gene-encoding transcripts across the 3 participants. (G) Proportion of cells that express ZEB2 or (Granzyme B (GZMB) transcripts among all memory CD4+ T cells or only among expanded T cell clones (n=3). Pool of three independent experiments represented as individual data and means ± SEM (A, F, G).
Fig. 7
Fig. 7. ZEB2+ memory CD4+ T cells react to the P. falciparum-derived circumsporozoite protein 1 (CSP) antigen.
A Gating strategy of ZEB2+ memory CD4+ T cells on a representative protected malaria participant during illness. Frequency of ZEB2+ memory CD4+ T cells across all study participants (n=23) and during a malaria episode. B Experimental design of the AIM assay. Representative FACS dot plots of CD25 and OX40 expression by ZEB2+ memory CD4+ T cells in i) Healthy controls (HC) stimulated with control antigen (ctrl Ag) (n = 3,white) or all Pf Ag (Circumsporozoite Protein (CSP), Merozoite Surface Protein-1 (MSP-1), Apical Membrane Antigen 1 (AMA-1), Erythrocyte Binding Antigen 175 (EBA-175) (n = 4,brown) and in ii) Malaria Patients (MP) stimulated with ctrl Ag (n = 6,white), all Pf Ag (n = 12, brown) or Pf CSP (n = 5, red). C Cell-surface expression of indicated markers by ZEB+ versus ZEB2neg memory CD4+ T cells across participants (n = 23) using spectral flow cytometry. Each symbol is one participant. P-values were calculated using two-sided unpaired Student’s t tests. Pool of 3 independent experiments represented as individual data and means ± SEM (AC).
Fig. 8
Fig. 8. ZEB2+ memory CD4+ T cells expand during P. falciparum infection and in individuals gaining clinical immunity.
A Frequencies of ZEB2+ cells among memory CD4+ T cells in susceptible, <13 yr (n = 7, pink), protected, <13 yr (n = 8, orange) or protected, ≥13 yr (n = 8, green) malaria participants during illness (circle symbol) and at day 30 post illness (convalescence, triangle symbol). B Representative examples of recorded temperature, blood parasitemia and Pf PCR testing of two aged-matched participants either gaining clinical immunity or not during our 18-month study. Predictive model of such behavior in each participant is shown. Frequencies of ZEB2+ memory CD4+ T cells across participants gaining (n = 6) or not (n = 6) clinical immunity during the study period, at an early and later episode of malaria. C Cell-surface expression of indicated markers on CD39+ or CD39neg ZEB2+ memory CD4+ T cells of aged-matched protected (n = 8, Orange) versus susceptible participants (n = 8, Pink). D Co-expression of PD1 and LAG-3 on ZEB2+ memory CD4+ T cells of aged-matched protected (n = 8, Orange) versus susceptible participants (n = 8, Pink). Each symbol is one participant and P-values were calculated using two-sided Student’s t tests with *p < 0.05, **p < 0.01. Pool of two independent experiments represented as individual data and means ± SEM (C, D).

Similar articles

Cited by

References

    1. World Health Organization. World Malaria Report 2021 (WHO, 2021).
    1. Boivin MJ, et al. Malaria illness mediated by anaemia lessens cognitive development in younger Ugandan children. Malar. J. 2016;15:210. doi: 10.1186/s12936-016-1266-x. - DOI - PMC - PubMed
    1. Fernando D, de Silva D, Wickremasinghe R. Short-term impact of an acute attack of malaria on the cognitive performance of schoolchildren living in a malaria-endemic area of Sri Lanka. Trans. R. Soc. Trop. Med. Hyg. 2003;97:633–639. doi: 10.1016/S0035-9203(03)80093-7. - DOI - PubMed
    1. Milner EM, et al. Association between malaria infection and early childhood development mediated by anemia in rural Kenya. Int. J. Environ. Res. Public Health. 2020;17:902. doi: 10.3390/ijerph17030902. - DOI - PMC - PubMed
    1. Crompton PD, et al. Malaria immunity in man and mosquito: insights into unsolved mysteries of a deadly infectious disease. Annu. Rev. Immunol. 2014;32:157–187. doi: 10.1146/annurev-immunol-032713-120220. - DOI - PMC - PubMed

Publication types

Associated data