. 2023 Nov 24;14(1):7714.
doi: 10.1038/s41467-023-43446-1.

Genetic separation of Brca1 functions reveal mutation-dependent Polθ vulnerabilities

Affiliations

Genetic separation of Brca1 functions reveal mutation-dependent Polθ vulnerabilities

John J Krais et al. Nat Commun. .

Abstract

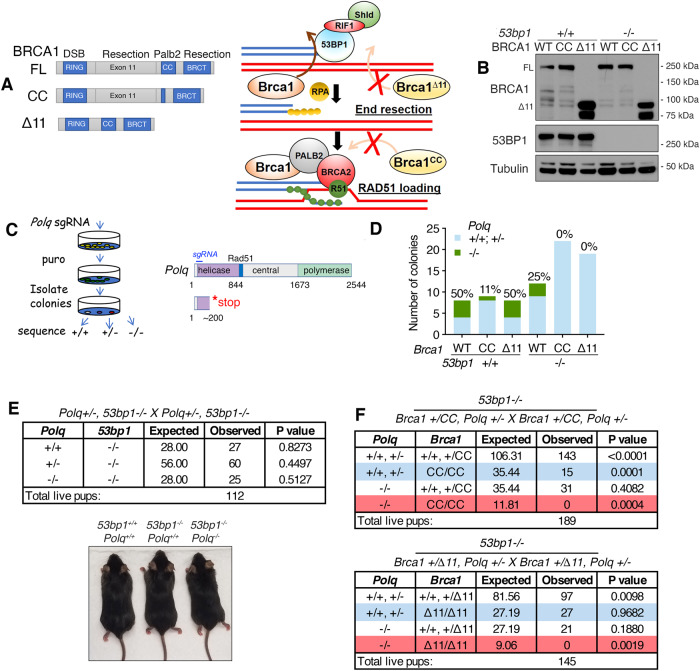
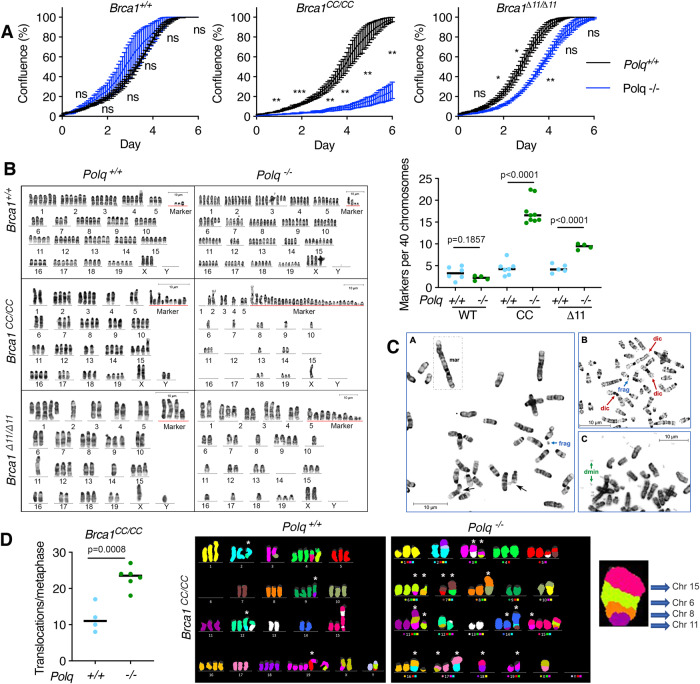
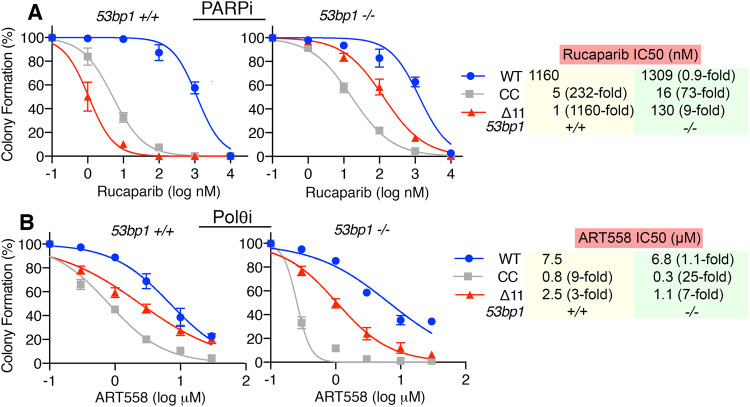
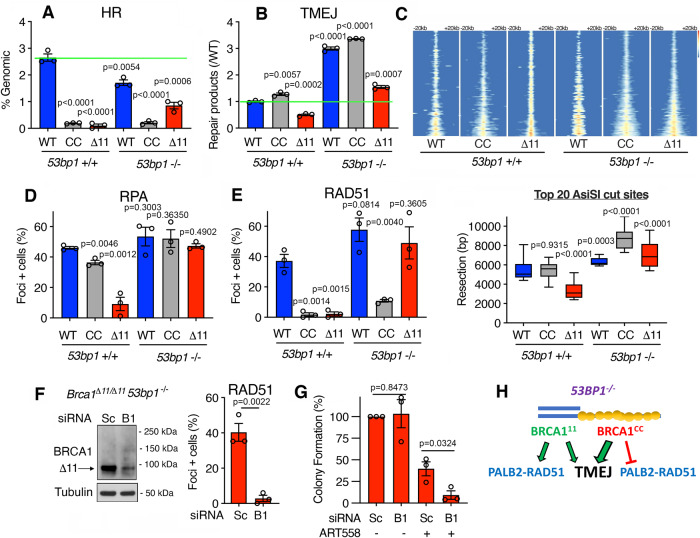
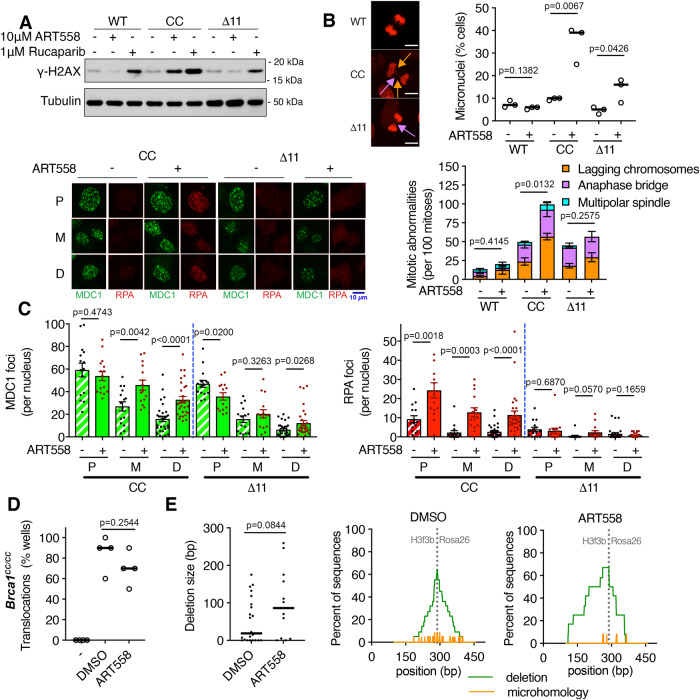
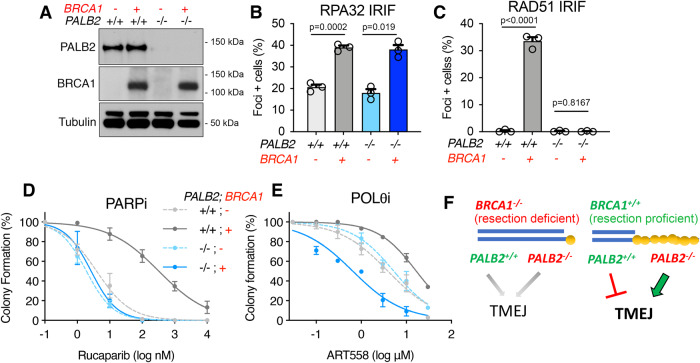
Homologous recombination (HR)-deficiency induces a dependency on DNA polymerase theta (Polθ/Polq)-mediated end joining, and Polθ inhibitors (Polθi) are in development for cancer therapy. BRCA1 and BRCA2 deficient cells are thought to be synthetic lethal with Polθ, but whether distinct HR gene mutations give rise to equivalent Polθ-dependence, and the events that drive lethality, are unclear. In this study, we utilized mouse models with separate Brca1 functional defects to mechanistically define Brca1-Polθ synthetic lethality. Surprisingly, homozygous Brca1 mutant, Polq-/- cells were viable, but grew slowly and had chromosomal instability. Brca1 mutant cells proficient in DNA end resection were significantly more dependent on Polθ for viability; here, treatment with Polθi elevated RPA foci, which persisted through mitosis. In an isogenic system, BRCA1 null cells were defective, but PALB2 and BRCA2 mutant cells exhibited active resection, and consequently stronger sensitivity to Polθi. Thus, DNA end resection is a critical determinant of Polθi sensitivity in HR-deficient cells, and should be considered when selecting patients for clinical studies.


Conflict of interest statement

G.P.G. has received research funding from Breakpoint Therapeutics and Merck. R.T.P. is a cofounder and chief scientific officer of Recombination Therapeutics, LLC. The remaining authors declare no competing interests.

Figures

Fig. 1
Fig. 1. Assessment of cellular and organismal Polq−/− phenotypes.
A Cartoon showing (left), Brca1 alleles and protein products with domain functions indicated; (Right), Brca1 functions in HR (simplified), the Brca1-Δ11 protein is defective for DNA end resection; the Brca1-CC protein is defective for Palb2-Brca2-Rad51 loading. B Western blotting for the indicated proteins in MEF cell lines. C Cartoon showing (left), process for generating CRISPR/Cas9 manipulated MEFs. (Right), Polθ protein domains and predicted effect of stop codon from sgRNA targeted exon 4 of Polq. D Polq gene mutations were binned according to whether frameshift mutations in both alleles (−/−) (green), or retaining at least one allele with a missense or one frameshift mutation (+/+, +/−) (blue). See Supplementary Data 1. E Mice with the indicated genotypes were intercrossed, and expected and observed genotypes were shown. A representative photograph of mice with the indicated genotypes is shown. See Supplementary Fig. 1e. P values are obtained from two-sided chi-square goodness of fit tests for the binomial of each genotype. F Mice with the indicated genotypes were intercrossed, and expected and observed genotypes were shown. P values were obtained from chi-square goodness of fit tests comparing expected and observed genotypes. Source data are provided as a Source Data file.
Fig. 2
Fig. 2. Cell growth and chromosome analyses of Polq−/− genotypes.
A Growth curves were obtained for Polq−/− clones and control cells (sgGFP) for Brca1+/+, Brca1CC/CC, and Brca1Δ11/Δ11 MEFs based on confluence measurements obtained using a Sartorius Incucyte imager. Confluence and S.E.M. of three independent experiments are shown. ***p < 0.001; **p < 0.01; *p < 0.05; ns, not significant (unpaired, two-tailed t tests comparing Polq+/+ and Polq−/− confluence on each day). B Representative karyograms are shown for the indicated genotypes and marker chromosome counts are shown normalized to 40 chromosomes per metaphase. Each data point is an individual metaphase, n = 6, 4, 7, 9, 5, 4 (unpaired, two-tailed t tests). See Supplementary Table 1. C Example G-banded partial metaphase spreads from Brca1CC/CC, Polq−/− cells highlighting marker (mar) chromosome, fragments (frag), dicentric (dic), double minutes (dmin), and chromatid breaks (arrows) are shown from 1 experiment. D Brca1CC/CC, Polq+/+ and Brca1CC/CC, Polq−/− metaphase spreads were stained using mFISH and karyograms generated. The number of translocations per metaphase were quantified, n = 4, 6. Representative mFISH karyograms are shown, and a magnified image of a derivative chromosome consisting of segments from four different chromosomes is highlighted, far right. * indicate clonal marker chromosomes. See Supplementary Data 2, 3 and Supplementary Fig. 2d. Source data are provided as a Source Data file.
Fig. 3
Fig. 3. ART558 and PARPi sensitivity profiles.
A Cells were incubated with increasing concentrations of rucaparib for 2 weeks and colony formation assessed. Mean and S.E.M. colony formation as well as mean IC50 values, n = 4 biological replicates. Fold changes in IC50 relative to Brca1+/+, 53bp1+/+ (WT) are shown. B Cells were incubated with increasing concentrations of ART558 for 2 weeks and colony formation assessed, as for A. Source data are provided as a Source Data file.
Fig. 4
Fig. 4. Genotype-conferred DNA repair profiles.
A HR repair was measured by ddPCR following Cas9-induced DSB generation in cells of the indicated genotypes. HR measurements are quantifications of repair products generated from a homologous template as a proportion of the non-templated sequence and presented as a percentage of genomic DNA copies determined by a control reaction for n = 3 biological replicates. Mean and S.E.M. are shown. B TMEJ was measured by ddPCR for 3 distinct repair products, summed, and normalized to the TMEJ products detected in wild-type MEFs for n = 3 biological replicates. Mean and S.E.M. are shown. C END-seq was used to quantify resection for MEFs expressing the nuclease AsiSI with the indicated genotypes. (Top) Heatmaps of normalized, binned END-seq signal centered at AsiSI sites and extending 20 kb in both directions. (Bottom) Resection distances were calculated for each AsiSI site and quantifications shown by Tukey box and whisker plot for the top 20 resected sites for each sample, with the box drawn from the 1st to 3rd quartile and median indicated with a line. D Cells were (2 Gy) γ-irradiated and after 6 h pre-extracted, fixed, and assessed for Rpa foci formation using immunofluorescence staining. Mean and S.E.M. percentage of cells with more than 5 foci for n = 3 biological replicates. E Cells were assessed for Rad51 foci as described in D. F Brca1Δ11/Δ11, 53bp1−/− cells were treated with siRNA targeting the Δ11 isoform of Brca1 (B1) or scrambled control siRNA (Sc). Left, western blotting confirmed knockdown of the Brca1-Δ11 isoform. Right, Cells were assessed for Rad51 foci formation as in D. Mean and S.E.M. percentage of cells with more than five foci for n = 3 biological replicates. G Cells from F were seeded in the presence of DMSO or 1 μM ART558 and the indicated siRNA and colony formation were measured. Colony counts were normalized to DMSO-treated controls for independent experiments and mean and S.E.M were shown for n = 3 biological replicates. H Model demonstrating the interplay between 53bp1 and Brca1 mutations. Statistical significance was assessed by unpaired, two-tailed t tests. Source data are provided as a Source Data file.
Fig. 5
Fig. 5. DNA damage and translocations with ART558.
A Brca1+/+, Brca1CC/CC, and Brca1Δ11/Δ11 MEFs were treated with DMSO, ART558, or rucaparib for 24 h, and whole cell extracts were collected to assess γH2ax by western blotting. Representative blots from three independent experiments are shown. B MEFs expressing H2B-mCherry were tracked after 72 h of DMSO or 10 μM ART558 treatments. (Top) The percentage of nuclei with micronuclei present are shown for individual replicates (bar is the median). (Bottom) Individual mitoses were classified as normal or abnormal with mean and S.E.M. percentages for n = 3 biological replicates. Representative images and examples of lagging chromosomes (orange arrow) and anaphase bridges (pink arrow) are shown. Scale bar is equal to 10 μm. See Supplementary Fig. 3b for additional images. C Brca1CC/CC and Brca1Δ11/Δ11 MEFs were treated with thymidine for 16 h and then released into fresh media. DMSO or 10 μM ART558 was added 2 h after release and live cells were imaged for GFP-MDC1 and RPA2-mCherry. MDC1 and RPA2 foci were quantified for 15 individual cells that entered mitosis with foci present over three independent experiments. The mean and S.E.M. number of foci are shown prior to mitosis (P), during mitosis (M), and in daughter cells (D). Representative images are shown. D Translocation frequency in Brca1CC/CC cells was determined after inducing breaks in Rosa26 and H3f3b loci. Cells growing in 96 well plates with DMSO or 10 μM ART558 were compared to wells with no break induction (−). The average percentage of wells with detectable translocation products is shown for n = 4 biological replicates (bar is median). See Supplementary Fig. 3c. E Breakpoint junctions for individual wells from D were sequenced and aligned to the predicted translocation product. (Left) Deletion size was determined for each sequence. (Right) The frequency of deletions (green) and microhomologies (orange) are shown at each coordinate of the predicted translocation product. If multiple sequence traces were detected and could not be deconvolved, those sequences were excluded from analyses, see Supplementary Fig. 3d. Statistical significance was assessed for the indicated comparisons by unpaired, two-tailed t tests. Source data are provided as a Source Data file.
Fig. 6
Fig. 6. HR deficiencies and ART558 sensitivity.
A MDA-MB-436 clones with control sgRNA targeting BFP, or PALB2 knockout with and without ectopic BRCA1 addback. Expression of the indicated proteins was assessed by western blotting. B RPA foci formation was measured in geminin-positive cells 8 h after 10 Gy γ-irradiation. Cells with >10 RPA foci were counted as positive. Mean and S.E.M. shown for n = 3 biological replicates. C As for B, cells with 5 or more RAD51 foci were counted positive. D Cells were seeded into increasing concentrations of rucaparib and colony formation was measured after 2 weeks. Mean and S.E.M from n = 3 biological replicates. E Cells were seeded into increasing concentrations of ART558 and colony formation was measured after 2 weeks. Mean and S.E.M from n = 3 biological replicates. See Supplementary Fig. 4. F Model depicts TMEJ usage in BRCA1 proficient and deficient settings. We propose that BRCA1 deficiency leads to moderate TMEJ dependence due to minimal DNA end resection. In contrast, BRCA1+/+ cells are proficient in DNA end resection resulting in hyper-dependence on TMEJ in the absence of RAD51 loading caused by PALB2 or BRCA2 mutations. Source data are provided as a Source Data file.

Similar articles

Cited by

References

    1. Bunting SF, et al. 53BP1 inhibits homologous recombination in Brca1-deficient cells by blocking resection of DNA breaks. Cell. 2010;141:243–254. doi: 10.1016/j.cell.2010.03.012. - DOI - PMC - PubMed
    1. Bouwman P, et al. 53BP1 loss rescues BRCA1 deficiency and is associated with triple-negative and BRCA-mutated breast cancers. Nat. Struct. Mol. Biol. 2010;17:688–695. doi: 10.1038/nsmb.1831. - DOI - PMC - PubMed
    1. Zhang F, et al. PALB2 links BRCA1 and BRCA2 in the DNA-damage response. Curr. Biol. 2009;19:524–529. doi: 10.1016/j.cub.2009.02.018. - DOI - PMC - PubMed
    1. Zhang F, Fan Q, Ren K, Andreassen PR. PALB2 functionally connects the breast cancer susceptibility proteins BRCA1 and BRCA2. Mol. Cancer Res. 2009;7:1110–1118. doi: 10.1158/1541-7786.MCR-09-0123. - DOI - PMC - PubMed
    1. Sy SM, Huen MS, Chen J. PALB2 is an integral component of the BRCA complex required for homologous recombination repair. Proc. Natl Acad. Sci. USA. 2009;106:7155–7160. doi: 10.1073/pnas.0811159106. - DOI - PMC - PubMed

Publication types

Associated data