. 2023 Nov 24;14(1):7712.
doi: 10.1038/s41467-023-43427-4.

Stepwise differentiation of follicular helper T cells reveals distinct developmental and functional states

Affiliations

Stepwise differentiation of follicular helper T cells reveals distinct developmental and functional states

Manuel A Podestà et al. Nat Commun. .

Abstract

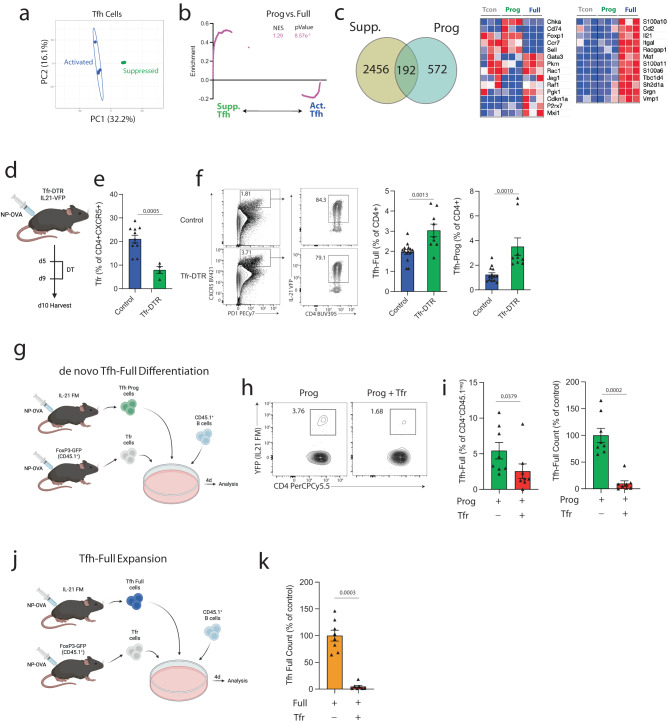
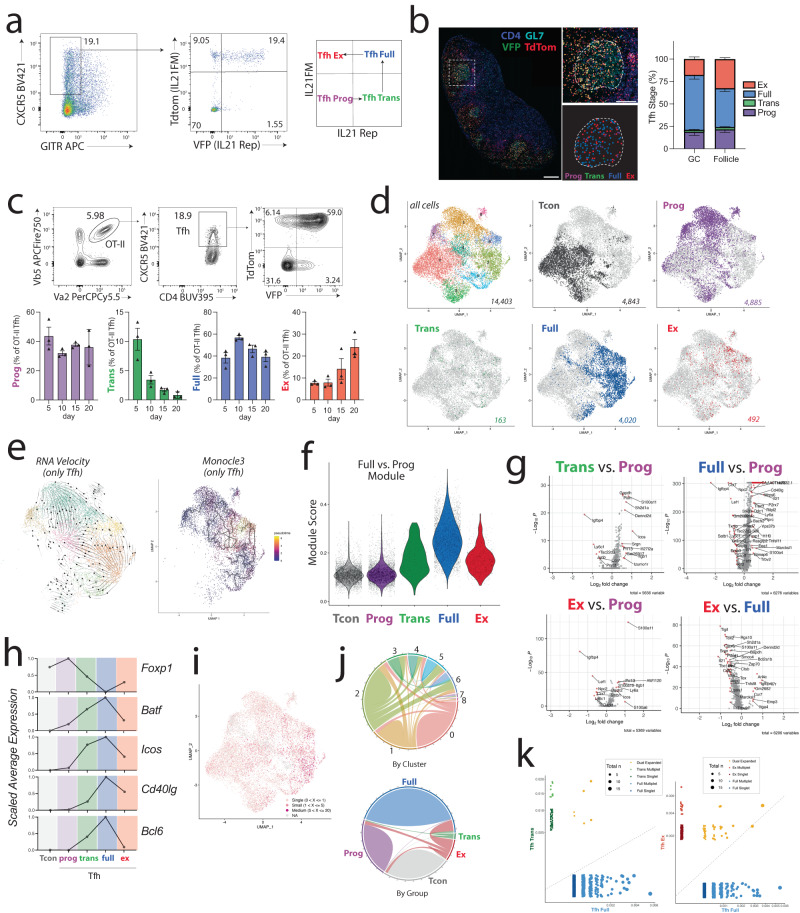
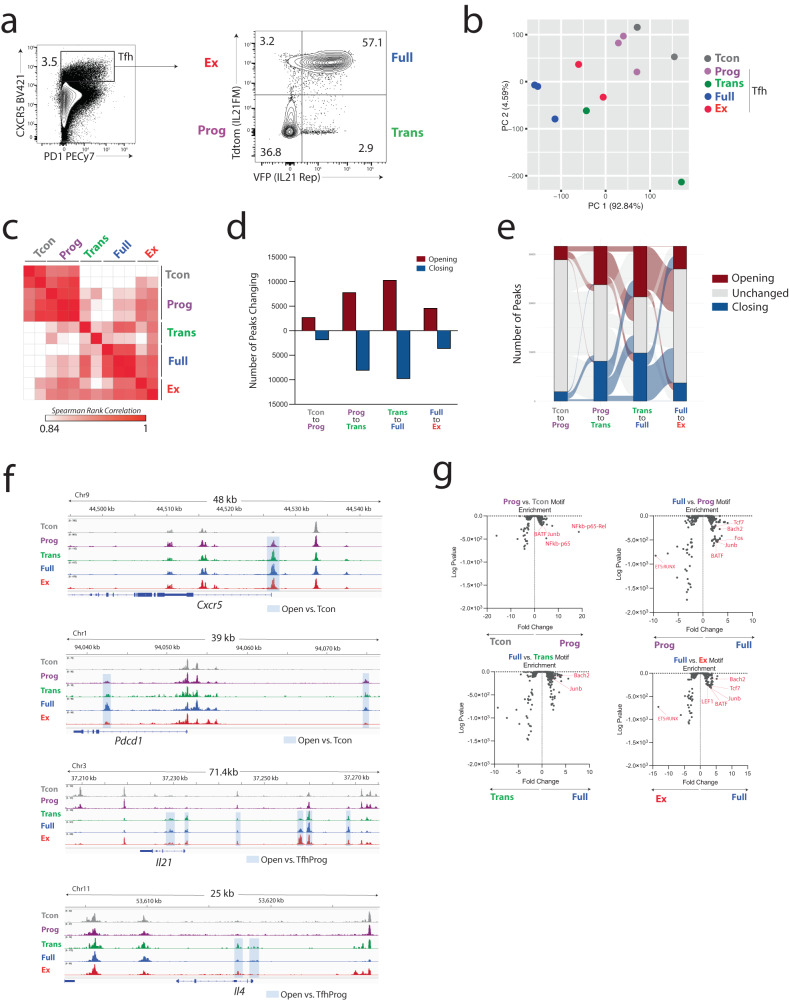
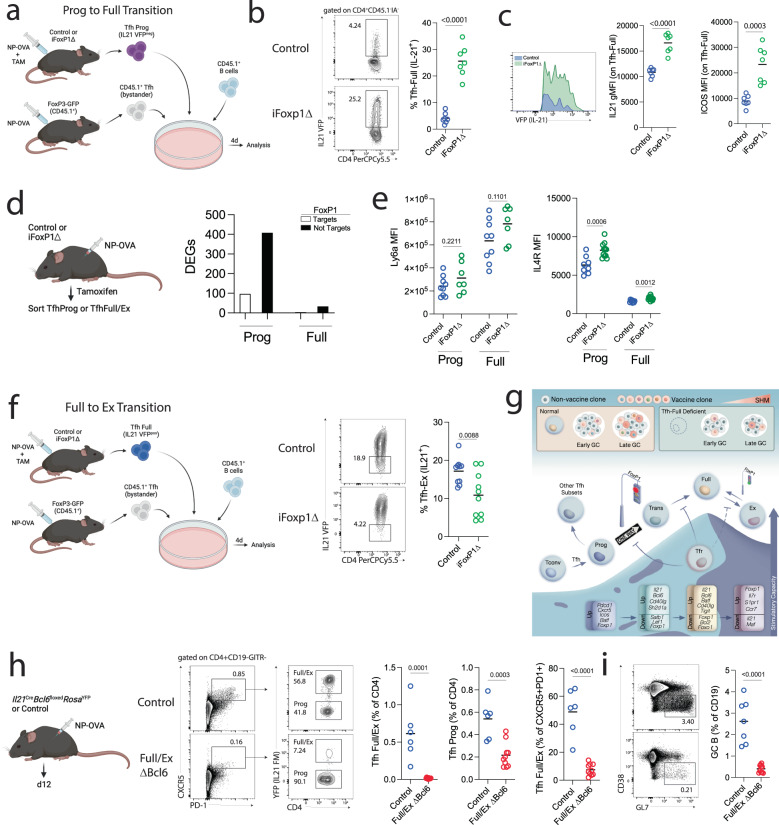
Follicular helper T (Tfh) cells are essential for the formation of high affinity antibodies after vaccination or infection. Although the signals responsible for initiating Tfh differentiation from naïve T cells have been studied, the signals controlling sequential developmental stages culminating in optimal effector function are not well understood. Here we use fate mapping strategies for the cytokine IL-21 to uncover sequential developmental stages of Tfh differentiation including a progenitor-like stage, a fully developed effector stage and a post-effector Tfh stage that maintains transcriptional and epigenetic features without IL-21 production. We find that progression through these stages are controlled intrinsically by the transcription factor FoxP1 and extrinsically by follicular regulatory T cells. Through selective deletion of Tfh stages, we show that these cells control antibody dynamics during distinct stages of the germinal center reaction in response to a SARS-CoV-2 vaccine. Together, these studies demonstrate the sequential phases of Tfh development and how they promote humoral immunity.


Conflict of interest statement

The authors declare no competing interests.

Figures

Fig. 1
Fig. 1. Tfh-full cells are phenotypically distinct from Tfh-Prog cells.
a Il21CreRosa26Lox-STOP-Lox-YFP mice were immunized with NP-OVA and tissues collected. (Left) Gating strategy for Tfh-Prog (“Prog”) and Tfh-Full (“Full”) cells. (Middle) Quantification of Tfh-Prog and Tfh-Full cells over time. (Right) Distribution of Tfh-Prog and Tfh-Full cells of all Tfh cells (n = 3 for 0,5d and n = 4 for 8,11d). b Frequency of “Tcon21” (CD4 + CXCR5-YFP+) cells in lymph nodes and blood from mice as in (a). c Cell trace violet (CTV) labeled CD4 T cells from OT-II+Il21CreRosa26Lox-STOP-Lox-YFP mice were transferred to WT mice which were NP-OVA immunized and organs harvested on day 9 (n = 8). d PCA plot of indicated populations from NP-OVA immunized Il21CreRosa26Lox-STOP-Lox-YFP mice using bulk RNAseq transcriptional data. (n = 3 independent experiments shown, each included 10 mice per group). e GSEA enrichment of a “Tfh gene module” (from Hou et al.) in Tfh-Prog vs. Tcon or Tfh-Full vs. Tcon. NES= normalized enrichment score. P values were calculated with empirical phenotype-based permutation tests. f Volcano plot comparing genes in Tfh-Full versus Tfh-Prog cells from RNAseq data in (d)). P values were calculated using EdgeR. g Heatmap of genes involved in indicated pathways. Asterisks indicate genes significantly different (P < 0.05) between Tfh-Prog and Tfh-Full cells from (f). h Expression of ICOS, CD44 or CD62L in Tfh-Prog and Tfh-Full cells at indicated times post vaccination. (n = 3 for 5d and n = 4 for 8,11d). i Micrograph of dLN from NP-OVA immunized Il21CreRosa26Lox-STOP-Lox-YFP mouse. Scale bars (left, 250 μM; right 100 μM). Micrograph is from one experiment which is representative of 3 independent repeats. a, b, c, h Data are represented as mean ± s.e.m. a One-way ANOVA with Dunnett’s correction. c, h Unpaired two-tailed student’s t-test.
Fig. 2
Fig. 2. Tfr cells regulate the Tfh-Prog to Tfh-Full transition.
a Principal component analysis (PCA) plot showing activated (“Activated”) or Tfr-suppressed (“Suppressed”) Tfh cells using RNASeq data from Sage et al.. b Gene set enrichment analysis (GSEA) of Activated or Suppressed Tfh cells using a Tfh-Prog vs. Tfh-Full gene set (from RNAseq in Fig. 1). NES= normalized enrichment score. P value was calculated using empirical phenotype-based permutation tests (GSEA). c (Left) Diagram demonstrating genes differentially expressed (P < 0.05 calculated using EdgeR) in both Suppressed versus Activated Tfh cells (Sage et al.) and Tfh-Prog versus Tfh-Full cells. (Right) Heatmap of RNASeq data for a subset of genes from (c). d IL-21 reporter Control (Foxp3CreCXCR5WTIl21VFP) or Tfr-DTR (Foxp3CreCXCR5Lox-STOP-Lox-DTRIl21VFP) mice were immunized with NP-OVA and diphtheria toxin (DT) given to delete Tfr cells. DLNs were harvested on day 10. e Frequency of Tfr cells from (d). (Con n = 11, DTR n = 4), and is combined data from 2 independent experiments, error bars indicate mean ± s.e.m.). P value was calculated using two-tailed unpaired Student’s t-test. f Gating strategy (left) and quantification (middle) of Tfh-Full cells or Tfh-Prog cells (right) from experiments as in (e) (Con n = 14, DTR n = 9), and is combined data from 3 independent experiments, error bars indicate mean ± s.e.m. P value indicates two-tailed unpaired Student’s t-test. g De novo Tfh-Full differentiation. Tfh-Prog (CD4+CXCR5+YFP− ) cells were sorted from immunized IL-21 FM (Il21creRosa26YFP) mice and cultured with B and Tfr (CD4+CXCR5+FoxP3+) cells from CD45.1+ Foxp3GFP mice along with anti-IgM and anti-CD3/28 beads. h Gating strategy for Tfh-Full cells as in (g). Plots are pregated on CD45.1CD4+IA. i Frequency (left) or count (right) of Tfh-Full cells. (n = 8, and is combined data from 2 independent experiments, error bars indicate mean ± s.e.m. P values were calculated using unpaired Mann–Whitney test). j Schematic to assess Tfh-Full expansion. Tfh-Full (CD4+CXCR5+YFP+) cells were sorted from IL-21 FM (Il21creRosa26YFP) mice and cultured. k Tfh-Full count (normalized to control mean). (n = 8 replicates per group, and is combined data from 2 independent experiments, error bars indicate mean ± s.e.m.). P values were calculated using unpaired Mann–Whitney test.
Fig. 3
Fig. 3. Stepwise differentiation of effector Tfh cells is driven by transcriptional programming.
a Tg(Il21cre)Rosa26Lox-STOP-Lox-TdTomatoIl21VFP (“IL-21FM/Rep”) mice were immunized with NP-OVA and dLN harvested on day 9. Gating strategy for the four developmental stages of Tfh cells: Progenitor (“Prog”), Transitory (“Trans”), Fully differentiated (“Full”), Ex IL-21 expressors (“Ex”). Plots are pregated on CD4+CD19- cells. b LNs from experiments as in (a) were assessed by microscopy. Representative LN with individual GC is shown. Scale bars = 250 μM (left) and 100 μM (right). Distribution of individual Tfh developmental stages among total Tfh in GC and non-GC B cell follicle are shown (n = 6, GC; n = 8, Follicle). Data are represented as mean ± s.e.m. c CD4+ T cells from OTII+IL-21FM/Rep mice were transferred to WT mice which were immunized. dLNs were harvested on indicated days. n = 3 per group. d Uniform Manifold Approximation and Projection (UMAP) of scRNAseq data derived from indicated populations (gated as in (a)) from IL-21FM/Rep mice 9 days after immunization with NP-OVA. All cells and indicated individual groups are shown. Number indicates cells in group. e RNA velocity (left) and Monocle pseudo-time analysis (right) including only Tfh developmental stages. f Gene module score for a Tfh “Full vs. Prog gene module” derived from bulk RNAseq data in Fig. 1f. g Differential gene expression (DESeq2 model implemented in the Seurat FindAllMarkers() function with a log(fold-change) threshold of 0.1) between indicated groups. Ribosomal genes are omitted from plots. h Scaled average expression of selected genes across Tfh developmental stages (obtained with the Seurat AverageExpression function) i Extent of clonal expansion in dataset. j Circos plot showing clonal overlap in cells by cluster or by stage (only expanded clones included). k Scatter plots with clonal overlap between indicated Tfh subsets.
Fig. 4
Fig. 4. Tfh developmental stage transitions undergo epigenetic remodeling.
a Tg(Il21cre)Rosa26Lox-STOP-Lox-TdTomatoIl21VFP mice were immunized with NP-OVA and dLNs harvested on day 9. Tfh-Prog, Tfh-Trans, Tfh-Full, and Tfh-Ex (gated as shown) as well as CD4+CXCR5T conventional cells (Tcon) were sorted and processed for Assay for Transposase-Accessible Chromatin with high-throughput sequencing (ATAC-seq) analyses. Three replicates for the most abundant populations (Tfh-Prog, Tfh-Full, and Tcon) and two for the least abundant (Tfh-Trans and Tfh-Ex) were included in the analyses. DNA input was normalized during sequencing library preparation. b Principal Component Analysis (PCA) of normalized ATACseq peak counts. c Similarity matrix using Spearman Rank Correlation of ATACseq chromatin accessibility data. d Number of peaks either opening or closing in indicated developmental stage transitions. e Alluvial plot showing individual peaks opening, closing or not changing throughout the Tfh developmental stage transitions. Only peaks that change in at least one transition are shown. f Chromatin accessibility tracks for Tfh developmental stage transitions at indicated loci of the genome. Blue shaded regions are peaks differentially accessible compared to Tcon. g Transcription factor motif enrichment analysis (HOMER) of peaks differentially accessible in indicated Tfh developmental stages.
Fig. 5
Fig. 5. Tfh-Full/Ex cells stabilize primary germinal centers to optimize somatic hypermutation after vaccine boosting.
a Control (Il21CreRosa26YFPCxcr5WT) or F/Ex-DTR (Il21CreRosa26YFPCxcr5LSL-DTR) mice were immunized with SARS-CoV-2 Spike and Tfh-Full/Ex deleted. b Gating of Tfh-Full and Tfh-Ex cells, pregated on CD4+CD19 cells. c Frequencies of Tfh-Full/Ex, Tcon21 (YFP+CXCR5CD4+) and Tfr cells (n = 4). d Frequencies of GC or total B cells, pregated on CD19+ cells. (n = 4 Con, n = 5 DTR). e GC B single cell cultures (GC SCC) (left). Left pie charts indicate frequency of total Spike+ clones (of all IgG+). Numbers indicate total clones. Right pie charts indicate Spike domain specificity of Spike+ IgG+ clones. ND not detected. f Tfh-Full/Ex deletion during GC contraction. (right) Serology of SARS-CoV-2 Spike IgG (n = 10, Control; n = 17, DTR). Data are combined from 2 independent experiments, error bars indicate mean ± s.e.m.). g Gating of Tfh-Full/Ex cells, pregated on CD4+CD19GITR. h Frequencies of Tfh (CD4+CXCR5+PD1+GITR), Tfh-Full/Ex (CD4+CXCR5+ PD1+GITRYFP+), and Tfr (CD4+CXCR5+PD1+Foxp3+) cells (n = 6, Control; n = 4, DTR). Error bars indicate mean ± s.e.m. i Frequency of GC B cells (n = 12, Control; n = 9, DTR), and is combined data from 3 independent experiments, error bars indicate mean ± s.e.m. j GC SCC assays. Data represents IgG+ clones in each group. Number indicates total clones (left). Bar graphs indicate the frequency of Spike+ GC B cells as a frequency of total GC B or total CD19+ cells per mouse. (n = 6, Control; n = 4, DTR), and is combined data from 3 independent experiments, error bars indicate mean ± s.e.m. k Deletion during primary GC followed by boosting and GC SCC. Clones are prescreened as IgG+. Number in circles represents the number of clones analyzed. Violin plots indicate distribution of VH mutations by Igh sequencing. (n = 11 Control (−); n = 4 Control (+); n = 9 DTR (−); n = 7, DTR (+)). l Schematic for deletion of Tfh-Full cells after boosting. Violin plots indicate distribution of VH mutations by Igh sequencing (n = 14 Control (−); n = 9 Control (+); n = 9 DTR (−); n = 3, DTR (+)). P values indicate unpaired two-tailed Student’s t test (c, d, h, i, j) or Mann–Whitney test (f, k, l).
Fig. 6
Fig. 6. In vivo progenitor capabilities of Tfh developmental stages.
a Diagram of experiment. CD4 T cells from naive OT-II+Tg (Il21cre)Rosa26Lox-STOP-Lox-TdTomatoIl21VFP were transferred to WT mice which were immunized with NP-OVA. On day 9 Tfh subsets were sorted and individually transferred to immunized Tcra-/- recipients. dLNs were harvested 12 days later. b Representative gating identifying Tfh developmental stages in transferred cells. Representative plots derive from concatenated replicates and are pregated on CD4+CXCR5+ cells. c Total numbers of Tfh cells (left) and frequency of VFP+ cells within Tfh cells (right). X-axis indicates the individual population that was transferred to each recipient mouse (n = 4 No Transfer, n = 7 Prog, n = 3 Trans, n = 4 Full, n = 3 Ex). Error bars indicate mean ± s.e.m. P value was calculated using unpaired two-tailed Student’s t test. d Gating strategy (left) and frequency (right) of GC B cells from transfer experiments as in (a). (n = 5 No Transfer, n = 7 Prog, n = 3 Trans, n = 4 Full, n = 3 Ex). Error bars indicate mean ± s.e.m. P value was calculated using unpaired two-tailed Student’s t test. e Gating strategy (left) and frequency (right) of plasmablast/plasma cells (PCs) from transfer experiments as in (a). (n = 5 No Trans, n = 7 Prog, n = 3 Trans, n = 4 Full, n = 3 Ex). Error bars indicate mean ± s.e.m. P value was calculated using unpaired two-tailed Student’s t test. Data are combined data from two separate experiments.
Fig. 7
Fig. 7. Foxp1 regulates Tfh developmental stage transitions.
a Schematic of Tfh-Prog to Tfh-Full transition assay. Control (Il21VFPFoxp1wt) or iFoxp1Δ (Il21VFPFoxp1fl/flUBCCreERT2) mice were immunized and tamoxifen given to start Foxp1 deletion. On day 7 Tfh-Prog (CD4+CXCR5+GITRnegVFPneg) cells were cultured with CD45.1+ bystander Tfh (CD4+CXCR5+GITRneg) and B (CD19+) cells for 4 days with anti-IgM and anti-CD3/CD28 beads. b Identification of de novo Tfh-Full cells by identifying CD4+VFP+ cells (left) and frequency of Tfh-full cells (right) n = 7 replicate cultures per group. Line indicates mean. Data are from one experiment and is representative of two independent experiments. P value was calculated using unpaired two-tailed Student’s t test. c IL-21 expression (left) and ICOS (right) levels on Tfh-full cells. Data are from one experiment and is representative of two independent experiments. n = 7 replicate cultures per group. Line indicates mean. P value was calculated using unpaired two-tailed Student’s t test. d Ex vivo transcriptional analysis of Tfh-Prog and Tfh-Full by bulk RNASeq. n = 4 replicates per group. DEGs = P < 0.05 by EdgeR. e Surface expression of Ly6a or IL4R on ex vivo TfhProg or TfhFull. n = 9 (Control) or n = 7 (DTR). P value was calculated using unpaired two-tailed Student’s t test. f Tfh-Full to Tfh-Ex transition assay. Control (Il21VFPFoxp1wt) or iFoxp1Δ (Il21VFPFoxp1fl/flUBCCreERT2) mice were immunized and tamoxifen given to delete FoxP1. On day 7 Tfh-Full (CD4+CXCR5+GITRnegVFP+) were cultured with CD45.1+ bystander Tfh (CD4+CXCR5+GITRneg) and B (CD19+) cells for 4 days. De novo Tfh-Ex cells were identified as CD4+VFP- cells. n = 10 replicate cultures per group. Data are concatenated data from two independent experiments. P value was calculated using unpaired two-tailed Student’s t test. g Schematic of Tfh developmental trajectories and individual functions of stages. h Deletion of Bcl6 in the Tfh-Full stage. F/ExΔBcl6 (Il21CreBcl6floxedRosaYFP) or control (Il21CreBcl6wtRosaYFP) mice were immunized and harvested on day 12. Tfh-Full/Ex (CD4+CXCR5+PD1+GITRnegYFP+) or Tfh-Prog (CD4+CXCR5+ PD1+GITRnegYFP-) were assessed. n = 6 (Control) or n = 10 (ΔBcl6). Data are concatenated from two independent experiments. P value was calculated using unpaired two-tailed Student’s t test. i Frequency of GC B cells from mice as in (h). P value was calculated using unpaired two-tailed Student’s t test.

References

    1. Vinuesa CG, Linterman MA, Yu D, MacLennan IC. Follicular helper T cells. Annu Rev. Immunol. 2016;34:335–368. doi: 10.1146/annurev-immunol-041015-055605. - DOI - PubMed
    1. Crotty S. T follicular helper cell biology: a decade of discovery and diseases. Immunity. 2019;50:1132–1148. doi: 10.1016/j.immuni.2019.04.011. - DOI - PMC - PubMed
    1. Wing, J. B., Lim, E. L. & Sakaguchi, S. Control of foreign Ag-specific Ab responses by Treg and Tfr. Immunol. Rev.296, 104–119 (2020). - PubMed
    1. Sage PT, Sharpe AH. The multifaceted functions of follicular regulatory T cells. Curr. Opin. Immunol. 2020;67:68–74. doi: 10.1016/j.coi.2020.10.009. - DOI - PMC - PubMed
    1. Cavazzoni CB, et al. Follicular T cells optimize the germinal center response to SARS-CoV-2 protein vaccination in mice. Cell Rep. 2022;38:110399. doi: 10.1016/j.celrep.2022.110399. - DOI - PMC - PubMed

Publication types

Associated data