. 2023 Nov 24;14(1):7693.
doi: 10.1038/s41467-023-43566-8.

Different spectral sensitivities of ON- and OFF-motion pathways enhance the detection of approaching color objects in Drosophila

Affiliations

Different spectral sensitivities of ON- and OFF-motion pathways enhance the detection of approaching color objects in Drosophila

Kit D Longden et al. Nat Commun. .

Abstract

Color and motion are used by many species to identify salient objects. They are processed largely independently, but color contributes to motion processing in humans, for example, enabling moving colored objects to be detected when their luminance matches the background. Here, we demonstrate an unexpected, additional contribution of color to motion vision in Drosophila. We show that behavioral ON-motion responses are more sensitive to UV than for OFF-motion, and we identify cellular pathways connecting UV-sensitive R7 photoreceptors to ON and OFF-motion-sensitive T4 and T5 cells, using neurogenetics and calcium imaging. Remarkably, this contribution of color circuitry to motion vision enhances the detection of approaching UV discs, but not green discs with the same chromatic contrast, and we show how this could generalize for systems with ON- and OFF-motion pathways. Our results provide a computational and circuit basis for how color enhances motion vision to favor the detection of saliently colored objects.


Conflict of interest statement

The authors declare no competing interests.

Figures

Fig. 1
Fig. 1. Color contributes to motion vision in Drosophila’s responses to expanding discs.
a Rhodopsin expression in pale and yellow ommatidia and ocelli in wild type flies (left) and in colorblind norpA36 Rh1-rescue flies (right); white indicates non-functional photoreceptors. b The behavioral setup, seen from above and behind. c Normalized sensitivity of photoreceptors adapted from and irradiance spectra of the UV and green projector LEDs. d Responses to expanding UV discs of different genotypes (diiii) for selected UV intensities illustrated above each panel column. Stimulus time course shown above panel for UV = 9. Note that in many controls the flies initially turn towards the disc for UV = 0, and have a slightly lower response at the time of virtual impact than for UV = 2. For all rows, N = 10 flies, mean ±SEM shown. di Colorblind norpA36 Rh1-rescue flies with norpA expression rescued in R1-6. dii Colorsighted norpA36 Rh1-rescue control flies with heterozygous expression of norpA in R1-8 and ocelli. diii Enhancerless split GAL4 control (ES > DL). Mean responses for a single fly shown in purple. e Responses for each UV intensity presented, for flies in (d), mean ± SEM shown, N = 10 flies. ei. Colorblind norpA36 Rh1-rescue flies. eii. Colorsighted norpA36 Rh1-rescue controls. eiii. Enhancerless split GAL4 control (ES > DL). For all panels, responses are measured as the mean response in the 100 ms after the disc has fully expanded, indicated by the gray stripe in the stimulus diagram inset (above UV = 9 column in d). Two-sided student’s t-test was used to identify responses significantly different from zero, with FDR correction for 11 comparisons. Asterisks indicate significance level: *p < 0.05, **p < 0.01, ***p < 0.001, n.s. not significant. Adjusted p-values, left-to-right: ei 8e-5, 2e-4, 0.52, 0.017, 0.24, 0.078, 0.014, 0.015, 8e-3, 0.019, 8e-3; eii) 3e-4, 8e-5, 1e-4, 2e-3, 4e-4, 1e-3, 8e-5, 9e-5, 8e-5, 8e-5, 8e-5; eiii) 7e-4, 9e-6, 4e-4, 1e-4, 3e-3, 4e-3, 4e-4, 4e-5, 5e-6, 3e-6, 6e-8. Genotypes for all flies used in behavioral experiments listed in Table 1. Source data are provided as a Source Data file.
Fig. 2
Fig. 2. Behavioral responses to ON- and OFF-motion differ in their sensitivity to UV.
a Diagrams of competing motion stimuli. The display was divided into 8 windows of 30° azimuth each, and diagrams illustrate sample frames of the stimuli within each window for the times indicated at the bottom. Top row shows the green channel component, middle row the UV component, and the bottom row the summation of the two that were the stimuli presented to the flies. Each stimulus cycle lasted 250 ms (4 Hz) and was shown for 2 s. b Turning responses of flies of our primary data genotype, ES > DL, to competing ON- (purple) and OFF-motion (black). Time traces are shown for selected UV intensities indicated in purple above every panel. NON = 10 flies, NOFF = 10 flies, mean ± SEM responses shown. Data from the same flies are plotted in panels (df). c Example isoluminance calculation, for a single fly’s response to competing ON-motion, mean ± SEM responses over the 2 s of the stimulus shown (N = 1 fly, n = 5 trials). The isoluminance level is the lowest UV intensity when the response is greater than zero, using linear interpolation between stimulus intensities. d Isoluminance levels of populations of flies for competing ON- and OFF-motion, compared using a two-sided two-sample student’s t-test, ***indicates p < 0.001, p = 7e-9, NON = 10 flies, NOFF = 10 flies. Boxplots indicate the median and quartile ranges, and whiskers indicate the extent of data points within an additional 1.5 × quartile range, conventions used for the boxplots in all figures. e Response of all flies to competing ON-motion, NON = 10 flies, mean ± SEM shown. The isoluminance level of the mean response is indicated by the vertical line. f Response of all flies to competing OFF-motion, NOFF = 10 flies, mean ± SEM shown. The isoluminance level of the mean response is indicated by the vertical line. g Isoluminance levels of Drosophila species, for competing ON- and OFF-motion, where both isoluminance levels were measured in the same flies using a compact protocol in which the UV intensity was restricted to the range 3−9. We used a two-sided Wilcoxon signed-rank test to compare the isoluminance levels for competing ON- and OFF-motion, **indicates p < 0.01, N = 10 flies for all species. P-values: D. melanogaster p = 0.002; D. mauritiana p = 0.002; D. sechellia p = 0.002; D. santomea p = 0.002; D. yakuba p = 0.002; D. teissieri p = 0.002. Boxplot conventions as in panel (d). Genotypes of flies used in behavioral experiments listed in Table 1. Source data are provided as a Source Data file.
Fig. 3
Fig. 3. R7-8 photoreceptors support ON-motion UV-sensitivity.
For all panels, boxplot conventions are as in Fig. 2d, and asterisks indicate significance level: *p < 0.05, **p < 0.01, ***p < 0.001, n.s. not significant. a Differences between IOFF and ION of homozygous norpA36 flies with the function of different combinations of photoreceptors rescued using rhodopsin-GAL4 driven expression of UAS-norpA, and genetic controls. IOFF and ION were measured in the same flies using the compact protocol with the UV intensity restricted to the range 3−9. We tested whether IOFF and ION come from the same distribution using a two-sided paired Wilcoxon signed rank test, for rescued photoreceptor genotypes (colored boxplots) with FDR correction for 10 comparisons, N = 10 flies (adjusted p-values, left-to-right: 0.2, 9.8e-3, 9.8e-3, 9.8-e3, 9.8e-3, 0.03, 0.9, 0.08, 0.2, 0.2), for controls (gray boxplots) with FDR correction for 11 comparisons, N = 10 flies (adjusted p-values, left-to-right: 2e-3, 2e-3, 2e-3, 2e-3, 2e-3, 2e-3, 2e-3, 4e-3, 2e-3, 2e-3, 2e-3), and for comparisons of rescue genotypes and controls with FDR correction for 10 comparisons, N = 10 flies (adjusted p-values, left-to-right: 8e-4, 8e-4, 7e-3, 0.02, 0.5, 0.3, 8e-4, 0.03, 0.02, 2e-3). b IOFF and ION for Rh1-GAL4 rescue of norpA in R1-6 photoreceptors; pairwise comparisons between IOFF and ION shown in panel (a). To compare IOFF and ION within genotypes, we used two-sided paired Wilcoxon signed rank test, N = 10 flies (Rh1 rescue p = 0.1, control p = 2e-3). To compare IOFF or ION between rescue and control genotypes, we used two-sided two-sample Wilcoxon rank sum tests, N = 10 flies (ION p = 2e-4, IOFF p = 0.1). c Differences between IOFF and ION with specific photoreceptor classes silenced using rhodopsin-GAL4 driven expression of UAS-shibirets1 (colored boxplots), and no-effector controls (black and gray boxplots); for the ocelli, we painted them black in ES > DL flies. We used two-sided paired Wilcoxon signed rank test to compare IOFF and ION within photoreceptor silenced genotypes, with FDR correction for 6 comparisons, N = 10 flies (adjusted p-values: EG > shi, 2e-3; Rh3 > shi, 2e-3; Rh4 > shi, 6e-3; Rh5 > shi, 2e-3; Rh6 > shi, 2e-3; ocelli painted, 2e-3), and within no-effector controls, with FDR correction for 6 comparisons, N = 10 flies (adjusted p-values: EG > DL, 3e-3; Rh3 > DL, 3e-3; Rh4 > DL, 3e-3; Rh5 > DL, 4e-3; Rh6 > DL, 4e-3; ocelli not painted, 3e-3). To compare IOFF - ION between photoreceptor silenced genotypes and genetic controls (EG > shi), we used two-sided Wilcoxon rank sum tests, with FDR correction for 4 comparisons, N = 10 flies (adjusted p-values: Rh3, 0.2; Rh4, 0.3; Rh5, 0.07; Rh6, 0.5). To compare IOFF - ION between EG > DL temperature controls, we used two-sided two-sample Wilcoxon rank sum tests, with FDR correction for 5 comparisons, N = 10 flies (adjusted p-values: EG > DL 30 °C vs 32 °C, 0.04; 21 °C vs 32 °C, 0.04; 26.5 °C vs 30 °C, 0.9; 26.5 °C vs 21 °C, 0.97; 21 °C vs room temperature, 0.7). Finally, we used two-sided Wilcoxon rank sum tests to compare IOFF - ION between genetic (EG > shi) and no-effector (EG > DL) controls at the restrictive temperature of 32 °C (p = 0.5), and between painted and unpainted ocelli (p = 0.5). IOFF and ION for all genotypes are shown in Supplementary Fig. 3. Genotypes for all flies used in behavioral experiments are listed in Table 1. Source data are provided as a Source Data file.
Fig. 4
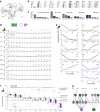
Fig. 4. The ON- and OFF-motion directionally selective T4 and T5 cells differ in their sensitivity to UV.
a Imaging setup. b Anatomical diagram of T4 (purple) and T5 cells (green). c Example recording of T4 cells. Image (top left) shows mean fluorescence for one fly for expanding UV discs, UV = 15. Identified ROIs of columnar units are outlined and numbered, with corresponding ΔF/F0 responses, mean ± S.D. shown (n = 5 trials). Responses to unidirectional green edge ON (purple) and OFF-motion (black) stimuli are shown in polar plots below. Some but not all ROIs are directional and so ROIs likely represent multiple cells. d Example recording of T5 cells, organized as in panel (c), except UV = 0 in the top panels, and responses to directional green edge OFF (green) and ON-motion (black) stimuli in polar plots below, mean ± S.D shown (n = 5 trials). e Calcium activity responses of T5 (ei) and T4 (eii) ROIs to UV discs expanding from a green background, mean ± SEM shown. Stimulus time course shown above panel for UV = 6. Traces are colored during the stimulus and then switch to gray so that stimulus offset responses can be identified. ROIs averaged for each fly: NT4, Flies = 18, NT4, ROI = 46; NT5, Flies = 14, NT5, ROI = 34. f Responses of T5 ROIs (fi) and T4 ROIs (fii) in the 150 ms after the disc has expanded (indicated by gray vertical stripes in panel e), mean ± SEM shown. Colored lines indicate population isoluminance of T4 (fii, purple) and T5 (fi green, and for comparison fii pale green) ROIs. We used two-sided student’s t-test to identify responses significantly different from zero, with FDR correction for 16 comparisons. Asterisks indicate significance level: *p < 0.05, **p < 0.01, ***p < 0.001, n.s. not significant. NT4, Flies = 18, NT4, ROI = 46; NT5, Flies = 14, NT5, ROI = 34. Adjusted p-values: T5, left-to-right: 2e-8, 3e-9, 9e-10, 9e-10, 3e-9, 7e-7, 5e-3, 0.5, 0.7, 0.2, 0.5, 0.07, 3e-3, 0.1, 0.02, 0.01; T4, left-to-right: 0.01, 0.03, 0.3, 0.6, 0.6, 0.6, 0.07, 8e-3, 1e-5, 1e-7, 7e-10, 7e-10, 9e-12, 1e-9, 9e-12, 9e-12. g Calculation of isoluminance level for single example T4 (top) and T5 (bottom) ROI, mean ±SEM shown, NFlies = 1, NROI = 1, n = 5 trials. h T4 and T5 isoluminance levels for ROIs (gray dots) and flies (color dots); example ROIs in panel (g) are gray dots inside a circle. Colored horizontal lines indicate mean ROI isoluminance levels. The isoluminance levels of T4 ROIs were significantly lower than those of T5 ROIs (p = 9e-4, two-sided two-sample t-test, NT4, flies = 18, NT5, flies = 14; power = 0.94), asterisks indicate significance level: ***p < 0.001, boxplot conventions as in Fig. 2d. i We used a threshold to identify unresponsive ROIs for each cell type: values used are indicated by vertical gray lines. Horizontal dashed line shows mean isoluminance calculated with this threshold. Colored lines and shading indicate ROI isoluminance level, mean ±SEM shown, as the threshold is varied. Black lines indicate number of flies with ROIs above the threshold. Genotypes for all flies used in imaging experiments are in Table 2. Source data are provided as a Source Data file. Diagram adapted from: Fischbach, K.-F. & Dittrich, A. P. M. The optic lobe of Drosophila melanogaster. I. A Golgi analysis of wild-type structure. Cell Tissue Res. 258, 441–475 (1989).
Fig. 5
Fig. 5. Cells presynaptic to T4 have divergent UV-sensitivity consistent with their lamina inputs.
a Schematic diagram of imaged cell types. Cell types are color-coded by their isoluminance level (shown in panel f): green indicates an isoluminance level > T5, purple indicates an isoluminance <T4, and gray in-between levels. This color scheme is used throughout the figure. b Examples of ROIs of recorded cell types, scale bar applies to all images. c Mean number of synaptic inputs to T4 cells from imaged cell types, and of imaged cell types to medulla T4 input cells. d Responses of recorded cell types to expanding UV discs, with the stimulus time course shown above UV = 5. The stimulus starts at t = 0, the vertical gray line indicates the end of the disc’s expansion (t = 1), whereupon the whole screen remains illuminated by UV for 1 further second (t = 2), and then the screen returns to green, indicated by traces turning to gray. Mean ± SEM shown, calculated over flies. NL1,flies = 10, NL1,ROI = 40; NL2,flies = 10, NL2,ROI = 39; NL3,flies = 9, NL3,ROI = 25; NL4,flies = 10, NL4,ROI = 35; NL5,flies = 10, NL5,ROI = 30; NC3,flies = 9, NC3,ROI = 23; NMi1,flies = 10, NMi1,ROI = 36; NTm3,flies = 10, NTm3,ROI = 37; NMi4,flies = 9, NMi4,ROI = 22; NMi9,flies = 9, NMi9,ROI = 41; NDm9,flies = 9, NDm9,ROI = 26; 2-7 ROIs per fly, across cell types. e Responses calculated in the 170 ms (two imaging frames) after the disc has expanded (vertical gray line in panels at t = 1 in panel d), mean ± SEM over flies shown. For Dm9, we used responses in the 170 ms after the screen has been fully illuminated by UV for 1 s, because the calcium dynamics of these cells were slower than the other cell types recorded. We used two-sided two-sample t-tests to compare responses between cell types, with FDR correction for 16 comparisons. Numbers of flies and ROIs as in panel (d). Adjusted p-values: L1 vs L2 for UV = 0–7, left-to-right: 0.9, 0.7, 0.3, 0.7, 0.3, 0.3, 0.3, 0.5; L1 vs L3 for UV = 0-6: 0.3, 0.05, 4e-4, 1e-4, 0.05, 0.01, 0.2, 0.2; L2 vs L4 for UV = 0-7: 0.1, 0.2, 0.95, 0.95, 0.95, 0.9, 0.95, 0.5; L5 vs C3 for UV = 9–15: 0.8, 0.8, 0.7, 0.97, 0.7, 0.7, 0.7; L5 vs Mi1 for UV = 8-15: 3e-3, 0.05, 0.02, 0.05, 3e-3, 0.2, 0.08, 0.2; Tm3 vs Mi1for UV = 7–15: 0.96, 0.8, 0.96, 0.8, 0.8, 0.8, 0.8, 0.6, 0.6; Mi4 vs L5 for UV = 8–15: 0.5, 0.6, 0.6, 0.4, 0.6, 0.4, 0.6, 0.6; Mi9 vs L3 for UV = 0–5: 0.97, 0.97, 0.97, 0.97, 0.97, 0.97. f Isoluminance levels of individual ROIs (small dots), averaged within each fly (large dots). Boxplot conventions are as in Fig. 2d. Horizontal lines indicate mean ROI isoluminance levels of T4 and T5. We tested the hypothesis that the isoluminance levels of pairs of cell types came from the same distribution using two-sided two-sample t-tests, with FDR correction for 30 comparisons. Numbers of flies and ROIs as in panel (d). Adjusted p-values, for comparisons ordered left-to-right: L5 vs C3 0.8, L5 vs Mi4 0.2, L5 vs L4 1e-5, L5 vs L1 3e-6, L5 vs Tm3 1e-7, L5 vs Mi1 1e-4, L5 vs L2 2e-6, L5 vs T4 1e-7, L5 vs L3 4e-7; Mi4 vs T5 0.07, Mi4 vs T4 9e-5; T5 vs Tm3 0.01, T5 vs Mi1 0.2, T5 vs L3 5e-4, T5 vs Mi9 3e-4; L4 vs L1 0.9, L4 vs L2 0.07, L4 vs L3 7e-4; L1 vs Tm3 9e-3, L1 vs Mi1 0.5, L1 vs L2 0.07, L1 vs L3 6e-4; Tm3 vs Mi1 0.3, Tm3 vs T4 0.5; Mi1 vs T4 0.1; L2 vs L3 0.05; T4 vs L3 0.2, T4 vs Mi9 0.07; L3 vs Mi9 0.5; Mi9 vs Dm9 6e-3. g Diagram of connectivity, between imaged cell types with cells not imaged in black with dotted lines. Lateral connections within lamina and medulla are not indicated. Genotypes for all flies used in imaging experiments are in Table 2. For all panels, asterisks indicate significance level: *p < 0.05, **p < 0.01, ***p < 0.001, n.s. not significant. Source data are provided as a Source Data file. Diagram adapted from ref. : Fischbach, K.-F. & Dittrich, A. P. M. The optic lobe of Drosophila melanogaster. I. A Golgi analysis of wild-type structure. Cell Tissue Res. 258, 441–475 (1989).
Fig. 6
Fig. 6. Effects of neuronal cell type silencing on the UV-sensitivity of behavioral responses to ON- and OFF-motion.
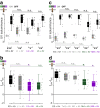
a Isoluminance levels for competing ON-motion (ION, gray) and OFF-motion (IOFF, black) for flies with LMC cell types L1, L3 and L5 silenced through expression of Kir2.1 and genetic controls (ES > Kir), measured in the replica setup using the compact protocol with the UV intensity restricted to the range 3-9. Cell type labels are color-coded as in Fig. 5: green indicates an isoluminance level > T5, purple indicates an isoluminance <T4, and gray in-between. We used one-sided Wilcoxon rank sum test to compare whether ION were greater than controls, or IOFF less than controls, with FDR correction for 3 comparisons and N = 10 flies, except N = 13 flies for ES > Kir (adjusted p-values for ION: L1 > Kir 3e-3, L3 > Kir 2e-3, L5 > Kir 2e-3; for IOFF: L1 > Kir 0.8, L3 > Kir 0.4, L5 > Kir 0.8). We used two-sided paired Wilcoxon signed rank test to compare ION and IOFF within genotypes, N = 10 flies, except N = 13 flies for ES > Kir (p-values: ES > Kir 5e-4; L1 > Kir 9.8e-3; L3 > Kir 0.01; L5 > Kir 2e-3). b Pairwise differences between IOFF and IOFN of flies shown in panel (a). We used one-sided Wilcoxon rank sum test to compare whether IOFF – ION were less than controls, with FDR correction for 3 comparisons and N = 10 flies, except N = 13 flies for ES > Kir (adjusted p-values: L1 > Kir 0.1, L3 > Kir 0.04, L5 > Kir 0.05). c IOFF and IOFN for flies with T4 input cell types Mi1, Tm3, Mi4 and Mi9 silenced through expression of Kir2.1 and genetic controls (ES > Kir) in the original setup. Statistical comparisons are as in panel (a), with FDR correction for 4 comparisons for IOFF and ION, and N = 10 flies for all genotypes (adjusted p-values for ION: Tm3 > Kir 0.02, Mi1 > Kir 0.02, Mi4 > Kir 0.2, Mi9 > Kir 0.03; for IOFF: Tm3 > Kir 0.8, Mi1 > Kir 0.8, Mi4 > Kir 0.06, Mi9 > Kir 0.1; within genotype comparison p-values: ES > Kir 2e-3; Tm3 > Kir 2e-3; Mi1 > Kir 2e-3; Mi4 > Kir 2e-3; Mi9 > Kir 2e-3). d Pairwise differences between IOFF and ION of flies shown in panel (c). Statistical comparisons are as in panel (b), with FDR correction for 4 comparisons and N = 10 flies (adjusted p-values: Tm3 > Kir 0.09, Mi1 > Kir 0.09, Mi4 > Kir 0.02, Mi9 > Kir 0.01). Genotypes for all flies used in behavioral experiments are listed in Table 1. For all panels, asterisks indicate significance level: *p < 0.05, **p < 0.01, ***p < 0.01, n.s. not significant, and boxplot conventions are as in Fig. 2d. Source data are provided as a Source Data file.
Fig. 7
Fig. 7. Behavioral responses to UV-Green and Green-UV edges are asymmetric.
a Illustration of how a difference in UV-sensitivity of behavioral responses to ON- and OFF-motion enables the detection of isoluminant UV discs expanding on a green background. b Our hypothesis predicts a lack of responses to a green disc expanding on an isoluminant UV background. c Turning responses to a green disc expanding on a UV background. The timing of the stimulus is as for UV discs and shown above the UV = 7 panel. For all genotypes, mean ± SEM shown, N = 10 flies. ci Wild type DL no-effector controls for silencing of T4 and T5 cells. In the panel for UV = 7, the purple arrow indicates the flies turning towards the side the disc appeared from after it has expanded. cii Colorblind norpA36 flies with the function of R1-6 photoreceptors rescued through Rh1-GAL4 expression of UAS-norpA (top) and a genetic control (bottom). ciii Responses of flies with T4 and T5 cells silenced through expression of Kir2.1. d Responses for all UV intensities measured in the 100 ms after the disc has fully expanded (the vertical gray stripe in panel (ci) for UV = 7). For all rows, mean ± SEM shown. di Responses of T4 + T5 > DL no-effector controls for silencing of T4 and T5 cells, and ES > Kir2.1 controls for the expression of Kir2.1. We used a one-sided student’s t-test to identify responses significantly greater than zero, with FDR correction for 11 comparisons, N = 10 flies for both genotypes (adjusted p-values for T4 T5 > DL, left-to-right: 6e-4, 0.9, 0.7, 0.08, 0.96, 0.9, 0.2, 0.9, 0.4, 0.08, 0.09; for ES > Kir, left-to-right: 1e-4, 2e-4, 0.7, 0.999, 0.999, 0.999, 0.1, 0.1, 0.01, 2e-4, 2e-5). dii Colorblind Rh1 rescue flies and genetic control. We used a one-sided student’s t-test to identify responses significantly greater than zero, with FDR correction for 11 comparisons, N = 10 flies for both genotypes (adjusted p-values for Rh1 rescue flies, left-to-right: 8e-5, 1e-4, 7e-4, 8e-4, 0.08, 0.4, 0.1, 0.08, 0.08, 4e-4, 3e-3; Rh1 rescue control left-to-right: 2e-3, 4e-3, 0.1, 0.3, 0.9, 0.99, 0.5 0.1, 0.06, 9e-4, 2e-3). To identify when colorblind fly responses were greater than controls, we used a one-sided two-sample t-test, with FDR correction for 11 comparisons, N = 10 flies for both genotypes (adjusted p-values, left-to-right: 0.03, 0.01, 0.02, 0.02, 0.07, 0.07, 0.2, 0.3, 0.4, 0.5, 0.8). diii Flies with T4 and T5 cells silenced through expression of Kir2.1. Statistical test as in panel (di), N = 10 flies (adjusted p-values, left-to-right: 0.3, 0.3, 0.2, 0.2, 0.3, 0.3, 0.2, 0.3, 0.2, 0.2, 0.2). Genotypes for all flies used in behavioral experiments are in Table 1. Asterisks indicate significance level: *p < 0.05, **p < 0.01, ***p < 0.001, n.s. not significant. Source data are provided as a Source Data file.
Fig. 8
Fig. 8. Enhanced motion detection for approaching objects of selected colors.
a Photograph of an orange in its tree (Citrus sp.), with pixels sampled in a hexagonal lattice illustrative of a fly’s eye. Arrows indicate direction of motion for approaching (left) and receding (right) from the fruit. b Motion was estimated in four directions using the Weber contrast and hexagonal pixels grouped as indicated by pale and dark gray; the approaching or receding motion was calculated from the vector sum of these four directions (see Methods). c Estimated combined ON- and OFF-motion (ON + OFF) centered at every hexagonal pixel, with pixels rank ordered, for approaching (blue) and receding (brown) from the fruit, with different combinations of R, G and B intensity values contributing to the estimation of ON- and OFF-motion. ci ON- and OFF-motion (ONRGB + OFFRGB) calculated from mean of [R, G, B]. We used two-sided Wilcoxon rank sum test to compare the estimated motion contrast across hexagonal pixels for approaching versus for receding (Npix = 163 hexagonal pixels). The estimated motion for approaching and receding is not significantly different (p = 0.3). cii Red, R, intensity values were used to calculate ON-motion and blue, B, intensity for OFF-motion (ONR + OFFB). The estimated motion for approaching is significantly greater than for receding (two-sided Wilcoxon rank sum test, Npix = 163, p = 7e-6). For comparison, approaching motion calculated using ONRGB + OFFRGB from panel (ci) is also shown (pale blue). ciii B intensity values were used to calculate ON-motion and R intensity for OFF-motion (ONB + OFFR). The estimated motion for approaching is significantly less than for receding (two-sided Wilcoxon rank sum test, Npix = 163, p = 2e-10). d Comparisons of motion estimates in (c). di Difference between (ONR + OFFB) and (ONRGB + OFFRGB) estimates. We used two-sided Wilcoxon rank sum test to compare between estimated motion contrast for approaching and for receding (Npix = 163), and, as predicted, changing ON-motion sensitivity to red and OFF-motion sensitivity to blue increased the approaching motion (p = 5e-4), and decreased the receding motion (p = 6e-3). dii Difference between (ONB + OFFR) and (ONRGB + OFFRGB) estimates. Changing ON-motion sensitivity to blue and OFF-motion sensitivity to red decreased the approaching motion (two-sided Wilcoxon rank sum test, Npix = 163, p = 2e-3), and increased the receding motion (two-sided Wilcoxon rank sum test, Npix = 163, p = 1e-3). For all panels, *** indicates p < 0.001, ** indicates p < 0.01, and n.s. indicates not significant. Source data are provided as a Source Data file.

References

    1. Wilkins L, Osorio D. Object colours, material properties and animal signals. J. Exp. Biol. 2019;222:jeb204487. doi: 10.1242/jeb.204487. - DOI - PubMed
    1. Spelke ES. Principles of object perception. Cognitive Sci. 1990;14:29–56. doi: 10.1207/s15516709cog1401_3. - DOI
    1. Conway BR. Color signals through dorsal and ventral visual pathways. Vis. Neurosci. 2014;31:197–209. doi: 10.1017/S0952523813000382. - DOI - PMC - PubMed
    1. Goodale MA, Milner AD. Separate visual pathways for perception and action. Trends Neurosci. 1992;15:20–25. doi: 10.1016/0166-2236(92)90344-8. - DOI - PubMed
    1. Cavanagh P, Anstis S. The contribution of color to motion in normal and color-deficient observers. Vis. Res. 1991;31:2109–2148. doi: 10.1016/0042-6989(91)90169-6. - DOI - PubMed

Publication types

LinkOut - more resources