. 2023 Nov 24;14(1):7709.
doi: 10.1038/s41467-023-43462-1.

Low-dose radiotherapy combined with dual PD-L1 and VEGFA blockade elicits antitumor response in hepatocellular carcinoma mediated by activated intratumoral CD8+ exhausted-like T cells

Affiliations

Low-dose radiotherapy combined with dual PD-L1 and VEGFA blockade elicits antitumor response in hepatocellular carcinoma mediated by activated intratumoral CD8+ exhausted-like T cells

Siqi Li et al. Nat Commun. .

Abstract

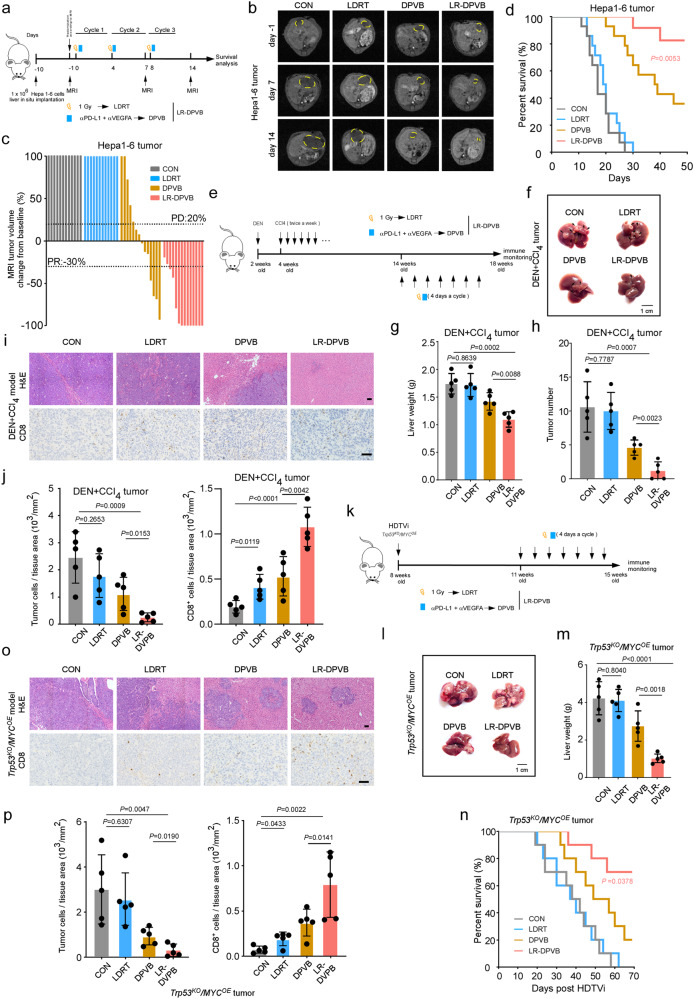
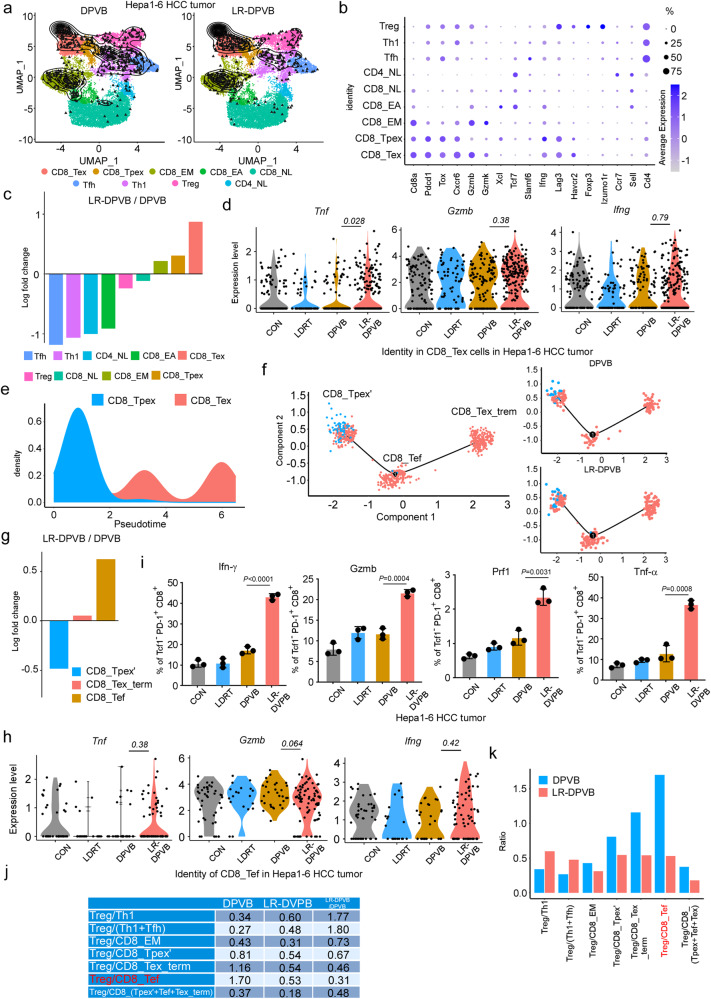
Atezolizumab (anti-PD-L1) combined with bevacizumab (anti-VEGFA) is the first-line immunotherapy for advanced hepatocellular carcinoma (HCC), but the number of patients who benefit from this regimen remains limited. Here, we combine dual PD-L1 and VEGFA blockade (DPVB) with low-dose radiotherapy (LDRT), which rapidly inflames tumors, rendering them vulnerable to immunotherapy. The combinatorial therapy exhibits superior antitumor efficacy mediated by CD8+ T cells in various preclinical HCC models. Treatment efficacy relies upon mobilizing exhausted-like CD8+ T cells (CD8+ Tex) with effector function and cytolytic capacity. Mechanistically, LDRT sensitizes tumors to DPVB by recruiting stem-like CD8+ Tpex, the progenitor exhausted CD8+ T cells, from draining lymph nodes (dLNs) into the tumor via the CXCL10/CXCR3 axis. Together, these results further support the rationale for combining LDRT with atezolizumab and bevacizumab, and its clinical translation.


Conflict of interest statement

The authors declare no competing interests.

Figures

Fig. 1
Fig. 1. Combined LDRT and DPVB (LR-DPVB) confers tumor responsiveness.
a Schematic illustration of the in vivo study evaluating different regimes in Hepa1-6 HCC model. b Representative images of Hepa1-6 HCC model liver MRI scanning. c Waterfall plot of the percentage change of the tumor volume for Hepa1-6 HCC model with different treatments. n = 14 mice/group. d Kaplan–Meier curve of Hepa1-6 HCC model mice treated with 4 different regimes (n = 14 mice/group). e Schematic illustration of the in vivo study evaluating different regimes in DEN + CCI4 HCC model. f Representative image of DEN + CCI4 HCC model. g The liver weight of DEN + CCI4 HCC model. h The tumor number of DEN + CCI4 HCC model. i H&E staining for livers from DEN+CCl4 HCC model (top), representative images (bottom) of CD8 IHC staining in sections of tumor tissue in indicated groups. Scale bars: 50 µm. j Quantification of tumor cells (X103) / tissue area (mm2) and CD8+ T cells (left) and CD8+ T cells (X103) / tissue area (mm2) (right) of sections in indicated groups of DEN+CCl4 tumors. k Schematic illustration of the in vivo study evaluating different regimes in Trp53KO/MYCOE HCC model. l Representative image of Trp53KO/MYCOE HCC model. m The liver weight of Trp53KO/MYCOE HCC model. n Kaplan–Meier curve of Trp53KO/MYCOE HCC model (n = 10 mice/group). o H&E staining for livers from Trp53KO/MYCOE HCC model (top), representative images (bottom) of CD8 IHC staining in sections of tumor tissue in indicated groups. Scale bars: 50 µm. p Quantification of tumor cells (X103) / tissue area (mm2) (left) and CD8+ T cells (X103) / tissue area (mm2) (right) of sections in indicated groups of Trp53KO/MYCOE tumors. Data shown as means ± SD. gh, j, lm and p, n = 5 mice/group. P values of d and n were determined by log-rank test (Mantel-Cox). P values of g, h, j and p were calculated using a two-sided unpaired Student’s t test. Source data are provided as a Source Data file.
Fig. 2
Fig. 2. The antitumor effect of LR-DPVB is mediated by CD8+ T cells.
a, b tSNE maps of scRNAseq data from TIICs of Hepa1-6 HCC tumors (n = 3 mice/ group). c Fold-change of TIICs populations from LR-DPVB and CON in Hepa1-6 HCC tumors. n = 3 mice/group. d Representative flow cytometry plots of % CD4+ and % CD8+ in CD45+ cells of Hepa1-6 HCC tumor TIICs. e Percentage quantification (left panel) of % CD4+ and % CD8+ in CD45+ cells and immune cell count/tumor weight (right panel) in Hepa1-6 HCC tumor TIICs. n = 3 mice/group. f, g Representative images f and quantification g of CD8 IHC staining in serial sections of Hepa1-6 HCC tumor tissue in indicated groups. Scale bars: 500 µm. n = 5 mice/group. h tSNE maps of scRNAseq data from CD45+ TIICs of DEN + CCI4 HCC tumors (n = 3 per group). i Fold-change of CD45+ TIICs populations from LR-DPVB and CON groups in DEN + CCI4 HCC tumors. n = 3 mice/group. j Representative flow cytometry plots of % CD4+ and % CD8+ in CD45+ cells in DEN + CCI4 HCC tumor TIICs. k Percentage quantification (left panel) of % CD4+ and % CD8+ in CD45+ cells and immune cell count/liver weight (right panel) in DEN + CCI4 HCC tumor TIICs. n = 3 mice/group. l Representative flow cytometry plots of % CD4+ and % CD8+ in CD45+ cells in Trp53KO/MYCOE HCC TIICs at the end of the therapeutic cycle. m Percentage quantification (left panel) of % CD4+ and % CD8+ in CD45+ cells and immune cell count/liver weight in Trp53KO/MYCOE HCC TIICs. n = 3 mice/group. Data of e, k and m shown as means ± SD derived from tumor mouse models (n = 3 mice/group). Data of g shown as means ± SD derived from tumor mouse models (n = 5 mice/group). P values of e, g, k and m were calculated using a two-sided unpaired Student’s t test. Source data are provided as a Source Data file.
Fig. 3
Fig. 3. LR-DPVB expands antitumor CD8+ Tex exhibiting states of effector function and cytolytic capacity in Hepa1-6 tumors.
a UMAP plots of T cells scRNA-seq data (n = 3 per treatment, collected at the end of therapeutic cycle 2). Left and right: contour plots reveal cell density of indicated groups. Using the ProjecTILs method, T cells were subdivided into CD8_Tex, CD8_Tpex, CD8_ effector memory (CD8_EM), CD8_ early activated (CD8_EA), CD8_ naïve like (CD8_NL), CD4_ naïve like (CD4_NL), Treg, T helper 1 (Th1) and T follicular helper (Tfh). b Hepa1-6 HCC tumors T cells expressing indicated genes across major cell subsets and their corresponding average expression. c Fold-change of T cell subsets of Hepa1-6 HCC tumors following LR-DPVB vs DPVB. d Violin plots representing the expression of various effected function and cytotoxicity markers in CD8_Tex cell subsets of Hepa1-6 HCC tumors with indicated treatment. e Density profiles show the distribution of CD8_Tex and CD8_Tpex of Hepa1-6 HCC tumors along the pseudotime trajectory. f Pseudotime trajectory analysis of CD8_Tpex and CD8_Tex clusters was performed by the Monocle tool. Left: Reference trajectory map of Hepa1-6 HCC tumor in all groups; right: pseudotime trajectory maps of indicated groups. g Fold-change of exhausted CD8_T cell subsets in Hepa1-6 HCC tumors following LR-DPVB vs DPVB. h Violin plots representing the expression of various effected function and cytotoxicity markers in CD8_Tef cell subsets of Hepa1-6 HCC tumors with indicated treatment. i Quantification of flow cytometry plots of % Prf1+, % Gzmb+, % Tnf-α+ and % Ifn-γ+ in TCF1+ PD-1+ CD8+ T cells in Hepa1-6 HCC tumors of the indicated groups. n = 3 per group. P values were calculated using a two-sided unpaired Student’s t test. j, k Table j and histogram k describes Treg: CD8 or CD4 ratios in Hepa1-6 HCC tumors of LR-DPVB and DPVB groups. Data shown as means ± SD derived from tumor mouse models (n = 3 mice/group). Source data are provided as a Source Data file.
Fig. 4
Fig. 4. The stem-like CD8+ Tpex enriched by LDRT expanded the antitumor effect of DPVB.
a Fold-change of T cell subsets following LDRT vs CON in Hepa1-6 tumors. n = 3 mice/group. b Representative flow cytometry plots (left panel) and quantification (right panel) of % TCF1+ PD-1+ in CD8+ T cells of the indicated groups. n = 3 samples/group. c, d Illustration of the in vivo adoptive transfer experiment, as described above in methods. n = 3 mice/group. e Representative image of Hepa1-6 liver orthotopic tumors at the end of the second therapeutic cycles (circled by yellow lines). n = 3 mice/group. f Representative flow cytometry plots of % Gzmb+ in CD8+ T cells (upper panel) and TUNEL assay (lower panel) of the indicated groups. n = 3 samples/group. Scale bars: 100 µm. g Quantification of % Gzmb+ in CD8+ T cells (left panel) and (%) apoptosis cells (right panel) of the indicated groups. n = 3 samples/group. h Tumor growth curves of Hepa1-6 bearing mice of the indicated days. n = 5 mice/group. P values were calculated using One-way repeated-measures ANOVA test. Data shown as means ± SD. i Graphical abstract of PDTF collection, culture and treatment strategy. j Flow cytometry assays (left panel) and histopathological analysis (H&E staining and TUNEL assay, right panel) of the PDTFs after 48 h of ex vivo T + A therapy. n = 3 samples/group. Scale bars: 100 µm. k Quantification of % TCF1+ PD-1+ CD8+ in CD8+ T cells (left panel) and (%) apoptosis cells (right panel) of the indicated groups (n = 3 samples/group). P values of b, g and k were calculated using a two-sided unpaired Student’s t test. Data of b and g shown as means ± SD derived from tumor mouse models (n = 3 mice/group). Source data are provided as a Source Data file.
Fig. 5
Fig. 5. Intratumoral infiltration of stem-like CD8+ Tpex from dLNs after LDRT through the CXCL10/CXCR3 axis.
a Bubble chart of DEG pathway enrichment of TILs in LDRT and CON groups. b Anatomical view of mouse liver dLNs (left panel, Scale bars: 1 mm) and H&E staining (right panel, Scale bars: 100 µm) of the dLNs sections (n = 3 mice/group). c Representative flow cytometry plots (left panel) and quantification (right panel) of % TCF1+ PD-1+ in CD8+ T cells and % Ki-67 in TCF1+ PD-1+ CD8+ T cells in dLNs of the indicated groups. d Schematic illustration of peripheral drainage of lymphoid tissues blockade experiment in Hepa1-6 bearing LDRT treated mice. e Representative flow cytometry plots (left panel) and quantification (right panel) of % TCF1+ PD-1+ in CD8+ T cells in the tumors of the indicated groups. f Bubble chart of KEGG enrichment pathways of RNA-seq in LDRT vs CON groups. n = 3 mice/group. g Heatmap of the DEGs in the cytokine-cytokine receptor interaction pathway. n = 3 mice/group. h Representative flow cytometry plots (left panel) and quantification (right panel) of % CXCR3+ in CD8+ T cells, % TCF1+ PD-1+ in CXCR3+ CD8+ T cells and CXCR3- CD8+ T cells in the Hepa1-6 tumors of the indicated groups. Data of c, e and h shown as means ± SD derived from tumor mouse models (n = 3 mice/group). P values of c, e and h were calculated using a two-sided unpaired Student’s t test. Source data are provided as a Source Data file.
Fig. 6
Fig. 6. The relevance of stem-like CD8+ Tpex infiltration in the response T + A-treated HCC patients and the Treg/Tef ratio in the prognosis of T + A-treated HCC patients and all HCC patients.
a (Left panel) Representative MRI of pre and post T + A in T + A response and non-response HCC. (Right panel) Representative mIHC image of stem-like CD8+ Tpex in T + A response and nonresponse HCC. Scale bars: 50 µm. b Quantification of mIHC of the TCF1+ PD-1+ CD8+ cells of CD8+ cells (%) in the indicated groups. T + A non-response: n = 6. T + A response: n = 3. c Graphs depict correlation between the Treg/Tef ratio and tumor diameter change from baseline (%). p value and R2 value were calculated using linear regression analysis (n = 9). d Quantification of flow cytometry plots of the Treg/Tef ratio in the PBMCs and TILs of the indicated groups. Relapse: n = 4. non-relapse: n = 16. e Representative IF image of Treg/Tef in HCC. Scale bars: 100 µm. f, g Kaplan–Meier curve of 5-year OS (upper panel) and 5-year RFS (lower panel) for HCC patients with low Treg/Tef ratio (Treg/Tef -low; n = 60) versus those with high Treg/Tef ratio (Treg/Tef - high; n = 60). P values of b and d were calculated using a two-sided unpaired Student’s t test. P values of f, g were determined by two-sided log-rank test (Mantel-Cox). Data of b and d shown as means ± SD. Source data are provided as a Source Data file.
Fig. 7
Fig. 7. The overview of the mechanism and experimental model investigating the synergistic antitumor effect of combined LDRT with T + A.
The first panel: Schematic diagram showing the mechanism antitumor effect of HCC by LDRT combined with T + A activate the intratumoral CD8+ Tex. The second panel: The scRNA-seq of the HCC mouse model with different treatments. The third panel: Relationship of stem-like CD8+ Tpex and Treg/Tef with the efficacy of T + A treatment and the prognosis of HCC.

References

    1. Sung H, et al. Global Cancer Statistics 2020: GLOBOCAN Estimates of Incidence and Mortality Worldwide for 36 Cancers in 185 Countries. CA Cancer J. Clin. 2021;71:209–249. doi: 10.3322/caac.21660. - DOI - PubMed
    1. Boland P, Wu J. Systemic therapy for hepatocellular carcinoma: beyond sorafenib. Chin. Clin. Oncol. 2018;7:50. doi: 10.21037/cco.2018.10.10. - DOI - PubMed
    1. Lau WY, et al. Preoperative systemic chemoimmunotherapy and sequential resection for unresectable hepatocellular carcinoma. Ann. Surg. 2001;233:236–241. doi: 10.1097/00000658-200102000-00013. - DOI - PMC - PubMed
    1. Finn RS, et al. Atezolizumab plus Bevacizumab in Unresectable Hepatocellular Carcinoma. N. Engl. J. Med. 2020;382:1894–1905. doi: 10.1056/NEJMoa1915745. - DOI - PubMed
    1. Cheng A-L, et al. Updated efficacy and safety data from IMbrave150: Atezolizumab plus bevacizumab vs. sorafenib for unresectable hepatocellular carcinoma. J. Hepatol. 2022;76:862–873. doi: 10.1016/j.jhep.2021.11.030. - DOI - PubMed

Publication types

MeSH terms