. 2023 Nov 24;14(1):7686.
doi: 10.1038/s41467-023-43464-z.

Thermal and electrostatic tuning of surface phonon-polaritons in LaAlO3/SrTiO3 heterostructures

Affiliations

Thermal and electrostatic tuning of surface phonon-polaritons in LaAlO3/SrTiO3 heterostructures

Yixi Zhou et al. Nat Commun. .

Abstract

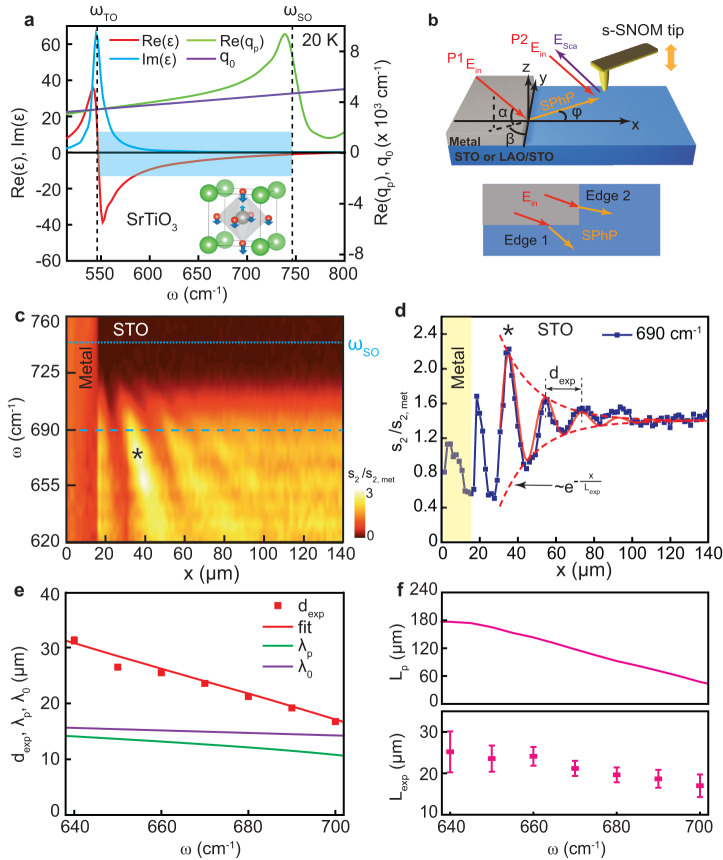
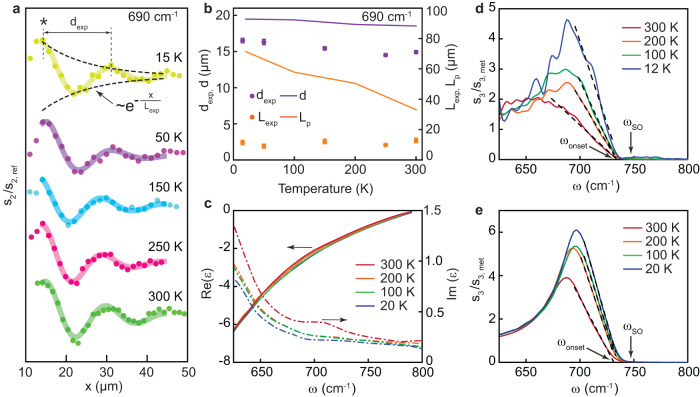
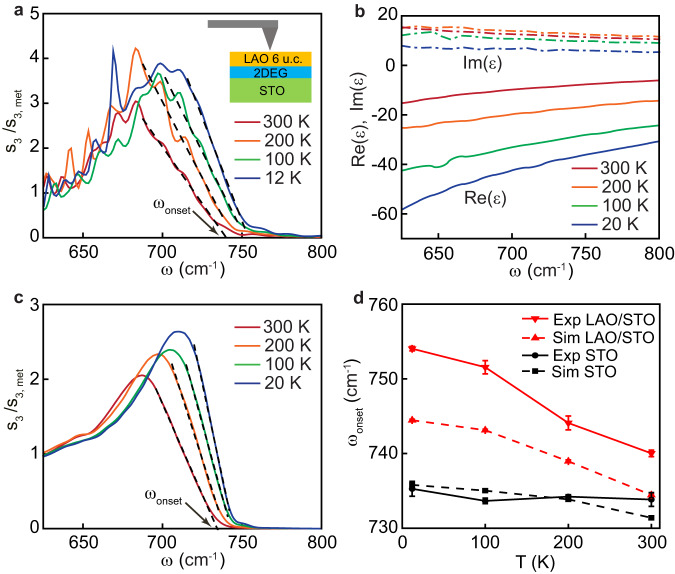
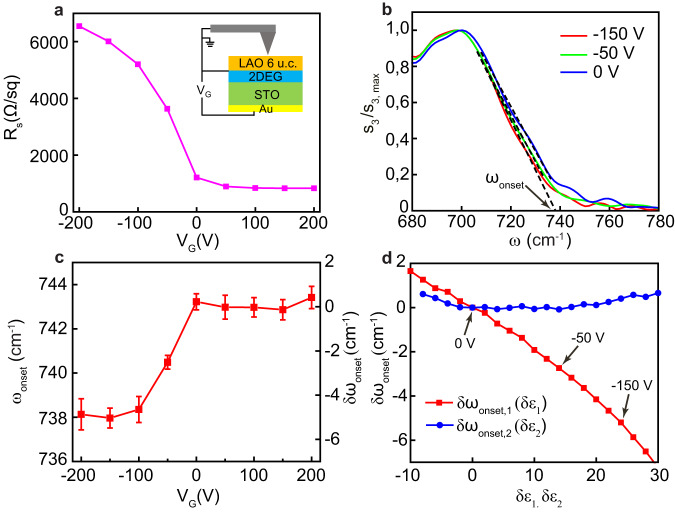
Phonon polaritons are promising for infrared applications due to a strong light-matter coupling and subwavelength energy confinement they offer. Yet, the spectral narrowness of the phonon bands and difficulty to tune the phonon polariton properties hinder further progress in this field. SrTiO3 - a prototype perovskite oxide - has recently attracted attention due to two prominent far-infrared phonon polaritons bands, albeit without any tuning reported so far. Here we show, using cryogenic infrared near-field microscopy, that long-propagating surface phonon polaritons are present both in bare SrTiO3 and in LaAlO3/SrTiO3 heterostructures hosting a two-dimensional electron gas. The presence of the two-dimensional electron gas increases dramatically the thermal variation of the upper limit of the surface phonon polariton band due to temperature dependent polaronic screening of the surface charge carriers. Furthermore, we demonstrate a tunability of the upper surface phonon polariton frequency in LaAlO3/SrTiO3 via electrostatic gating. Our results suggest that oxide interfaces are a new platform bridging unconventional electronics and long-wavelength nanophotonics.


Conflict of interest statement

The authors declare no competing interests.

Figures

Fig. 1
Fig. 1. Real-space nano-spectroscopy of surface phonon polaritons in pristine SrTiO3 at 15 K.
a Left axis: real (red line) and imaginary (blue line) parts of the STO permittivity εSTOω in the upper SPhP band (shaded area) corresponding to the highest-frequency phonon mode ν4 (depicted in the inset). Right axis: the real part of the in plane SPhP momentum qp=q0εSTO/(1+εSTO) (green line) and the momentum of light in free space q0=ω/c (purple line). The inset shows the unit cell of STO (Sr – green, Ti – gray, O – red), where the arrows denote the vibration eigen vector of the LO mode according to ref. . b Schematics of the SPhP interferometry experiment. The incident infrared beam Ein (red arrows) illuminates both the metal edge and the s-SNOM tip. The edge launched SPhPs (orange arrows) propagate toward the tip. The back-scattered radiation Esca contains contributions from two paths: the one mediated by the SPhPs (P1) and the one directly scattered by the tip (P2). As a result, an interference pattern is formed as a function of the edge-tip distance. α, β and φ represent the incident angle, the azimuthal angle and SPhP propagating angle, respectively. c Nano-FTIR distance-frequency map of the s-SNOM amplitude demodulated at the 2nd tapping harmonics and normalized by the signal on metal. Light blue dashed line represents the surface optical phonon frequency ωSO. d Symbols: line profile at 690 cm−1 (dashed dark-blue line in c). Solid line: a damped-sine function fit of the data. e Symbols: the fringe spacing dexp extracted from the fits, as a function of frequency. Red solid line: the best fit using formula (1) as described in the text. Green and purples lines: the SPhP wavelength λp=2π/Re(qp) and the light wavelength λ0 respectively. f Calculated propagation length Lp=1/Im(qp) (top panel) and experimental SPhP decay length Lexp (bottom panel) as a function of frequency. All error bars correspond to the standard deviation.
Fig. 2
Fig. 2. Temperature dependence of the SPhP properties in pristine SrTiO3.
a Symbols: s-SNOM amplitude profiles at 690 cm−1 at different temperatures from 15 to 300 K; solid lines: the corresponding damped-sine function fits. The curves are vertically shifted for clarity. The asterisk denotes the most intense maximum also marked in Fig. 1c, d. b Extracted fringe spacing dexp (purple) and decay length Lexp (orange) as a function of temperature. Solid lines: calculated temperature dependence based on the dielectric function of STO (panel c). A small difference between the experimental and theoretical values of d is likely due to non-identical illumination conditions in this measurement as compared to Fig. 1c, which we used to set the angles α and β in the calculation as specified in the text. c Real (solid curve) and imaginary (dash curve) parts of εSTOω at different temperatures. d Nano-FTIR amplitude spectra s3/s3,met collected far away from the metal edge at 12, 100, 200 and 300 K. e s-SNOM amplitude spectra obtained via the finite-dipole model using the permittivity data from panel c. Dashed lines in d and e: linear fits of the right-side part of the SPhP peak used to extract the onset SPhP frequency ωonset as described in the text. All error bars correspond to the standard deviation.
Fig. 3
Fig. 3. Temperature dependence of the SPhP band in LaAlO3/ SrTiO3.
a Nano-FTIR spectra at 12, 100, 200 and 300 K collected far away from the metal edge. b Permittivity of SrTi0.98Nb0.02O3, at different temperatures, which are used mimic the permittivity of the 2DEG layer. c Simulated s-SNOM amplitude spectra of the layered system with 2DEG, obtained using the finite-dipole model. Dashed lines in a and c are the linear fits to the high-frequency slope of the SPhP peak used to determine the onset frequency ωonset. d The onset frequency as a function of temperature. Black circles and squares are respectively experimental and model values on pristine STO, extracted from Fig. 2d, e. Red downward and upward triangles are the experimental and simulated values obtained on the LAO/STO system. All error bars correspond to the standard deviation.
Fig. 4
Fig. 4. Effect of electrostatic gating of the 2DEG on the SPhP band in LaAlO3/ SrTiO3.
a Sheet resistance of 2DEG as a function of the gate voltage, measured in situ during the cryogenic s-SNOM experiment. b Nano-FTIR spectra of s3/s3,max (normalized to the peak value) collected far away from the metal edge at selected values of the gate voltage VG: 0, −50 and −150 V. c The onset frequency ωonset extracted using linear fits as shown in b and Supplementary Fig. S7 as a function of the gate voltage. The relative shift of the onset frequency with respect to VG= 0 V is given on the right axis. d Simulated shift of ωonset obtained in two ways. First, the real part of the 2DEG permittivity is changing while the imaginary part is kept constant (red symbols). Second, the imaginary part is varied at constant real part (blue symbols). The arrows indicate the change of the real part of the permittivity corresponding to the experimentally observed shift of the onset frequency at 0 V, −50 V and −150 V. All error bars correspond to the standard deviation.

References

    1. Caldwell JD, et al. Low-loss, infrared and terahertz nanophotonics using surface phonon polaritons. Nanophotonics. 2015;4:44–68. doi: 10.1515/nanoph-2014-0003. - DOI
    1. Foteinopoulou S, Devarapu GCR, Subramania GS, Krishna S, Wasserman D. Phonon-polaritonics: enabling powerful capabilities for infrared photonics. Nanophotonics. 2019;8:2129–2175. doi: 10.1515/nanoph-2019-0232. - DOI
    1. Basov D, Asenjo-Garcia A, Schuck PJ, Zhu X, Rubio A. Polariton panorama. Nanophotonics. 2021;10:549–577. doi: 10.1515/nanoph-2020-0449. - DOI
    1. Hillenbrand R, Taubner T, Keilmann F. Phonon-enhanced light–matter interaction at the nanometre scale. Nature. 2002;418:159–162. doi: 10.1038/nature00899. - DOI - PubMed
    1. Li P, et al. Reversible optical switching of highly confined phonon–polaritons with an ultrathin phase-change material. Nat. Mater. 2016;15:870–875. doi: 10.1038/nmat4649. - DOI - PubMed