. 2023 Nov 24;11(1):62.
doi: 10.1038/s41413-023-00297-2.

Lipolysis supports bone formation by providing osteoblasts with endogenous fatty acid substrates to maintain bioenergetic status

Affiliations

Lipolysis supports bone formation by providing osteoblasts with endogenous fatty acid substrates to maintain bioenergetic status

Ananya Nandy et al. Bone Res. .

Abstract

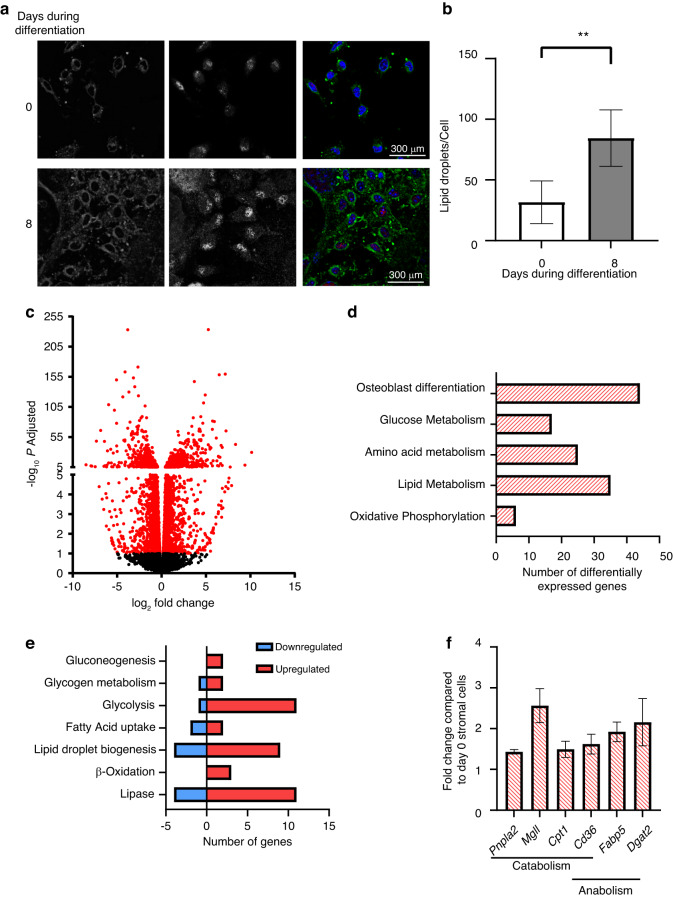
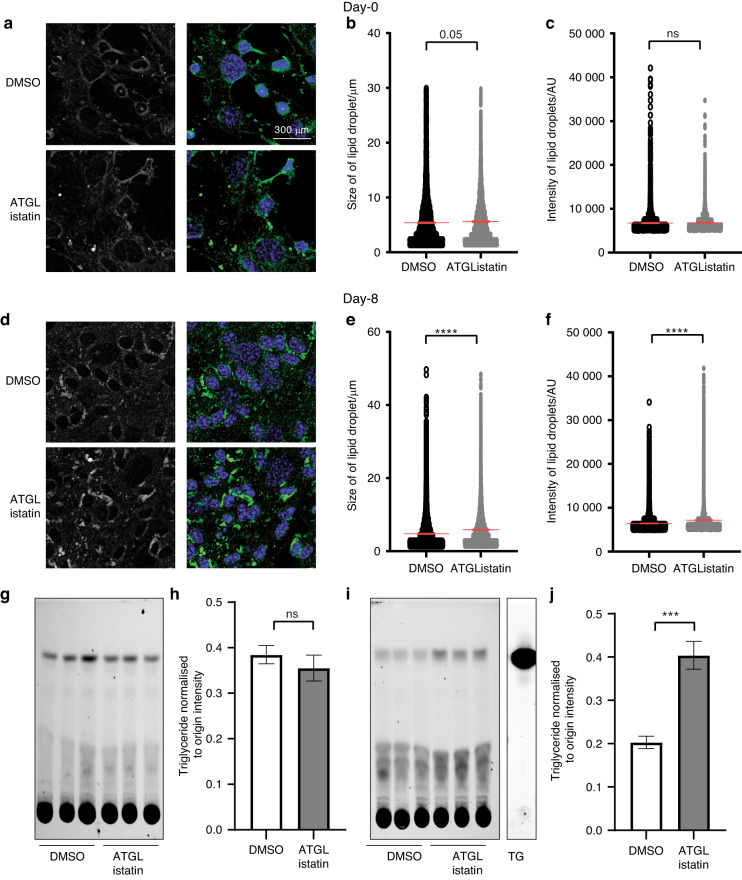
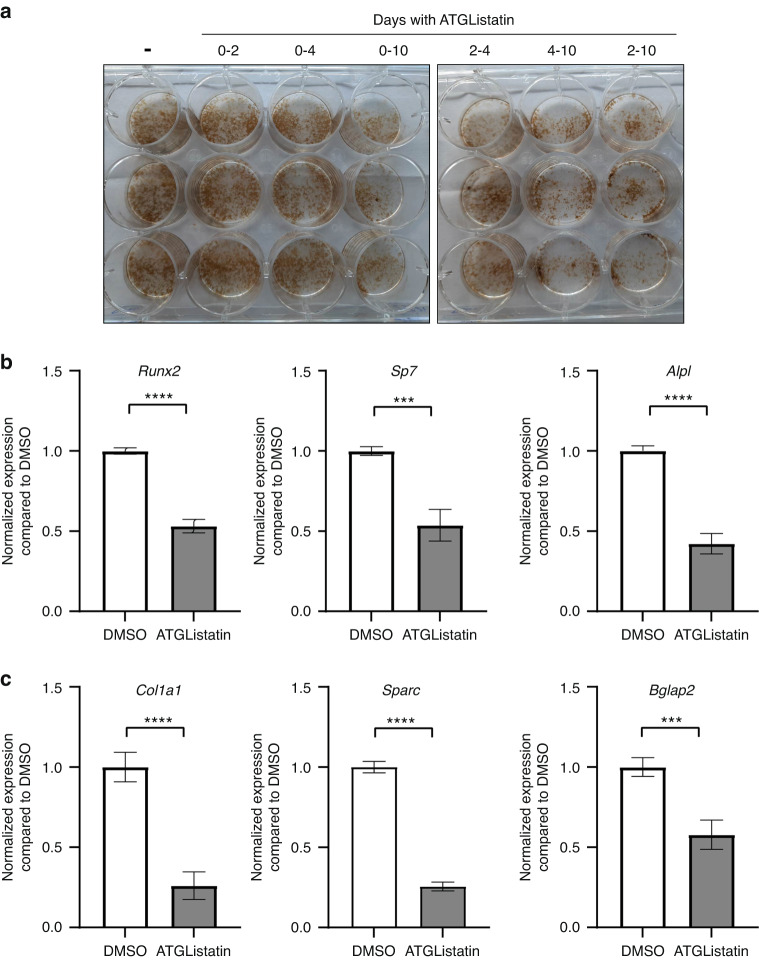
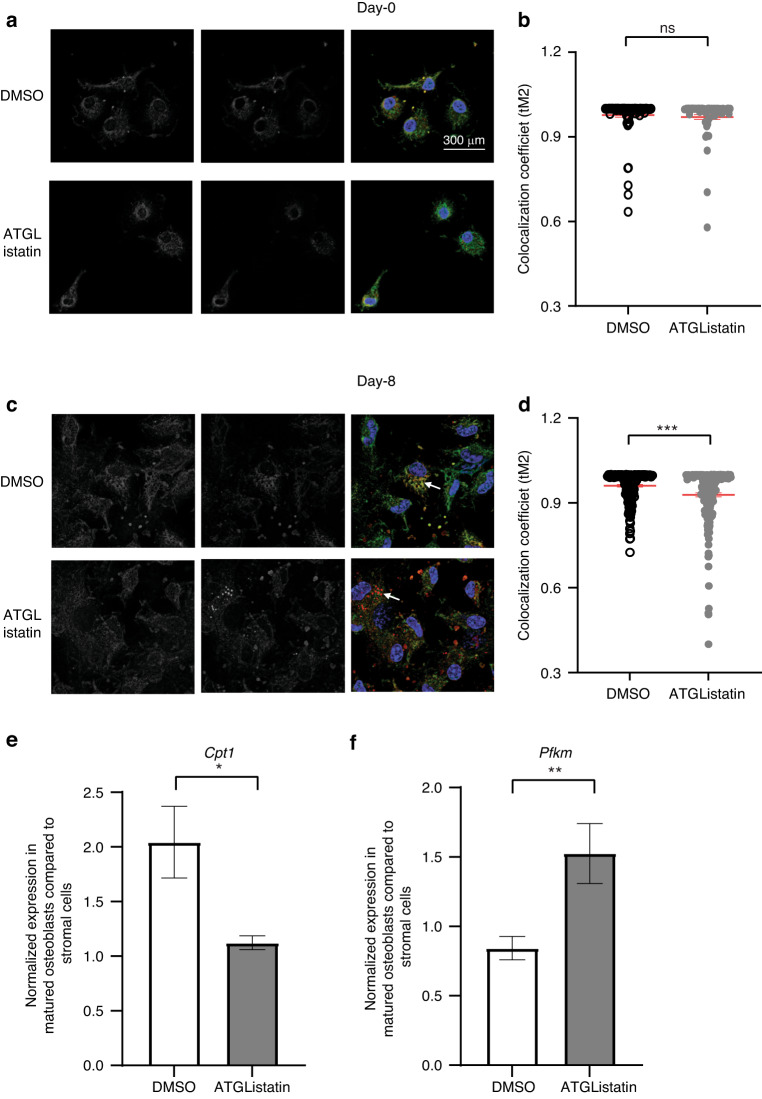
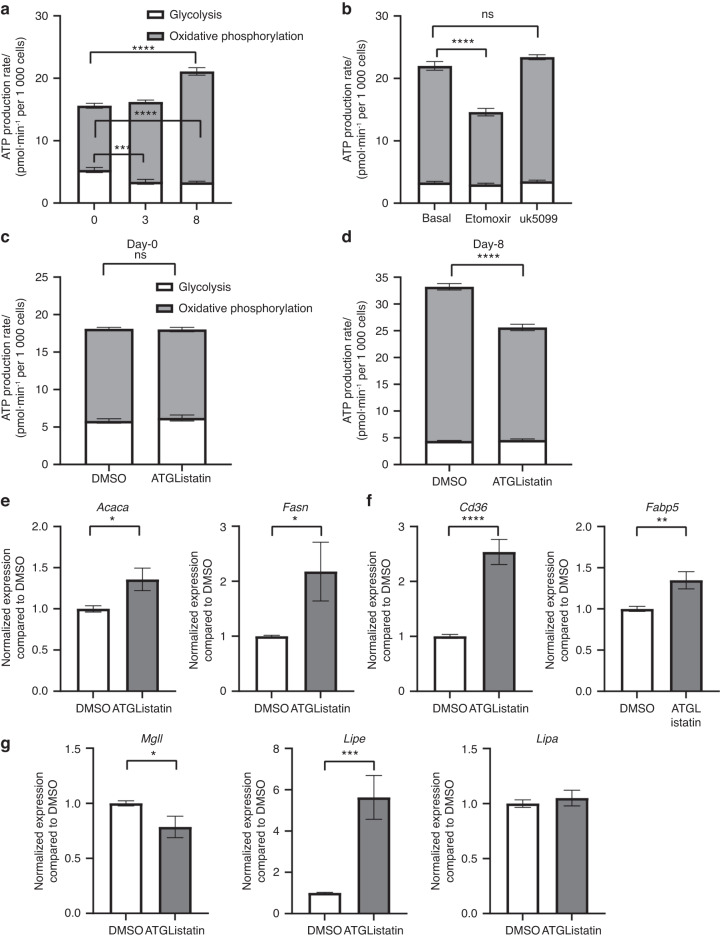
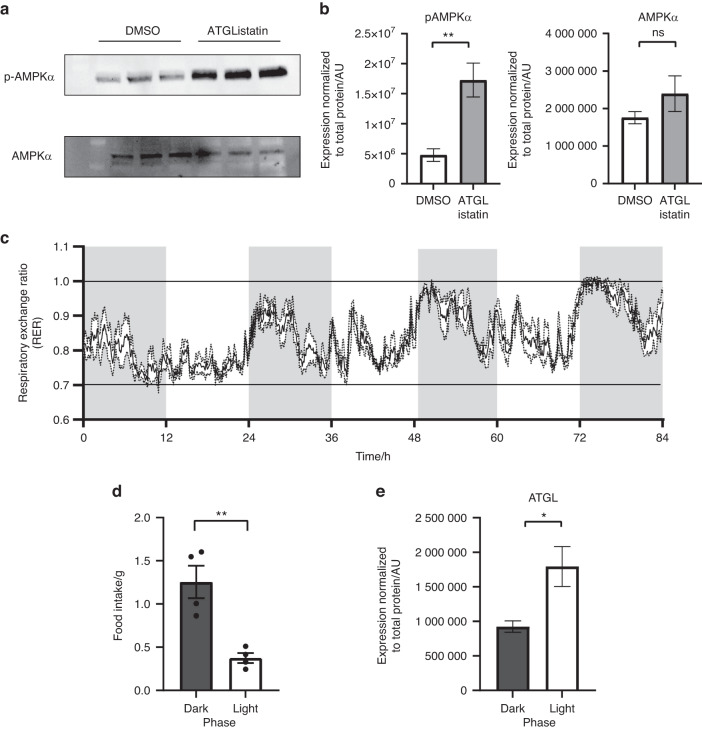
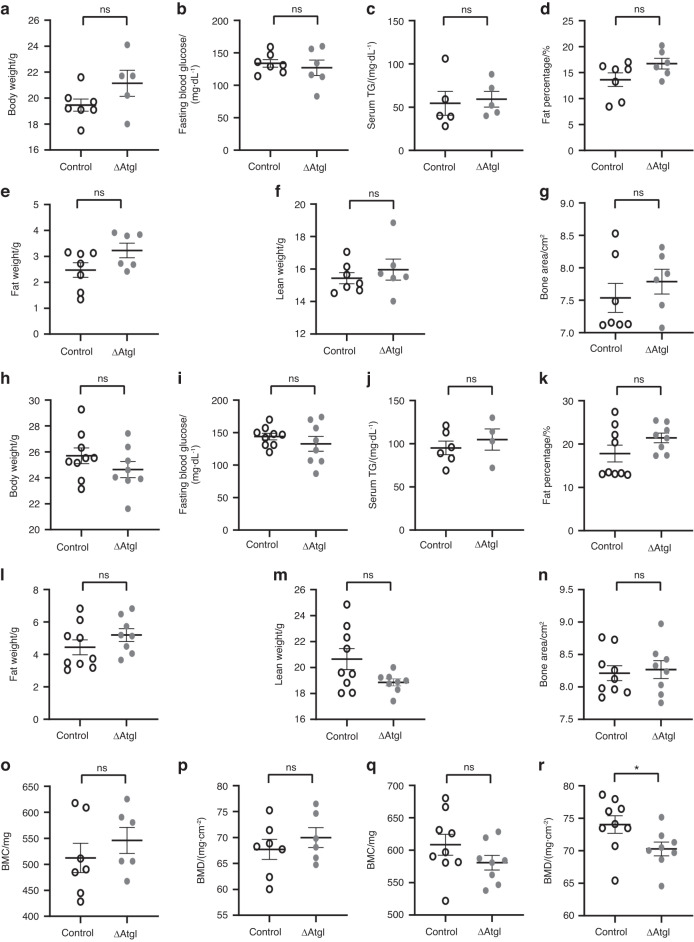
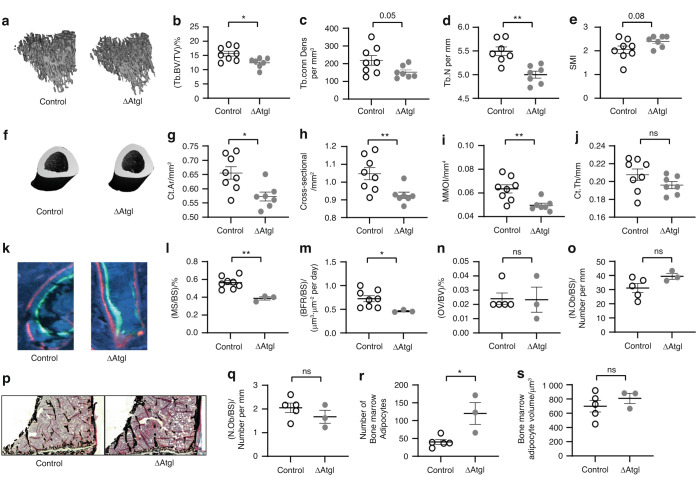
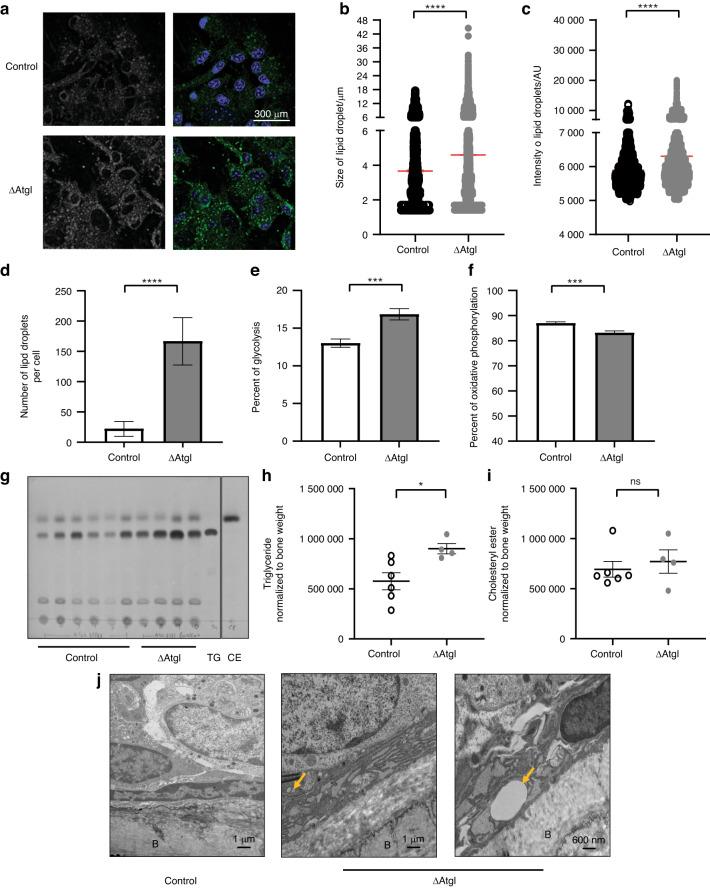
Bone formation is a highly energy-demanding process that can be impacted by metabolic disorders. Glucose has been considered the principal substrate for osteoblasts, although fatty acids are also important for osteoblast function. Here, we report that osteoblasts can derive energy from endogenous fatty acids stored in lipid droplets via lipolysis and that this process is critical for bone formation. As such, we demonstrate that osteoblasts accumulate lipid droplets that are highly dynamic and provide the molecular mechanism by which they serve as a fuel source for energy generation during osteoblast maturation. Inhibiting cytoplasmic lipolysis leads to both an increase in lipid droplet size in osteoblasts and an impairment in osteoblast function. The fatty acids released by lipolysis from these lipid droplets become critical for cellular energy production as cellular energetics shifts towards oxidative phosphorylation during nutrient-depleted conditions. In vivo, conditional deletion of the ATGL-encoding gene Pnpla2 in osteoblast progenitor cells reduces cortical and trabecular bone parameters and alters skeletal lipid metabolism. Collectively, our data demonstrate that osteoblasts store fatty acids in the form of lipid droplets, which are released via lipolysis to support cellular bioenergetic status when nutrients are limited. Perturbations in this process result in impairment of bone formation, specifically reducing ATP production and overall osteoblast function.


Conflict of interest statement

The authors declare no competing interest.

Figures

Fig. 1
Fig. 1
Lipid metabolism during osteoblastogenesis. a Representative confocal image of undifferentiated stromal cells on the 0th day and differentiated osteoblasts on the 8th day of ex vivo differentiation from mice. Cells were immunostained for Runx2 (red in merged panel) and mounted with DAPI (blue in merged panel). Cellular lipid droplets were stained with BODIPY 493/503 (green in merged panel). Panels 1 and 2 show monochrome images of lipid droplets and Runx2-stained nuclei, respectively, whereas Panel 3 shows a merged image. b Quantification of the number of lipid droplets per cell in stromal cells (open) and differentiated osteoblasts on the 8th day of differentiation (gray). The data are representative of 3 independent experiments (n = 3) and are the mean ± standard deviation (SD), where the lipid droplets per cell were counted from independent images captured in 6 different fields of view (n = 6) in each experiment. The number of lipid droplets counted from each image was divided by the number of cells (number of DAPI-positive nuclei) in that image to obtain lipid droplets per cell. t tests or nonparametric Mann‒Whitney tests were performed accordingly after testing of the normal distribution using the Shapiro‒Wilk normality test to determine significance between two groups where *P < 0.05, **P < 0.01, ***P < 0.001, ****P < 0.000 1. c Volcano plot showing differentially expressed genes (FDR-adjusted P < 0.05 in red circles) in stromal cells versus differentiated osteoblasts in pairwise comparisons. d Distribution of differentially expressed genes belonging to bone formation or metabolic pathways. e Distribution of differentially expressed genes belonging to specific glucose or lipid metabolism pathways. f Fold changes in the expression of genes involved in lipid metabolism that were statistically significant
Fig. 2
Fig. 2
Effect of blocking ATGL on lipid metabolism in osteoblasts. Representative confocal images of a undifferentiated stromal cells on the 0th day and d differentiated osteoblasts on the 8th day of ex vivo differentiation from mice. Cellular lipid droplets were stained with BODIPY 493/503 (green in the merged panel), and the cells were mounted with DAPI (blue in the merged panel) in the presence or absence of ATGListatin. Panel 1 shows monochrome images of lipid droplets, whereas Panel 2 shows a merged image. Quantification of b size and c intensity in stromal cells and e size and f intensity in osteoblasts of BODIPY 493/503-stained lipid droplets in DMSO-treated control cells (open circle) and ATGListatin-treated cells (gray closed circle), where each dot represents the size or intensity of one lipid droplet. The data are representative of 3 independent experiments (n = 3) and are the mean ± standard error of the mean. The size or intensity of each lipid droplet was measured from independent images captured in 6 different fields of view of the coverslip (n = 6) for each experiment. t tests were performed assuming a normal distribution since the data points were more than 40 to determine significance between two groups where *P < 0.05, **P < 0.01, ***P < 0.001, ****P < 0.000 1. Thin-layer chromatogram of lipids harvested from BODIPY 558/568 C12 (red fluorescent fatty acid)-labeled g stromal and i ex vivo-differentiated mature osteoblast cells in mice, along with the chromatogram of fluorescently labeled triglyceride run as the standard. Densitometric quantification of labeled triglyceride normalized to origin in h stromal cells and in j mature osteoblasts in the presence (gray bar) or absence (open bar) of ATGListatin. The data are representative of 3 independent experiments (n = 3) and are presented as the mean ± standard deviation of 3 wells (n = 3). t tests or nonparametric Mann‒Whitney tests were performed accordingly after testing normal distribution using the Shapiro‒Wilk normality test to determine significance between two groups, where *P < 0.05, **P < 0.01, ***P < 0.001, ****P < 0.000 1
Fig. 3
Fig. 3
Effect of blocking ATGL on osteoblast maturation and functioning. a Representative image of von Kossa staining of ex vivo-differentiated osteoblasts on the 10th day in the presence or absence of ATGListatin for different time frames. The image is representative of 3 independent experiments (n = 3). Quantitative real-time PCR-based expression data of b early and c late differentiation marker genes in the presence of DMSO (open bar) or ATGListatin (gray bar) in osteoblasts differentiated on the 10th day in which ATGListatin was present throughout differentiation in the ATGListatin-treated group. The fold change compared to DMSO was calculated by normalizing the housekeeping gene normalized expression of individual genes in the treated group to the mean of housekeeping gene normalized expression of those genes in the DMSO control group. The data are the mean ± standard error of the mean pooled from 3 independent experiments (n = 3), each having 3 technical replicates (n = 9). t tests or nonparametric Mann‒Whitney tests were performed accordingly after testing normal distribution using the Shapiro‒Wilk normality test to determine significance between two groups, where *P < 0.05, **P < 0.01, ***P < 0.001, ****P < 0.000 1
Fig. 4
Fig. 4
Effect of blocking ATGL on mitochondrial fatty acid availability. Representative confocal image of BODIPY 558/568 C12-labeled cells in which mitochondria were stained with mitodsRed and the cells were mounted with DAPI in the presence or absence of ATGListatin in a undifferentiated stromal cells on the 0th day and c differentiated osteoblasts on the 8th day of ex vivo differentiation. Panels 1 and 2 show monochrome images of mitochondria and BODIPY 558/568 C12, respectively, whereas Panel 3 is the merged image where mitochondria are pseudocolored green, BODIPY 558/568 C12 is red and DAPI blue. Quantification of colocalization of BODIPY 558/568 with MitodRed in terms of threshold-adjusted Mander’s coefficient (tM2) in the absence (open circle) or presence (gray circle) of ATGListatin in b undifferentiated stromal cells on the 0th day and d differentiated osteoblasts. The data are the mean ± standard error of the mean (SEM) pooled from 3 independent experiments (n = 3). Each dot represents colocalization measured per cell counted from independent images captured in 6 different fields of view in each experiment (n = 18). t tests were performed assuming a normal distribution since there were more than 40 data points used to determine significance between two groups, where *P < 0.05, **P < 0.01, ***P < 0.001, and ****P < 0.000 1. Analysis was performed on a single stack using Fiji ImageJ. e Fold change in quantitative real-time PCR-derived normalized expression of the β-oxidation gene Cpt1 and f glycolytic gene Pfkm on the 10th day of differentiation compared to the 0th day of differentiation in stromal cells in the absence (open bar) or presence (gray bar) of ATGListatin. The data are the mean ± standard error of the mean pooled from 3 independent experiments (n = 3), each having 3 technical replicates (n = 9). t tests or nonparametric Mann‒Whitney tests were performed accordingly after testing normal distribution using the Shapiro‒Wilk normality test to determine significance between two groups, where *P < 0.05, **P < 0.01, ***P < 0.001, ****P < 0.000 1
Fig. 5
Fig. 5
Effect of blocking ATGL on osteoblast energetics. ATP produced by glycolysis (white) versus oxidative phosphorylation (shaded) as measured by Seahorse ATP rate assay in the absence of any external nutrients a during ex vivo osteoblastogenesis at the indicated time points. b In differentiated matrix-secreting osteoblasts on the 8th day of ex vivo differentiation in the absence or presence of etomoxir (Eto) and UK-5099 (UK). in the absence or presence of ATGListatin in c 0-day stromal cells and d 8-day-differentiated osteoblasts. The data are representative of 3 independent experiments (n = 3) and are the mean ± standard error of mean of data normalized to cell counts per well with data from a minimum of 11 wells per group (n = 11). Quantitative real-time PCR-based expression of e de novo fatty acid synthesis, f fatty acid uptake, and g lipase genes in the presence of DMSO (open bar) or ATGListatin (gray bar) in 10-day-differentiated osteoblasts in which ATGListatin was present throughout in the ATGListatin-treated group. The fold change compared to DMSO was calculated by normalizing the housekeeping gene normalized expression of individual genes in the treated group to the mean of housekeeping gene normalized expression of that gene in the DMSO control group. The data are the mean ± standard error of the mean pooled from 3 independent experiments (n = 3), each having 3 technical replicates (n = 9). t tests or nonparametric Mann‒Whitney tests were performed accordingly after testing normal distribution using the Shapiro‒Wilk normality test to determine significance between two groups, where *P < 0.05, **P < 0.01, ***P < 0.001, ****P < 0.000 1
Fig. 6
Fig. 6
Physiological relevance of ATGL-mediated metabolism to osteoblast energetics. a Immunoblotting of ex vivo-differentiated osteoblasts with anti-pAMPKα (Thr172) and AMPKα in the presence or absence of ATGListatin. b Quantification of pAMPKα and AMPKα expression normalized to total protein in respective lanes measured by no-stain protein labeling in the absence (open bar) or presence of ATGListatin (gray bar). The data are the means ± standard deviations from three wells. c Respiratory exchange ratio of C57BL6/N mice over an 84-h (3.5-day) time period. Shaded vertical bars indicate a 12-h dark phase/cycle, and white vertical bars indicate a 12-h light phase/cycle. d Average daily food intake by these mice during the dark (dark gray bar) and light phases (open bar). The data are the means ± standard errors of the means, where n = 4 animals. e Quantification of ATGL expression in the femur cortex during the dark (dark gray bar) and light phases (open bar) normalized to total protein in respective lanes as measured by no-stain protein labeling. The data are the means ± standard errors of the means from n = 3 and n = 2 animals in dark and light cycles, respectively
Fig. 7
Fig. 7
Effect of conditionally knocking out the ATGL coding gene in osteoblast precursor cells (ΔATGL) on central metabolism. a Body weight, b fasting blood glucose, and c serum triglyceride (TG) levels of 12-week-old control (open circle) and ΔATGL (closed gray circle) female mice. d Fat percentages, e fat weights, f lean weights, and g bone areas of 12-week control (open circle) and ΔATGL female mice (closed gray circle) as measured by DXA scanning. h Body weight, i fasting blood glucose, and j serum triglyceride (TG) levels of 12-week-old control (open circle) and ΔATGL (closed gray circle) male mice. k Fat percentages, l fat weights, m lean weights, and n bone areas of 12-week control (open circle) and ΔATGL male mice (closed gray circle) as measured by DXA scanning. o Bone mineral content (BMC; mg) and p bone mineral density (BMD; mg/cm2) as measured by DXA scanning in 12-week-old female and male q, r control (open circle) and ΔATGL (closed gray circle) mice. Each dot represents data from individual animals, where n = 7 in control and 5/6 in knockout females and n = 9 in control and 8 in knockout males, except serum TG, where n = 5 for both control and knockout females and n = 6 and 4 for control and knockout males. The data are the mean ± standard error of the mean. t tests or nonparametric Mann‒Whitney tests were performed accordingly after testing normal distribution using the Shapiro‒Wilk normality test to determine significance between two groups, where *P < 0.05, **P < 0.01, ***P < 0.001, ****P < 0.000 1
Fig. 8
Fig. 8
Bone health in ΔATGL mice. ae Micro-computed tomography (µCT) analysis of the trabecular bone of the tibia in 12-week-old control (open circle) and ΔATGL mice (closed gray circle). a Representative 3D micro-CT image of trabecular bone. b Percentage bone volume over total volume [(Tb.BV/TV)/%]. c Connection density (Tb.conn Dens per mm3). d Trabecular number (Tb.N per mm). e Trabecular structure model index (Tb.SMI; 0= plates, 3= rods). fj Micro-computed tomography (µCT) analysis of cortical bone. f Representative 3D micro-CT image of trabecular bone. g Cortical bone area (Ct.Ar/mm2). h Total cross-sectional area (Cross-sectional/mm2). i Minimum moment of inertia (MMOI/mm4). j Thickness (Ct.Th/mm). n = 8 in the control group and 7 in the knockout group. lo Histomorphometric analysis of the tibia in 12-week-old control (open circle) and ΔATGL mice (closed gray circle). k-m) Histodynamic analysis. k Representative image of a bone section double-labeled with Alizarin (red) and Calicin (green). l Percentage mineralization surface over bone surface [(MS/BS)/%]. m Bone formation rate over bone surface. n = 8 in the control group and 3 in the knockout group [(BFR/BS)/μm3·μm−2 per day]. (n-s) Histostatic analysis. n Percentage osteoid volume over bone volume [(OV/BV)/%]. o Number of osteoblasts over the bone surface [(N.Ob/BS)/Number per mm]. p Representative image of a trichrome-stained bone section. q Number of osteoclasts over the bone surface [(N.Ob/BS)/Number per mm]. r Number of bone marrow adipocytes. s Volume of bone marrow adipocytes. n = 5 in the control group and 3 in the knockout group. All the data are presented as the mean ± standard error of the mean. t tests or nonparametric Mann‒Whitney tests were performed accordingly after testing normal distribution using the Shapiro‒Wilk normality test to determine significance between two groups, where *P < 0.05, **P < 0.01, ***P < 0.001, ****P < 0.000 1
Fig. 9
Fig. 9
Lipid metabolism in bone and osteoblasts of ΔATGL mice. a Representative confocal image of ex vivo-differentiated osteoblasts on the 8th day of differentiation from control and ΔATGL mice in which cellular lipid droplets were stained with BODIPY 493/503 (green in merged panel). Quantification of b size and c intensity of BODIPY 493/503-stained lipid droplets in differentiated osteoblasts from control (open circle) or ΔATGL mice (gray closed circle), where each dot represents the size or intensity of one lipid droplet. d Quantification of the number of lipid droplets per cell in differentiated osteoblasts from control (open) and ΔATGL mice (gray). e, f Seahorse ATP rate assay. Percentage of e glycolytic and f oxidative phosphorylation measured by Seahorse ATP rate assay in absence of any external nutrients in ex vivo-differentiated osteoblasts on the 8th day of differentiation from 12-week-old control (open) and ΔATGL mice (gray) mice. g Thin-layer chromatogram of lipids harvested from flushed tibias (tibia without any bone marrow) from 12-week-old control and ΔATGL mice. Densitometric quantification of the lipid species from control (open circle) and ΔATGL mice (gray closed circle) from the chromatogram h triglyceride, i cholesteryl ester normalized to bone weight. j Transmission electron microscopy image of thinly sectioned tibia showing the ER (red arrow) and lipid droplets (yellow arrow) in the cytosol of osteoblasts positioned next to the bone surface (B) in control and ΔATGL mice. The control and first image from ΔATGL mice was taken at 2 700 × magnification, and the second image is from a higher-magnification zoomed-in section where the image was taken at 4 400X. All the data are represented from individual animals, where n = 6 control and n = 4 knockout mice, and presented as the mean ± standard error of the mean. t tests or nonparametric Mann‒Whitney tests were performed accordingly after testing normal distribution using the Shapiro‒Wilk normality test to determine significance between two groups where *P < 0.05, **P < 0.01, ***P < 0.001, ****P < 0.000 1

Similar articles

Cited by

References

    1. Feng X, McDonald JM. Disorders of bone remodeling. Annu. Rev. Pathol. 2011;6:121–145. doi: 10.1146/annurev-pathol-011110-130203. - DOI - PMC - PubMed
    1. Zaidi M. Skeletal remodeling in health and disease. Nat. Med. 2007;13:791–801. doi: 10.1038/nm1593. - DOI - PubMed
    1. Iqbal J, Sun L, Zaidi M. Coupling bone degradation to formation. Nat. Med. 2009;15:729–731. doi: 10.1038/nm0709-729. - DOI - PubMed
    1. Andersen TL, et al. A physical mechanism for coupling bone resorption and formation in adult human bone. Am. J. Pathol. 2009;174:239–247. doi: 10.2353/ajpath.2009.080627. - DOI - PMC - PubMed
    1. Florencio-Silva R, Sasso GR, Sasso-Cerri E, Simoes MJ, Cerri PS. Biology of bone tissue: structure, function, and factors that influence bone cells. Biomed. Res. Int. 2015;2015:421746. doi: 10.1155/2015/421746. - DOI - PMC - PubMed

Publication types