. 2024 Jan;31(1):119-131.
doi: 10.1038/s41418-023-01245-7. Epub 2023 Nov 24.

Non-canonical BIM-regulated energy metabolism determines drug-induced liver necrosis

Affiliations

Non-canonical BIM-regulated energy metabolism determines drug-induced liver necrosis

Rebekka Lambrecht et al. Cell Death Differ. 2024 Jan.

Abstract

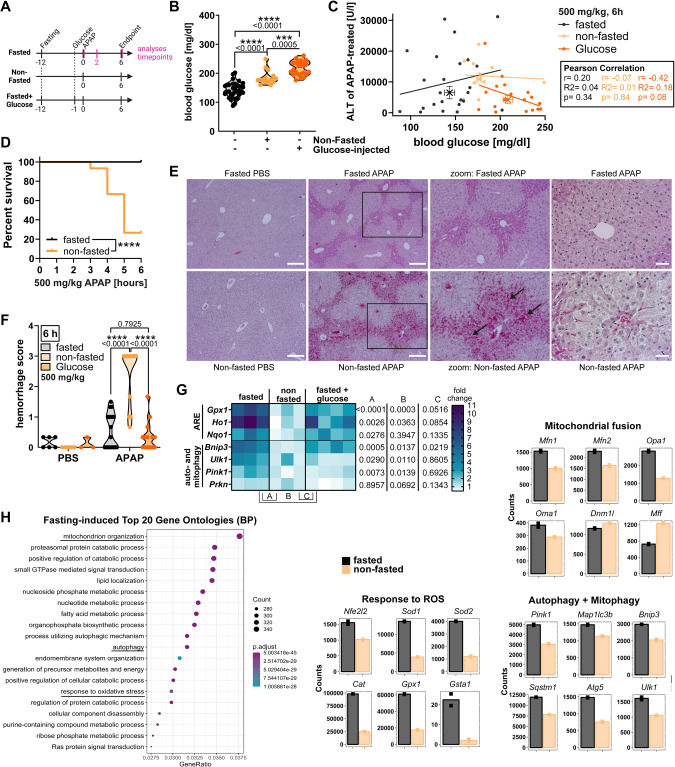
Paracetamol (acetaminophen, APAP) overdose severely damages mitochondria and triggers several apoptotic processes in hepatocytes, but the final outcome is fulminant necrotic cell death, resulting in acute liver failure and mortality. Here, we studied this switch of cell death modes and demonstrate a non-canonical role of the apoptosis-regulating BCL-2 homolog BIM/Bcl2l11 in promoting necrosis by regulating cellular bioenergetics. BIM deficiency enhanced total ATP production and shifted the bioenergetic profile towards glycolysis, resulting in persistent protection from APAP-induced liver injury. Modulation of glucose levels and deletion of Mitofusins confirmed that severe APAP toxicity occurs only in cells dependent on oxidative phosphorylation. Glycolytic hepatocytes maintained elevated ATP levels and reduced ROS, which enabled lysosomal recycling of damaged mitochondria by mitophagy. The present study highlights how metabolism and bioenergetics affect drug-induced liver toxicity, and identifies BIM as important regulator of glycolysis, mitochondrial respiration, and oxidative stress signaling.


Conflict of interest statement

The authors declare no competing interests.

Figures

Fig. 1
Fig. 1. APAP induces apoptotic BH3-only proteins but fails to activate caspases.
A Serum ALT of mice treated for 6 h with PBS or 500 mg/kg APAP i.p. Bold dotted line indicates median and weak dotted lines show quartiles. B MTT assay of primary murine (PMH) and human hepatocytes (PHH) treated for 16 h or 24 h, respectively, or FACS analysis of AnnexinV-FITC + IHH and HepG2 cells treated for 24 h. n = 5 (PMH), n = 2 (PHH), n = 13 (IHH), n = 4 (HepG2). C, D Transcript levels of mouse liver of mice treated as described in A, and of PMH, PHH and IHH treated for 3 h with 10 mM APAP (PMH) or with 20 mM APAP (PHH, IHH). n = 7 (PMH), n = 6 (PHH), n = 5 (IHH). E Top 20 gene ontologies of hepatocyte subset from mice treated as described in A generated from single cell RNA sequencing. BP biological function. F Western blot of ML of mice treated as described in A and of PHH and HepG2 treated with 20 mM APAP for 12 h. G Schematic illustration of APAP-induced apoptotic processes. Data points and/or bar graphs are mean +/− SD with n as independent biological replicates. Statistical significance was tested using unpaired Student’s t test (C, D).
Fig. 2
Fig. 2. Depletion of BIM protects from APAP-induced liver necrosis.
A–C Serum ALT and necrotic area scored from histology images (see Supplementary Fig. S3A) of WT, Noxa−/− and Bim−/− mice treated for 6 h with 500 mg/kg (A, B) or for 24 h with 300 mg/kg APAP (C). Bold dotted line indicates median and weak dotted lines show quartiles. Statistical significance was tested using Two-way ANOVA with Sidak’s multiple comparison test. D Western Blot of BCL-xL immunoprecipitation of primary murine hepatocytes (PMH) untreated (UT) or treated for 3 h with 10 mM APAP or 2 ng/ml murine TNF and 30 nM Actinomycin D (ActD). E Western Blot of cytosolic (C) and mitochondrial (M) fractions of PMH treated with 10 mM APAP for 6 h.
Fig. 3
Fig. 3. BIM contributes to APAP-induced mitochondrial damage and energy crisis.
A Energy Map of Seahorse Induced ATP Rate Assay with medium (UT) or APAP injection (final 15 mM APAP) of primary murine hepatocytes (PMH), n = 4–8. Data normalized to sum of mito- and gylcoATP of WT untreated PMH. B Representative confocal images of MitoTracker Green-stained PMH and quantification of mitochondria morphology based on length to width ratio, n = 3. Scale bar 20 µm. C Western Blot of PMH treated with 20 mM APAP for 6 h. D Transcript levels of untreated murine livers (ML) of WT and Bim−/− mice. E, F Western Blot of PMH treated with 20 mM APAP for 6 h (E) and ML of mice treated with 300 mg/kg APAP for 24 h (F). Data points and/or bar graphs are mean +/− SD with n as independent biological replicates. Statistical significance was tested using unpaired Student’s t test (D).
Fig. 4
Fig. 4. Sensitivity to APAP-induced toxicity depends on mitochondrial energy production.
A Seahorse Basal ATP Rate Assay of untreated primary murine hepatocytes (PMH) and IHH with glyco/mitoATP ratio above, n = 6–8. B CellTiter-Glo Assay of PMH and IHH cells treated for 6 h, n = 4–9. C Working hypothesis: Glucose withdrawal shifts cell lines to oxidative phosphorylation (OxPhos) dependency and elongated mitochondria (green), while MFN1/2 knockout reverses the phenotype. D Representative confocal images of MitoTracker Green-stained untreated IHH and HepG2 cultured in different glucose concentrations. Scale bar 20 µm. E Seahorse Mito Stress Test Assay of IHH (left) or Basal ATP Rate Assay of HepG2 (mid+right) cultured in normal (NG) or no glucose (noG). Basal respiration and maximal ECAR surrogate for mitochondrial and glycolytic activity. Statistical significance tested by comparing mitoATP and glycoATP independently. n = 3 (all). F FACS analysis of AnnexinV-FITC + IHH and HepG2 treated with 20 mM APAP for 24 h and cultured in NG or noG. n = 3–6 (left), n = 4 (mid), n = 4 (right). Data points and/or bar graphs are mean +/− SD with n as independent biological replicates. Statistical significance was tested using unpaired Student’s t test (E) or Two-way ANOVA with Sidak’s multiple comparison test (B, F).
Fig. 5
Fig. 5. Glycolysis-mediated energy production rescues from APAP toxicity.
A Working hypothesis: Glucose administration shifts primary cells to glycolysis dependency and fragmented mitochondria (green). B Energy Map of Seahorse Induced ATP Rate Assay with medium (untreated, UT) or APAP injection (final 15 mM) of primary murine hepatocytes (PMH) cultured in normal glucose (NG) or high glucose (HG), n = 3–8. Data normalized to sum of mito- and gylcoATP of NG-conditioned, untreated PMH. C Representative confocal images of MitoTracker Green-stained PMH cultured in different glucose concentrations with quantification of mitochondria morphology based on length to width ratio, n = 3. Scale bar 20 µm. D CellTiter-Glo Assay of PMH cultured in NG or HG and treated with 10 mM APAP or Rotenone for 6 h, n = 3. E MTT assay of PMH cultured in NG or HG and treated with APAP for 16 h, n = 7. FH Serum ALT and necrotic area of scored from H&E-stained histology images of mice treated for 6 h with 500 mg/kg (left) or for 24 h with 300 mg/kg APAP (right) with optional injection of 2.5 g/kg glucose 1 h prior to APAP. Bold dotted line indicates median and weak dotted lines show quartiles. Scale bars 250 µm (G). Data points and/or bar graphs are mean +/− SD with n as independent biological replicates. Statistical significance was tested using Two-way ANOVA with Sidak’s multiple comparison test (DG).
Fig. 6
Fig. 6. Fasting is beneficial by priming for antioxidant and autophagy responses prior to APAP intoxication.
A Illustrated timeline of animal experiments with fasting 12 h prior to PBS/APAP injection and glucose injection 1 h prior to PBS/APAP injection. Glucose levels in (B + C) were measured at t = 0. Gene expression in (G) was measured at t = 2. ALT and liver damage was measured at t = 6. B Blood glucose levels of mice 1 h after 2.5 g/kg glucose injection, and of mice non-fasted or fasted overnight. Bold dotted line indicates median and weak dotted lines quartiles. C Correlation between serum ALT of mice treated with 500 mg/kg APAP for 6 h and respective blood glucose prior to APAP treatment. Crosses indicate group median +/− SEM. Statistical significance and linear fit was calculated by Pearson correlation. D Kaplan–Meier survival curve of fasted and nonfasted mice treated with APAP (6 h, 500 mg/kg APAP), n = 26 (fasted), n = 15 (non-fasted). Statistical significance was calculated using Gehan–Breslow–Wilcoxon test. E, F Representative images of H&E-stained liver sections and hemorrhage scoring of fasted or non-fasted mice treated with 500 mg/kg APAP for 6 h. Scale bars 250 µm (left), 50 µm (right). G Transcript levels of livers from nonfasted/fasted mice 2 h after glucose injection. Heatmap shows fold change to nonfasted and respective statistical significances on the right. H Fasting-induced gene ontologies of hepatocyte DEGs (left) and gene expression counts of selected DEGs (right) from overnight fasted mice analyzed by hepatocyte bulkRNA sequencing. BP biological process. Data points and/or bar graphs are mean +/− SD with n as independent biological replicates. Statistical significance was tested using Two-way ANOVA with Sidak’s multiple comparison test (B, F, G).
Fig. 7
Fig. 7. Increased glycolysis allows fasting-initiated autophagy to remove damaged mitochondria.
AB Transcript levels of livers of mice treated with 300 mg/kg APAP for 24 h with previous glucose injection (A) or Bim−/− mice (B). Data shows fold change to WT control/PBS and respective statistical significances on the right. C Western Blot of liver lysates of mice injected with 300 mg/kg APAP for 24 h with previous glucose injection. DE Representative immunofluorescence images (D) and quantification (E) of Acridine Orange and Hoechst-stained primary murine hepatocytes (PMH) cultured in normal or high glucose (High Gluc) and untreated (UT) or treated with 10 mM APAP or Bafilomycin (BafA) for 6 h, n = 4–7. Scale bars 100 µm. Bright Acridine Orange signals were normalized to Hoechst signals. F Quantification of median fluorescence intensity (MFI) of MitoSox Red-stained PMH cultured in low (LG), normal (NG), or high glucose (HG) and treated with 10 mM APAP for 6 h, n = 3. G Correlation between MitoSox Red MFI and fragmented mitochondria calculated from length to width ratio of MitoTracker Green-stained untreated WT/Bim−/− PMH cultured in LG, NG, or HG. SD is shown of the displayed n = 3. Statistical significance and linear fit calculated from Pearson correlation. H Schematic illustration of how reduced mitochondrial dependency circumvents ROS-mediated inhibition of mito/autophagy in response to APAP treatment. Data points and/or bar graphs are mean +/− SD with n as independent biological replicates. Statistical significance was tested using Two-way ANOVA with Sidak’s multiple comparison test (A, B, E, F).

Similar articles

Cited by

References

    1. Bedoui S, Herold MJ, Strasser A. Emerging connectivity of programmed cell death pathways and its physiological implications. Nat Rev Mol Cell Biol. 2020;21:678–95. doi: 10.1038/s41580-020-0270-8. - DOI - PubMed
    1. Fritsch M, Günther SD, Schwarzer R, Albert M-C, Schorn F, Werthenbach JP, et al. Caspase-8 is the molecular switch for apoptosis, necroptosis and pyroptosis. Nature. 2019;575:683–7. doi: 10.1038/s41586-019-1770-6. - DOI - PubMed
    1. Weindel CG, Martinez EL, Zhao X, Mabry CJ, Bell SL, Vail KJ, et al. Mitochondrial ROS promotes susceptibility to infection via gasdermin D-mediated necroptosis. Cell. 2022 doi: 10.1016/j.cell.2022.06.038. - DOI - PMC - PubMed
    1. Günther C, He G-W, Kremer AE, Murphy JM, Petrie EJ, Amann K, et al. The pseudokinase MLKL mediates programmed hepatocellular necrosis independently of RIPK3 during hepatitis. J Clin Invest. 2016;126:4346–60. doi: 10.1172/JCI87545. - DOI - PMC - PubMed
    1. Lee WM. Acetaminophen (APAP) hepatotoxicity—Isn’t it time for APAP to go away? J Hepatol. 2017;67:1324–31. doi: 10.1016/j.jhep.2017.07.005. - DOI - PMC - PubMed

Publication types