. 2023 Nov;28(6):1001-1012.
doi: 10.1007/s12192-023-01394-1. Epub 2023 Nov 25.

Human HSP70-escort protein 1 (hHep1) interacts with negatively charged lipid bilayers and cell membranes

Affiliations

Human HSP70-escort protein 1 (hHep1) interacts with negatively charged lipid bilayers and cell membranes

Milene N O Moritz et al. Cell Stress Chaperones. 2023 Nov.

Abstract

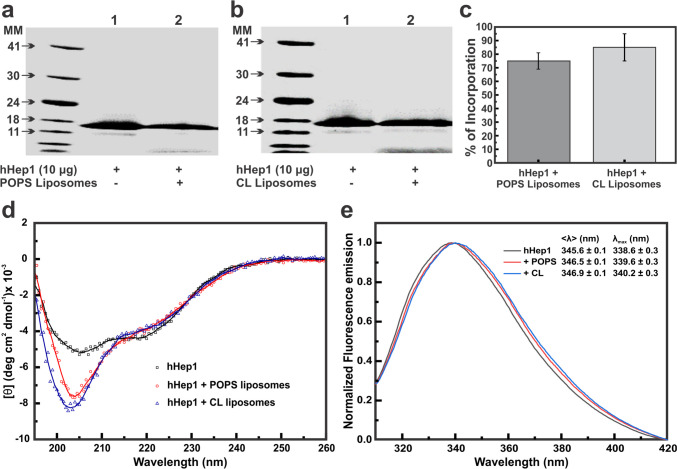
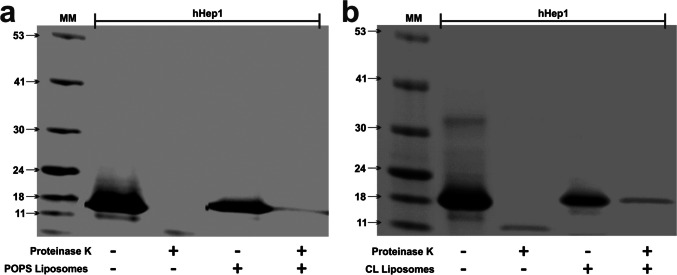
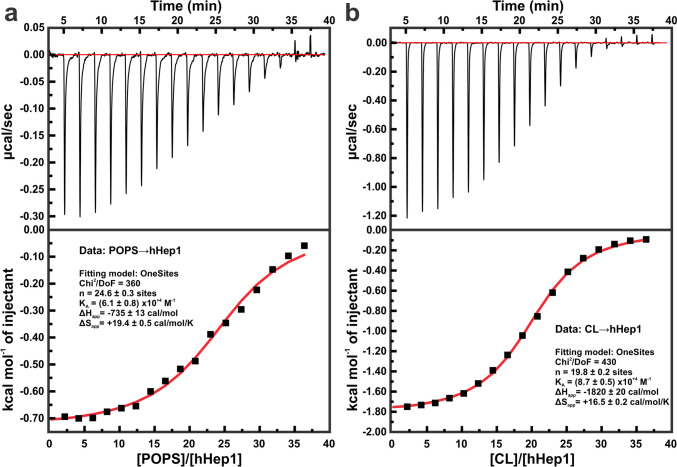
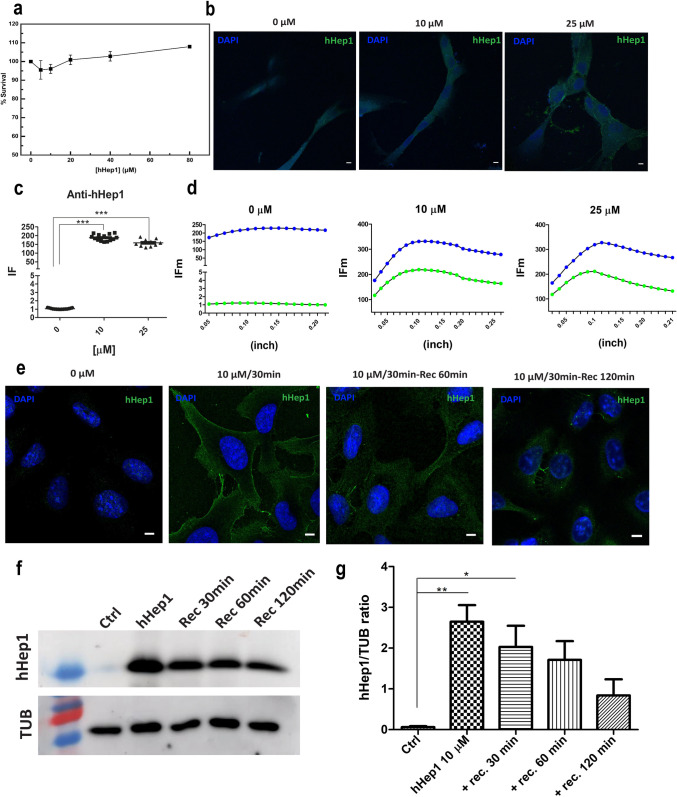
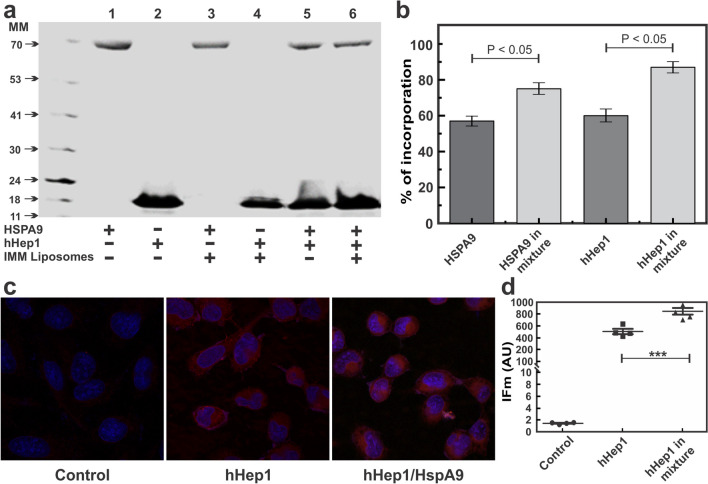
Human Hsp70-escort protein 1 (hHep1) is a cochaperone that assists in the function and stability of mitochondrial HSPA9. Similar to HSPA9, hHep1 is located outside the mitochondria and can interact with liposomes. In this study, we further investigated the structural and thermodynamic behavior of interactions between hHep1 and negatively charged liposomes, as well as interactions with cellular membranes. Our results showed that hHep1 interacts peripherally with liposomes formed by phosphatidylserine and cardiolipin and remains partially structured, exhibiting similar affinities for both. In addition, after being added to the cell membrane, recombinant hHep1 was incorporated by cells in a dose-dependent manner. Interestingly, the association of HSPA9 with hHep1 improved the incorporation of these proteins into the lipid bilayer. These results demonstrated that hHep1 can interact with lipids also present in the plasma membrane, indicating roles for this cochaperone outside of mitochondria.

Keywords: Cochaperone; HSP70s; Heat Shock; Liposomes and plasma membrane.


Conflict of interest statement

The authors declare no conflict of interest.

Figures

Fig. 1
Fig. 1
hHep1 incorporation in negatively charged liposomes is efficient and causes conformational changes in its structure. After incubation, the LDS-PAGE gel reveals that hHep1 (10 µg) interacts with both POPS (a) and CL (b). Lanes 1 in the gel images are hHep1 load controls and lanes 2 are hHep1 pelleted that interacted with liposomes in the pulldown experiment. The amount of each band was evaluated by GelQuant program and their relative intensity is represented as the percentage of hHep1 incorporated in each liposome (c). Spectra of structural changes of the interaction of 10 μM hHep1 with POPS and CL evaluated by circular dichroism spectroscopy (d) and by tryptophan emission fluorescence (e). In the latter case, the respective calculated values of < λ > are shown in the legend figure
Fig. 2
Fig. 2
hHep1 interaction with lipid bilayer is peripherally. LDS-PAGE gels showing the interaction of hHep1 with POPS (a) and CL (b) in the presence and absence of proteinase K
Fig. 3
Fig. 3
Calorimetric study of the interaction of liposomes with hHep1. Representatives isothermograms of the interaction between hHep1 and POPS (a) and hHep1 and CL (b). The thermodynamic parameters (ΔHapp, KA and n) were obtained by a non-linear fitting equation using the One Bind site model in the Origin 7.0 based analysis program
Fig. 4
Fig. 4
hHep1 interacts with cell plasma membrane, incorporating in human fibroblasts and in U2OS cells (a) Viability of human fibroblasts treated with purified recombinant hHep1 His-tag protein analyzed by MTT assay performed in duplicate. The absorbance measurements at 570 nm were converted into percentage for survival rate compared to control (100% survival). (b) Representative confocal images of human fibroblasts stained with anti-hHep1 antibody (green) and nuclei stained with DAPI (blue). Cells were treated with different hHep1 concentrations (0, 10 and 25 µM) for 30 min. (c) Graph represents the quantification of green fluorescence intensities (anti-hHep1) in each slice field compared to control using ANOVA followed by Tukey's test (***p < 0.001). (d) Graphs of the mean fluorescence intensities (IFm) in the green channel (FITC) of the hHep1 along the image slices (z-inch axis) obtained under a confocal microscope. DAPI signal is represented in blue. (e) Representative confocal images of U2OS cells stained with anti-hHep1 antibody (green) and nuclei stained with DAPI (blue). Cells were treated with hHep1 at 10 µM of concentration for 30 min (10 µM/30 min) in PBS and recovery time at 1 h (10 µM/30 min-Rec 1 h) and 2 h (10 µM/30 min-Rec 2 h) in medium. (f) Western blotting of U2OS cells: non treated (Ctrl), hHep1 at 10 µM of concentration for 30 min in PBS (hHep1) and recovery time at 30 min (Rec 30 min), 60 min (Rec 60 min) and 120 min (Rec 120 min) in medium. (g) Graphs of the densitometry ratio (hHep1/TUB) in three independent assays (n = 3). The results of quantification were compared using ANOVA followed by Tukey's test (*p < 0.05 and **p < 0.01)
Fig. 5
Fig. 5
Formation of the hHep1/HSPA9 complex and interaction with lipid bilayer and cell membrane. (a) Study of the interaction of hHep1 with HSPA9 in the presence and absence of a mixture of liposomes that mimic the inner mitochondrial membrane (POPS 3%, CL 18%, POPC 45% and POPE 34%). Representative image of LDS-PAGE. 1: HSPA9 (loading control at ~ 56 nM). 2: hHep1 (loading control at ~ 1.3 µM). 3 HSPA9 pulled down with the mixture of liposomes (POPS 3%, CL 18%, POPC 45% and POPE 34%). 4: hHep1 pulled down with the mixture of liposomes. 5: HSPA9 and hHep1 pulled down. 6: HSPA9 and hHep1 pulled down with the mixture of liposomes. (b) The GelQuant software was used to analyze the intensity of the bands in the gel and, consequently, estimate the percentage of hHep1 and HSPA9 incorporated in each condition. Experiment performed in triplicate. (c) Representative confocal images of U2OS cells stained with anti-hHep1 antibody (red) and nuclei stained with DAPI (blue). Cells were treated with hHep1 at 5 µM of concentration for 30 min, or with both hHep1/HSPA9 at 1:1 molar ratio for 30 min in PBS. (d) Graph represents the quantification of red fluorescence intensities (anti-hHep1) increment of each slice field in hHep1 treatment compared to hHep1/HSPA9 treatment using ANOVA followed by Tukey's test (***p < 0.001)

References

    1. Araujo TLS, Venturini G, Moretti AIS, Tanaka LY, Pereira AC, Laurindo FRM. Cell-surface HSP70 associates with thrombomodulin in endothelial cells. Cell Stress Chaperones. 2019;24:273–282. doi: 10.1007/s12192-018-00964-y. - DOI - PMC - PubMed
    1. Arispe N, Doh M, De Maio A. Lipid interaction differentiates the constitutive and stress-induced heat shock proteins Hsc70 and Hsp70. Cell Stress Chaperones. 2002;7(4):330. doi: 10.1379/1466-1268(2002)007<0330:lidtca>2.0.co;2. - DOI - PMC - PubMed
    1. Arispe N, Doh M, Simakova O, Kurganov B, De Maio A. Hsc70 and Hsp70 interact with phosphatidylserine on the surface of PC12 cells resulting in a decrease of viability. FASEB. 2004;18:1636–1645. doi: 10.1096/fj.04-2088com. - DOI - PubMed
    1. Armijo G, Okerblom J, Cauvi DM, Lopez V, Schlamadinger DE, Kim J, Arispe N, De Maio A. Interaction of heat shock protein 70 with membranes depends on the lipid environment. Cell Stress Chaperones. 2014;19:877–886. doi: 10.1007/s12192-014-0511-x. - DOI - PMC - PubMed
    1. Bailone RL, Fukushima S, Aguiar D, Borra LK. Mortalin as a biomarker disease and therapeutic target. Sci J Biol. 2022;5(1):1–09. doi: 10.37871/sjb.id25. - DOI

Publication types