

Characterizations of the multi-kingdom gut microbiota in Chinese patients with gouty arthritis
- PMID: 38001408
- PMCID: PMC10668524
- DOI: 10.1186/s12866-023-03097-0
Characterizations of the multi-kingdom gut microbiota in Chinese patients with gouty arthritis
Abstract
Objective: The gut microbial composition has been linked to metabolic and autoimmune diseases, including arthritis. However, there is a dearth of knowledge on the gut bacteriome, mycobiome, and virome in patients with gouty arthritis (GA).
Methods: We conducted a comprehensive analysis of the multi-kingdom gut microbiome of 26 GA patients and 28 healthy controls, using whole-metagenome shotgun sequencing of their stool samples.
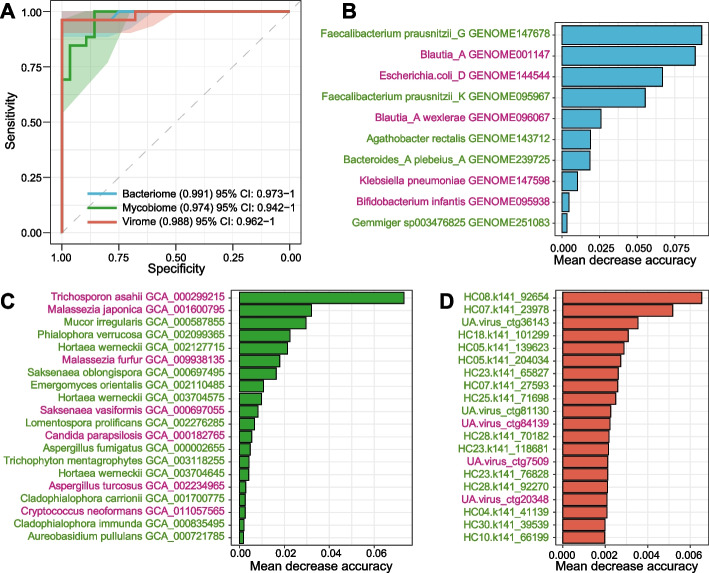
Results: Profound alterations were observed in the gut bacteriome, mycobiome, and virome of GA patients. We identified 1,117 differentially abundant bacterial species, 23 fungal species, and 4,115 viral operational taxonomic units (vOTUs). GA-enriched bacteria included Escherichia coli_D GENOME144544, Bifidobacterium infantis GENOME095938, Blautia_A wexlerae GENOME096067, and Klebsiella pneumoniae GENOME147598, while control-enriched bacteria comprised Faecalibacterium prausnitzii_G GENOME147678, Agathobacter rectalis GENOME143712, and Bacteroides_A plebeius_A GENOME239725. GA-enriched fungi included opportunistic pathogens like Cryptococcus neoformans GCA_011057565, Candida parapsilosis GCA_000182765, and Malassezia spp., while control-enriched fungi featured several Hortaea werneckii subclades and Aspergillus fumigatus GCA_000002655. GA-enriched vOTUs mainly attributed to Siphoviridae, Myoviridae, Podoviridae, and Microviridae, whereas control-enriched vOTUs spanned 13 families, including Siphoviridae, Myoviridae, Podoviridae, Quimbyviridae, Phycodnaviridae, and crAss-like. A co-abundance network revealed intricate interactions among these multi-kingdom signatures, signifying their collective influence on the disease. Furthermore, these microbial signatures demonstrated the potential to effectively discriminate between patients and controls, highlighting their diagnostic utility.
Conclusions: This study yields crucial insights into the characteristics of the GA microbiota that may inform future mechanistic and therapeutic investigations.
Keywords: Gouty arthritis; Gut bacteriome; Gut mycobiome; Gut virome; Microbiota dysbiosis; Multi-kingdom signatures; Whole-metagenome shotgun sequencing.
© 2023. The Author(s).
Conflict of interest statement
The authors declare no competing interests.
Figures


Similar articles
-
Characterizations of the Gut Bacteriome, Mycobiome, and Virome in Patients with Osteoarthritis.Microbiol Spectr. 2023 Feb 14;11(1):e0171122. doi: 10.1128/spectrum.01711-22. Epub 2022 Dec 14. Microbiol Spectr. 2023. PMID: 36515546 Free PMC article.
-
Metagenome-based characterization of the gut bacteriome, mycobiome, and virome in patients with chronic hepatitis B-related liver fibrosis.Front Microbiol. 2024 Oct 25;15:1449090. doi: 10.3389/fmicb.2024.1449090. eCollection 2024. Front Microbiol. 2024. PMID: 39526142 Free PMC article.
-
Multikingdom characterization of gut microbiota in patients with rheumatoid arthritis and rheumatoid arthritis-associated interstitial lung disease.J Med Virol. 2024 Jul;96(7):e29781. doi: 10.1002/jmv.29781. J Med Virol. 2024. PMID: 38961767
-
Gut bacteriome, mycobiome and virome alterations in rheumatoid arthritis.Front Endocrinol (Lausanne). 2023 Jan 9;13:1044673. doi: 10.3389/fendo.2022.1044673. eCollection 2022. Front Endocrinol (Lausanne). 2023. PMID: 36699026 Free PMC article. Review.
-
Roles of the gut virome and mycobiome in faecal microbiota transplantation.Lancet Gastroenterol Hepatol. 2022 May;7(5):472-484. doi: 10.1016/S2468-1253(21)00303-4. Epub 2022 Mar 8. Lancet Gastroenterol Hepatol. 2022. PMID: 35276080 Review.
Cited by
-
A population-scale analysis of 36 gut microbiome studies reveals universal species signatures for common diseases.NPJ Biofilms Microbiomes. 2024 Oct 1;10(1):96. doi: 10.1038/s41522-024-00567-9. NPJ Biofilms Microbiomes. 2024. PMID: 39349486 Free PMC article.
-
Causal impact of human blood metabolites and metabolic pathways on serum uric acid and gout: a mendelian randomization study.Front Endocrinol (Lausanne). 2024 Jul 4;15:1378645. doi: 10.3389/fendo.2024.1378645. eCollection 2024. Front Endocrinol (Lausanne). 2024. PMID: 39027467 Free PMC article.
-
Analysis of the overall development trends and hotspots in the research field of the human gut virome.Virol J. 2025 Jul 5;22(1):224. doi: 10.1186/s12985-025-02856-x. Virol J. 2025. PMID: 40618116 Free PMC article. Review.
-
The Gut Microbiome in Hyperuricemia and Gout.Arthritis Rheumatol. 2025 Aug;77(8):955-965. doi: 10.1002/art.43118. Epub 2025 Feb 13. Arthritis Rheumatol. 2025. PMID: 39829115 Review.
References
-
- Punzi L, Scanu A, Galozzi P, Luisetto R, Spinella P, Scirè CA, Oliviero F. One year in review 2020: gout. Clin Exp Rheumatol. 2020;38(5):807–821. - PubMed
Publication types
MeSH terms
Grants and funding
- Support [2020]4Y155/Science and Technology Program of Guizhou Province
- Platform and talent [2020]2202/Science and Technology Program of Guizhou Province
- 82260894/National Natural Science Foundation of China
- 81902037/National Natural Science Foundation of China
- GZEYK-B[2021]2/Scientific Research Project of the Second Affiliated Hospital of Guizhou University of Traditional Chinese Medicine
LinkOut - more resources
Full Text Sources
Miscellaneous
