

Multiclass risk models for ovarian malignancy: an illustration of prediction uncertainty due to the choice of algorithm
- PMID: 38001421
- PMCID: PMC10668424
- DOI: 10.1186/s12874-023-02103-3
Multiclass risk models for ovarian malignancy: an illustration of prediction uncertainty due to the choice of algorithm
Abstract
Background: Assessing malignancy risk is important to choose appropriate management of ovarian tumors. We compared six algorithms to estimate the probabilities that an ovarian tumor is benign, borderline malignant, stage I primary invasive, stage II-IV primary invasive, or secondary metastatic.
Methods: This retrospective cohort study used 5909 patients recruited from 1999 to 2012 for model development, and 3199 patients recruited from 2012 to 2015 for model validation. Patients were recruited at oncology referral or general centers and underwent an ultrasound examination and surgery ≤ 120 days later. We developed models using standard multinomial logistic regression (MLR), Ridge MLR, random forest (RF), XGBoost, neural networks (NN), and support vector machines (SVM). We used nine clinical and ultrasound predictors but developed models with or without CA125.
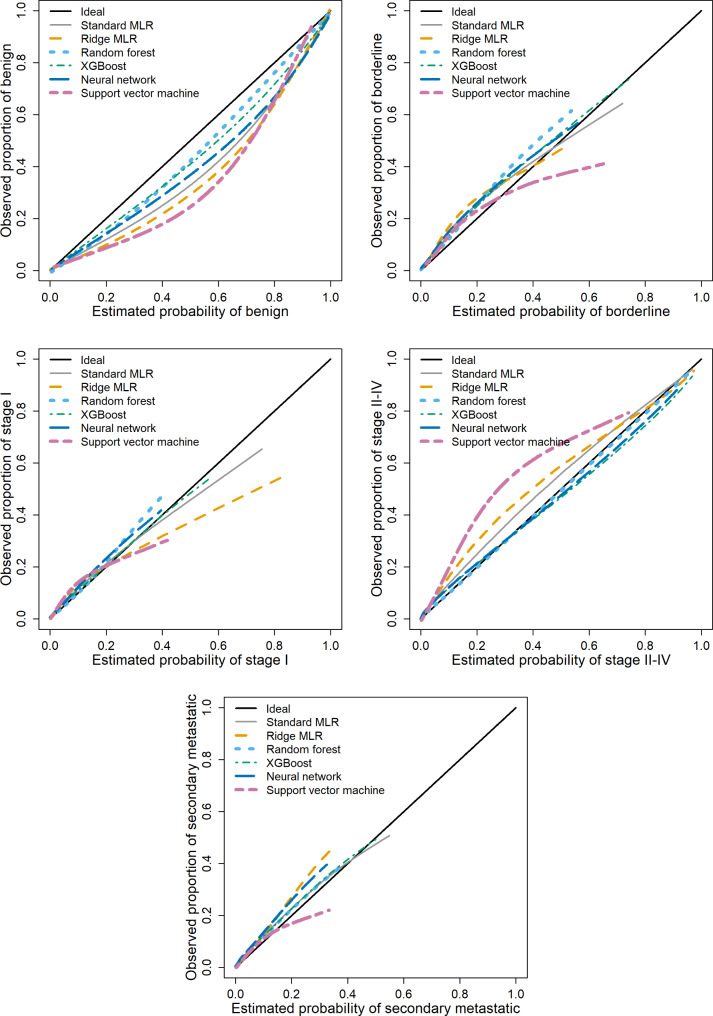
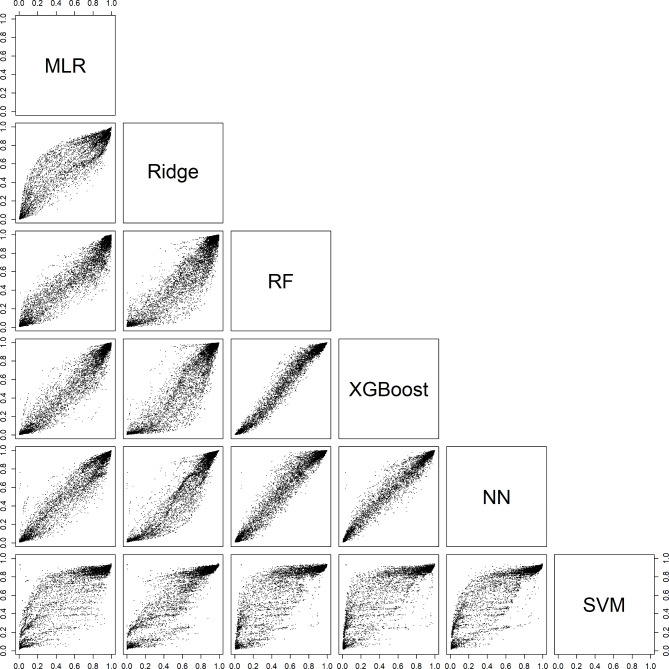
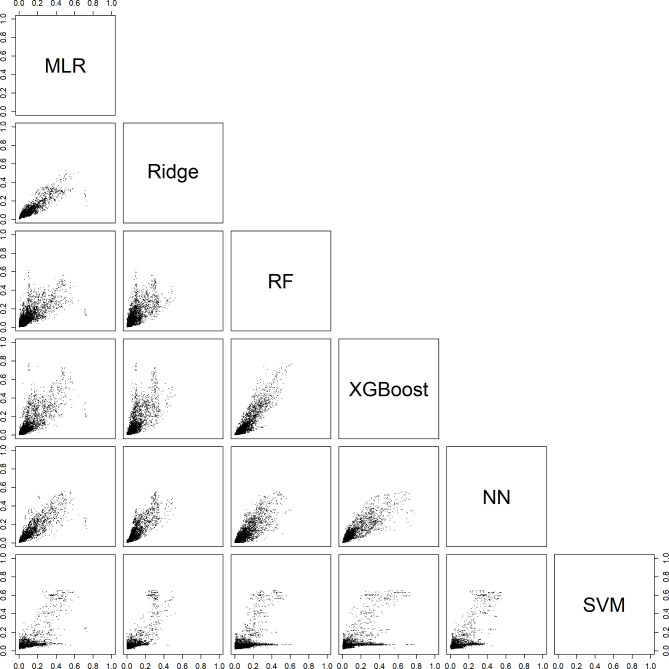
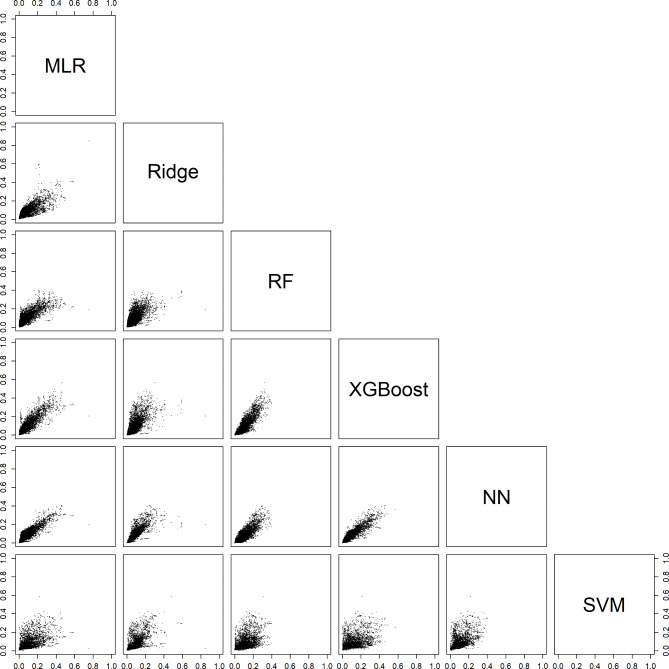
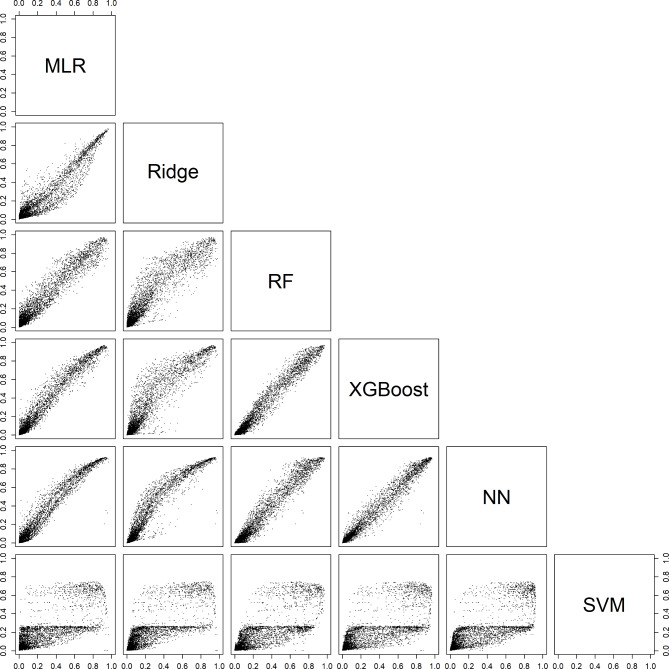
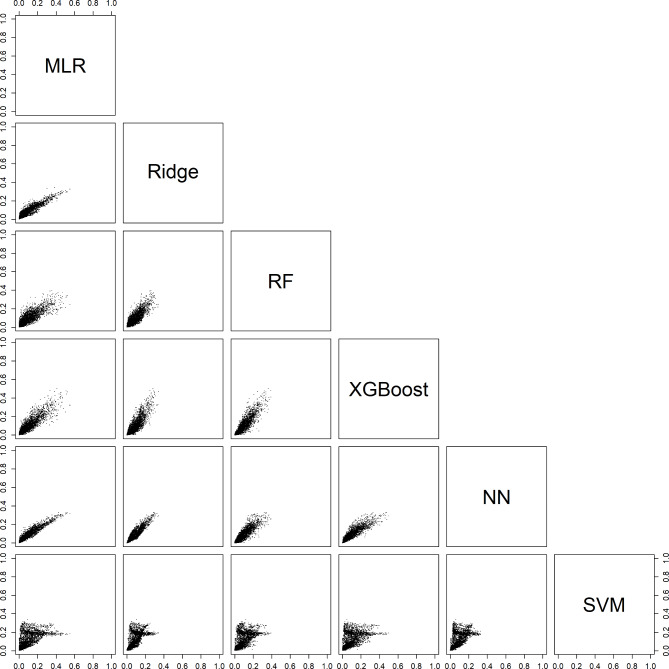
Results: Most tumors were benign (3980 in development and 1688 in validation data), secondary metastatic tumors were least common (246 and 172). The c-statistic (AUROC) to discriminate benign from any type of malignant tumor ranged from 0.89 to 0.92 for models with CA125, from 0.89 to 0.91 for models without. The multiclass c-statistic ranged from 0.41 (SVM) to 0.55 (XGBoost) for models with CA125, and from 0.42 (SVM) to 0.51 (standard MLR) for models without. Multiclass calibration was best for RF and XGBoost. Estimated probabilities for a benign tumor in the same patient often differed by more than 0.2 (20% points) depending on the model. Net Benefit for diagnosing malignancy was similar for algorithms at the commonly used 10% risk threshold, but was slightly higher for RF at higher thresholds. Comparing models, between 3% (XGBoost vs. NN, with CA125) and 30% (NN vs. SVM, without CA125) of patients fell on opposite sides of the 10% threshold.
Conclusion: Although several models had similarly good performance, individual probability estimates varied substantially.
Keywords: Calibration; Machine learning; Multiclass models; Ovarian Neoplasms; Prediction models.
© 2023. The Author(s).
Conflict of interest statement
LV reported receiving grants from the Swedish Research Council, Malmö University Hospital and Skåne University Hospital, Allmänna Sjukhusets i Malmö Stiftelse för bekämpande av cancer (the Malmö General Hospital Foundation for Fighting Against Cancer), Avtal om läkarutbildning och forskning (ALF)–medel, and Landstingsfinansierad Regional Forskning during the conduct of the study; and teaching fees from Samsung outside the submitted work. DT and BVC reported receiving grants from the Research Foundation–Flanders (FWO) and Internal Funds KU Leuven during the conduct of the study. TB reported receiving grants from NIHR Biomedical Research Centre, speaking honoraria and departmental funding from Samsung Healthcare and grants from Roche Diagnostics, Illumina, and Abbott. No other disclosures were reported. All other authors declare no competing interests.
Figures
Similar articles
-
Validation of models to diagnose ovarian cancer in patients managed surgically or conservatively: multicentre cohort study.BMJ. 2020 Jul 30;370:m2614. doi: 10.1136/bmj.m2614. BMJ. 2020. PMID: 32732303 Free PMC article.
-
Polytomous diagnosis of ovarian tumors as benign, borderline, primary invasive or metastatic: development and validation of standard and kernel-based risk prediction models.BMC Med Res Methodol. 2010 Oct 20;10:96. doi: 10.1186/1471-2288-10-96. BMC Med Res Methodol. 2010. PMID: 20961457 Free PMC article.
-
A spline-based tool to assess and visualize the calibration of multiclass risk predictions.J Biomed Inform. 2015 Apr;54:283-93. doi: 10.1016/j.jbi.2014.12.016. Epub 2015 Jan 9. J Biomed Inform. 2015. PMID: 25579635
-
Evaluating the risk of ovarian cancer before surgery using the ADNEX model to differentiate between benign, borderline, early and advanced stage invasive, and secondary metastatic tumours: prospective multicentre diagnostic study.BMJ. 2014 Oct 15;349:g5920. doi: 10.1136/bmj.g5920. BMJ. 2014. PMID: 25320247 Free PMC article.
-
[Ovarian tumor markers of presumed benign ovarian tumors].J Gynecol Obstet Biol Reprod (Paris). 2013 Dec;42(8):752-9. doi: 10.1016/j.jgyn.2013.09.030. Epub 2013 Nov 7. J Gynecol Obstet Biol Reprod (Paris). 2013. PMID: 24210243 Review. French.
Cited by
-
A comparison of modeling approaches for static and dynamic prediction of central line-associated bloodstream infections using electronic health records (part 2): random forest models.Diagn Progn Res. 2025 Jul 21;9(1):21. doi: 10.1186/s41512-025-00194-8. Diagn Progn Res. 2025. PMID: 40691852 Free PMC article.
-
Validation of machine learning-based models to predict and explain the risk of ovarian cancer: a multicentric study on BRCA-mutated patients undergoing risk-reducing salpingo-oophorectomy.Front Oncol. 2025 Apr 15;15:1574037. doi: 10.3389/fonc.2025.1574037. eCollection 2025. Front Oncol. 2025. PMID: 40303993 Free PMC article.
-
A Review on Biomarker-Enhanced Machine Learning for Early Diagnosis and Outcome Prediction in Ovarian Cancer Management.Cancer Med. 2025 Sep;14(17):e71224. doi: 10.1002/cam4.71224. Cancer Med. 2025. PMID: 40927964 Free PMC article. Review.
-
Understanding overfitting in random forest for probability estimation: a visualization and simulation study.Diagn Progn Res. 2024 Sep 27;8(1):14. doi: 10.1186/s41512-024-00177-1. Diagn Progn Res. 2024. PMID: 39334348 Free PMC article.
References
-
- Steyerberg EW. Clinical prediction models: a practical approach to development, validation, and updating. 2. Cham: Springer; 2019.
Publication types
MeSH terms
Substances
LinkOut - more resources
Full Text Sources
Medical
Research Materials
Miscellaneous
