. 2023 Nov 24;21(1):447.
doi: 10.1186/s12951-023-02222-5.

Plasma exosomes improve peripheral neuropathy via miR-20b-3p/Stat3 in type I diabetic rats

Affiliations

Plasma exosomes improve peripheral neuropathy via miR-20b-3p/Stat3 in type I diabetic rats

Jiayang Li et al. J Nanobiotechnology. .

Abstract

Background: Diabetic peripheral neuropathy (DPN) is one of the most common complications of diabetes and the main cause of non-traumatic amputation, with no ideal treatment. Multiple cell-derived exosomes have been reported to improve the progression of DPN. Blood therapy is thought to have a powerful repairing effect. However, whether it could also improve DPN remains unclear.

Results: In this study, we found that microRNA (miRNA) expression in plasma-derived exosomes of healthy rats (hplasma-exos) was significantly different from that of age-matched DPN rats. By injection of hplasma-exos into DPN rats, the mechanical sensitivity of DPN rats was decreased, the thermal sensitivity and motor ability were increased, and the nerve conduction speed was accelerated. Histological analysis showed myelin regeneration of the sciatic nerve, increased intraepidermal nerve fibers, distal local blood perfusion, and enhanced neuromuscular junction and muscle spindle innervation after hplasma-exos administration. Compared with plasma exosomes in DPN, miR-20b-3p was specifically enriched in exosomes of healthy plasma and was found to be re-upregulated in the sciatic nerve of DPN rats after hplasma-exos treatment. Moreover, miR-20b-3p agomir improved DPN symptoms to a level similar to hplasma-exos, both of which also alleviated autophagy impairment induced by high glucose in Schwann cells. Mechanistic studies found that miR-20b-3p targeted Stat3 and consequently reduced the amount of p-Stat3, which then negatively regulated autophagy processes and contributed to DPN improvement.

Conclusions: This study demonstrated that miRNA of plasma exosomes was different between DPN and age-matched healthy rats. MiR-20b-3p was enriched in hplasma-exos, and both of them could alleviated DPN symptoms. MiR-20b-3p regulated autophagy of Schwann cells in pathological states by targeting Stat3 and thereby inhibited the progression of DPN.

Keywords: Autophagy; Diabetic peripheral neuropathy; Plasma exosomes; miRNAs.


Conflict of interest statement

The authors declare no competing interests.

Figures
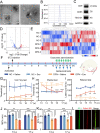
Fig. 1
Fig. 1
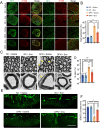
Healthy plasma-derived exosomes improve nerve function in DPN. A Representative TEM image of healthy plasma-derived exosomes and local magnification image, scale bar = 100/50 nm. Squares, images enlarged in right panel. B NTA and Western blot (C) were used to characterize the extracted exosomes. D Volcanic map and heatmap (E) of miRNA sequencing from plasma-exosomes in healthy and age-matched DPN rats. F A schematic showing the process of hplasma-exos injection. GI The threshold of Von Frey test, plantar test and rotarod test in normal and age-matched DPN rats receiving saline or hplasma-exos treatment, n = 5. J, K Changes of MCV and SCV before and after treatment of saline or hplasma-exos, n = 3, 6. L The red labeled exosomes are internalized by the green labeled sciatic nerve, scale bar = 500 μm. Data are presented as the mean ± SD. (*p < 0.05, **p < 0.01, ***p < 0.001, ****p < 0.0001)
Fig. 2
Fig. 2
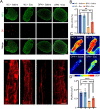
Healthy plasma-derived exosomes reduce sciatic nerve injury in DPN. A Representative immunofluorescent staining images of sciatic nerve axons (green) and myelin (red) in different groups, scale bar = 200/50 µm. Squares, images enlarged in right panel. B Statistical histogram of the proportion of demyelinating axons in different groups, n = 3. C The ultrastructure of sciatic nerves was observed by TEM in different groups of rats, scale bar = 5/2 µm. The yellow arrows point to the site of abnormal demyelination. D Quantitative of G-ratio in different groups, n = 10. E Representative images showing PGP9.5 positive intraepidermal nerve fibers in the posterior plantar skin of different groups of rats, scale bar = 100 μm. F The IENFD analysis is shown in F, n = 5. Data are presented as the mean ± SEM. (*p < 0.05, **p < 0.01, ***p < 0.001, ****p < 0.0001)
Fig. 3
Fig. 3
Plasma-exos improves blood flow on the foot and sciatic nerve surface of DPN rats. A Representative images of blood vessels of sciatic nerve labeled by Dil (red) and Anti-NF-L (green). Transverse section, scale bar = 200 μm and longitudinal section, scale bar = 1000 μm. B Statistical analysis of Dil (red) fluorescence area ratio in transverse section, n = 3. C Representative images of plantar laser blood imaging in different groups of rats. D The statistical analysis of plantar blood perfusion per unit area is shown in D, n = 8. Data are presented as the mean ± SEM. (*p < 0.05, **p < 0.01, ***p < 0.001, ****p < 0.0001)
Fig. 4
Fig. 4
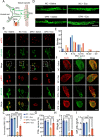
Plasma-exos augments the motor and sensory innervation of the targets. A A schematic of NMJ and muscle spindle. B Representative images of NMJ, labeled with 555-a-BTX (red) and NF-L + Syn (green) in different groups, bar = 100/50 µm. Squares, images enlarged as shown below. C Statistical analysis of the proportion of innervated NMJ (partial denervation and total denervation are excluded), n = 6. D Representative images of annulospiral endings of muscle spindles in different groups, bar = 200 μm. E Number of muscle spindles in different IRD distribution intervals. F Representative images of different groups of neurons labeled with NeuN (red) and retrograde tracer FITC-CTB (green), bar = 400 μm. G Statistical analysis of the proportion of FITC-CTB positive cells, n = 3. H Statistical analysis of wet weight of gastrocnemius muscle in each group, n = 3. I Changes of miR-20b-3p expression in sciatic nerve of rats in each group (G), n = 4. Data are presented as the mean ± SEM. (*p < 0.05, **p < 0.01, ***p < 0.001, ****p < 0.0001)
Fig. 5
Fig. 5
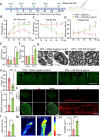
MiR-20b-3p agomir improve nerve damage induced by high glucose. A A schematic showing the process of miR-20b-3p agomir administration. BD Changes in Von Frey test, plantar test and rotarod test after the treatment of DPN rats with miR-20b-3p stable N.C. or miR-20b-3p agomir, n = 5. E, F Changes of MCV and SCV after miR-20b-3p agomir treatment, n = 3, 6. G The ultrastructure of sciatic nerves was observed by TEM in different groups of rats, scale bar = 5 μm/2µm. The new myelin sheath is marked with *. H Histogram represents the quantitative data of the G-ratio under various conditions, n = 10. I Representative images showing PGP9.5 positive intraepidermal nerve fibers in the posterior plantar skin of different groups of rats, scale bar = 100 μm. J Statistical analysis of IENFD is shown in J, n = 5. K Representative images of Dil perfusion in different groups of transverse and longitudinal section. Transverse section, scale bar = 200 μm and longitudinal section, scale bar = 1000 μm. L Statistical analysis of Dil (red) fluorescence area ratio in transverse section, n = 3. M Representative images of plantar blood flow imaging in different groups of rats. N Statistical analysis of plantar blood perfusion per unit area is shown in N, n = 5. BD Data are presented as the mean ± SD, others are presented as the mean ± SEM. (*p < 0.05, **p < 0.01, ***p < 0.001, ****p < 0.0001)
Fig. 6
Fig. 6
MiR-20b-3p agomir augments the motor and sensory innervation of the targets. A Representative images of NMJs labeled with 555-a-BTX (red) and NF-L + Syn (green) in different groups, scale bar = 100/50 µm. Squares, images enlarged in right panel. B Statistical analysis of the proportion of innervated NMJs (partial denervation and total denervation are excluded), n = 6. C Representative images of annulospiral endings of muscle spindles in different groups, scale bar = 200 μm. D Number of muscle spindles in different IRD distribution intervals. E Representative images of different groups of neurons labeled with NeuN (red) and retrograde tracer by CTB (green), scale bar = 500 μm. F Statistical analysis of the proportion of CTB positive cells, n = 4. G Statistical analysis of wet weight of gastrocnemius muscle in each group, n = 5. H Red fluorescently labeled agomir was found in the NF-L-labeled sciatic nerve. Data are presented as the mean ± SEM. (*p < 0.05, **p < 0.01, ***p < 0.001, ****p < 0.0001)
Fig. 7
Fig. 7
Plasma-exos improves RSC96 autophagy under high glucose stimulation. A Bubble map for KEGG analysis of miR-20b-3p. B Chordal graph of GO enrichment analysis of target genes of miR-20b-3p in autophagy related pathways. (GO:0006914 autophagy, GO:0061919 process utilizing autophagic mechanism, GO:0010506 regulation of autophagy, GO:0061912 selective autophagy, GO:0010508 positive regulation of autophagy, GO:0010507 negative regulation of autophagy, GO:0000422 autophagy of mitochondrion). C Venn diagram of the 115 matched targets between the diabetes, autopaghy and peripheral nerve targets. D Grey strips by western blot of the expression of Stat3, pStat3, Atg10, LC3 II/I at different groups in RSC96 in vitro after stimulation with hplasma-exos. EH Quantification of the related expression of Stat3 (E), pStat3 (F), Atg10 (G) and LC3 II/I (H) in RSC96 after stimulation with PBS or hplasma-exos, n = 3. I TEM images of autophagy organelles in RSC96 cells with different stimuli, bar = 2 μm. Yellow arrows, autophagy organelles. J Statistical analysis of the number of autophagy organelles in indicated groups, n = 8–10. K Grey strips by western blot of the expression of Stat3, pStat3, Atg10, LC3 II/I at different groups in RSC96 in vitro. LO Statistical results of the expression of Stat3 (L), pStat3 (M), Atg10 (N) and LC3 II/I (O) at different groups in RSC96 after different stimuli, n = 3–4. HG high glucose environment, LG low glucose environment. Data are presented as the mean ± SEM. (*p < 0.05, **p < 0.01, ***p < 0.001, ****p < 0.0001)
Fig. 8
Fig. 8
MiR-20b-3p down-regulates the expression of Stat3 and promotes autophagy in Schwann cells. A TEM images of autophagy organelles in RSC96 cells with different stimuli, bar = 2 μm. Yellow arrows, autophagy organelles. B Statistical analysis of the number of autophagy organelles in indicated groups, n = 8–12. C Grey strips by western blot of the expression of Stat3, pStat3, Atg10, LC3 II/I at different groups in RSC96 in vitro. DG Statistical results of the expression of Stat3 (D), pStat3 (E), Atg10 (F) and LC3 II/I (G) at different groups in RSC96 after different stimuli, n = 3. H TEM images of autophagy organelles in RSC96 cells with different stimuli, bar = 2 μm. Yellow arrows, autophagy organelles. I Statistical analysis of the number of autophagy organelles in indicated groups, n = 8–12. J Complementary sequences between miR-20b-3p and the 3′-untranslated region (UTR) of wild type or mutant type of Stat3 were obtained. K Target relationship between miR-20b-3p and Stat3 was assessed by dual luciferase reporter gene assay. LP Quantitative analysis and statistical results of the expression of Stat3, pStat3, Atg10, LC3 II/I at different groups in vivo by Western blot, n = 3. HG high glucose environment, LG low glucose environment. Data are presented as the mean ± SEM. (*p < 0.05, **p < 0.01, ***p < 0.001, ****p < 0.0001)

Similar articles

Cited by

References

    1. Saeedi P, Petersohn I, Salpea P, Malanda B, Karuranga S, Unwin N, et al. Global and regional diabetes prevalence estimates for 2019 and projections for 2030 and 2045: results from the International Diabetes Federation Diabetes Atlas, 9(th) edition. Diabetes Res Clin Pract. 2019;157:107843. doi: 10.1016/j.diabres.2019.107843. - DOI - PubMed
    1. Faselis C, Katsimardou A, Imprialos K, Deligkaris P, Kallistratos M, Dimitriadis K. Microvascular complications of type 2 diabetes mellitus. Curr Vasc Pharmacol. 2020;18(2):117–124. doi: 10.2174/1570161117666190502103733. - DOI - PubMed
    1. Yu Y. Gold standard for diagnosis of DPN. Front Endocrinol. 2021;12:719356. doi: 10.3389/fendo.2021.719356. - DOI - PMC - PubMed
    1. Muramatsu K. Diabetes mellitus-related dysfunction of the motor system. Int J Mol Sci. 2020;21(20):7485. doi: 10.3390/ijms21207485. - DOI - PMC - PubMed
    1. Yang K, Wang Y, Li YW, Chen YG, Xing N, Lin HB, et al. Progress in the treatment of diabetic peripheral neuropathy. Biomed Pharmacother. 2022;148:112717. doi: 10.1016/j.biopha.2022.112717. - DOI - PubMed

MeSH terms