

Changes in the small noncoding RNA transcriptome in osteosarcoma cells
- PMID: 38001513
- PMCID: PMC10675919
- DOI: 10.1186/s13018-023-04362-8
Changes in the small noncoding RNA transcriptome in osteosarcoma cells
Abstract
Background: Osteosarcoma has the highest incidence among bone malignant tumors and mainly occurs in adolescents and the elderly, but the pathological mechanism is still unclear, which makes early diagnosis and treatment very difficult. Bone marrow mesenchymal stem cells (BMSCs) are considered to be one of the sources of osteosarcoma cells. Therefore, a full understanding of the gene expression differences between BMSCs and osteosarcoma cells is very important to explore the pathogenesis of osteosarcoma and facilitate the early diagnosis and treatment of osteosarcoma. Small noncoding RNAs (sncRNAs) are a class of RNAs that do not encode proteins but directly play biological functions at the RNA level. SncRNAs mainly include Piwi-interacting RNAs (piRNAs), small nucleolar RNAs (snoRNAs), small nuclear RNAs (snRNAs), repeat RNAs and microRNAs (miRNAs).
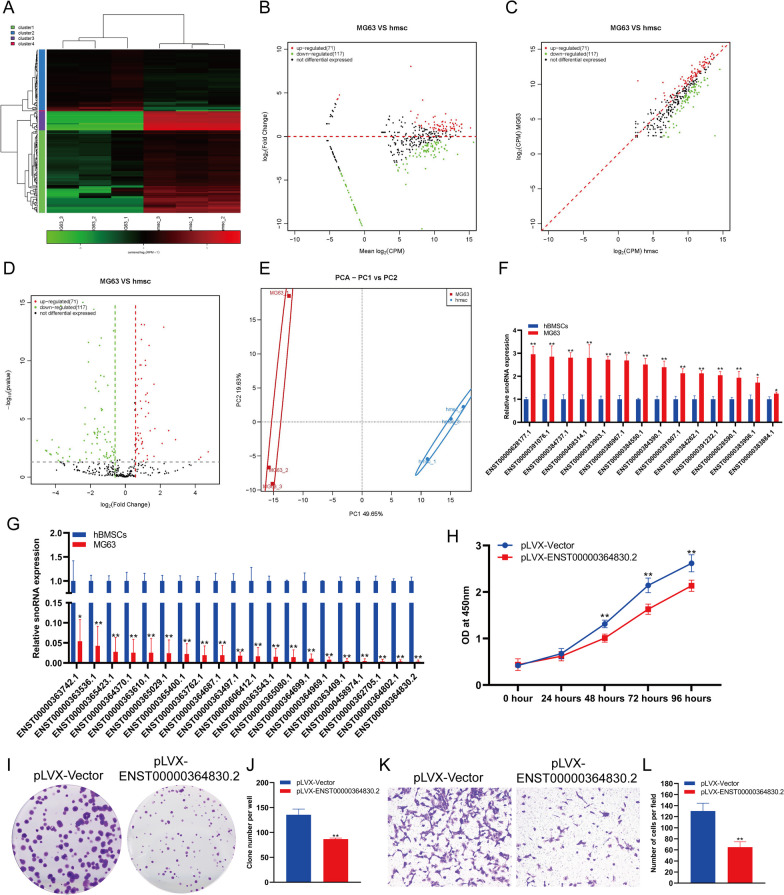
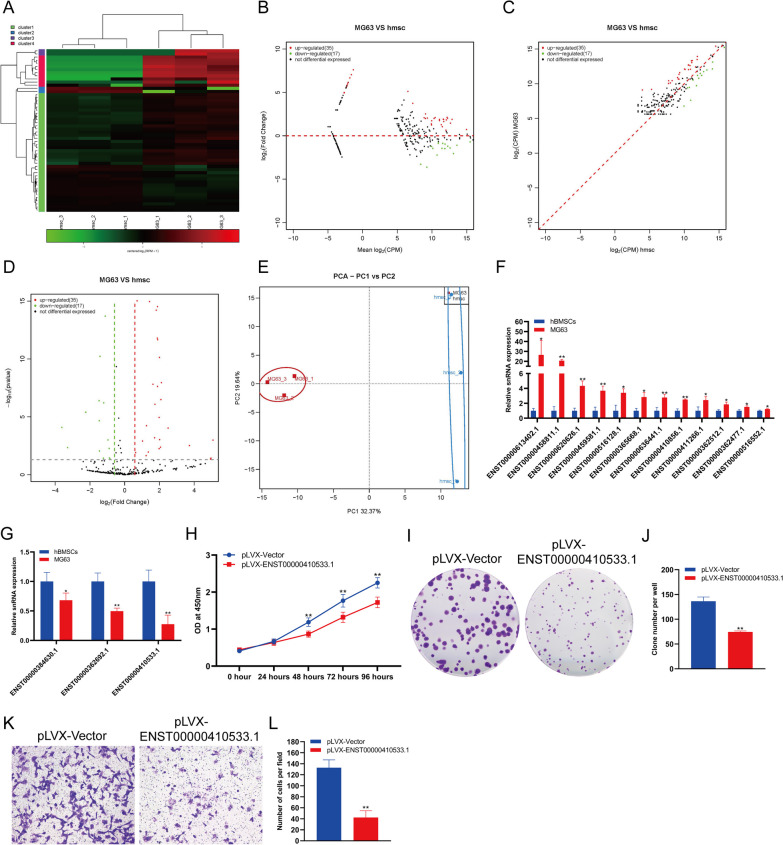
Methods: In this study, we compared the expression of sncRNAs in BMSCs and osteosarcoma cells by high-throughput sequencing and qPCR and looked for differentially expressed sncRNAs. CCK-8, clone formation and transwell assay were used to detect the effect of sncRNA in MG63 cells.
Results: We found that 66 piRNAs were significantly upregulated and 70 piRNAs were significantly downregulated in MG63 cells. As for snoRNAs, 71 snoRNAs were significantly upregulated and 117 snoRNAs were significantly downregulated in MG63 cells. As for snRNAs, 35 snRNAs were significantly upregulated and 17 snRNAs were significantly downregulated in MG63 cells. As for repeat RNAs, 6 repeat RNAs were significantly upregulated and 7 repeat RNAs were significantly downregulated in MG63 cells. As for miRNAs, 326 miRNAs were significantly upregulated and 281 miRNAs were significantly downregulated in MG63 cells. Overexpression of piRNA DQ596225, snoRNA ENST00000364830.2, snRNA ENST00000410533.1 and miRNA hsa-miR-369-5p inhibited the proliferation and migration of MG63 cells.
Conclusions: Our results provide a theoretical basis for the pathogenesis, early diagnosis and treatment of osteosarcoma.
Keywords: Osteosarcoma; Repeat RNA; miRNA; piRNA; snRNA; snoRNA.
© 2023. The Author(s).
Conflict of interest statement
The author (s) declare no potential competing interests with respect to the research, authorship, and/or publication of this article.
Figures


Similar articles
-
Changes in the Small Noncoding RNAome During M1 and M2 Macrophage Polarization.Front Immunol. 2022 May 10;13:799733. doi: 10.3389/fimmu.2022.799733. eCollection 2022. Front Immunol. 2022. PMID: 35619693 Free PMC article.
-
Changes in Small Noncoding RNA Expression during Chondrocyte Senescence.Cartilage. 2022 Jul-Sep;13(3):19476035221118165. doi: 10.1177/19476035221118165. Cartilage. 2022. PMID: 35993268 Free PMC article.
-
Ox-LDL induced profound changes of small non-coding RNA in rat endothelial cells.Front Cardiovasc Med. 2023 Feb 7;10:1060719. doi: 10.3389/fcvm.2023.1060719. eCollection 2023. Front Cardiovasc Med. 2023. PMID: 36824457 Free PMC article.
-
The significance of small noncoding RNAs in the pathogenesis of cardiovascular diseases.Genes Dis. 2024 May 30;12(4):101342. doi: 10.1016/j.gendis.2024.101342. eCollection 2025 Jul. Genes Dis. 2024. PMID: 40247912 Free PMC article. Review.
-
Disorders and roles of tsRNA, snoRNA, snRNA and piRNA in cancer.J Med Genet. 2022 Jul;59(7):623-631. doi: 10.1136/jmedgenet-2021-108327. Epub 2022 Feb 10. J Med Genet. 2022. PMID: 35145038 Review.
Cited by
-
Role of non-coding RNA in exosomes for the diagnosis and treatment of osteosarcoma.Front Oncol. 2024 Oct 24;14:1469833. doi: 10.3389/fonc.2024.1469833. eCollection 2024. Front Oncol. 2024. PMID: 39512768 Free PMC article. Review.
References
-
- Friedenstein AJ, Chailakhyan RK, Latsinik NV, Panasyuk AF, Keiliss-Borok IV. Stromal cells responsible for transferring the microenvironment of the hemopoietic tissues. Cloning in vitro and retransplantation in vivo. Transplantation. 1974;17(4):331–340. doi: 10.1097/00007890-197404000-00001. - DOI - PubMed
-
- Hung SC, Deng WP, Yang WK, Liu RS, Lee CC, Su TC, Lin RJ, Yang DM, Chang CW, Chen WH, Wei HJ, Gelovani JG. Mesenchymal stem cell targeting of microscopic tumors and tumor stroma development monitored by noninvasive in vivo positron emission tomography imaging. Clin Cancer Res. 2005;11(21):7749–7756. doi: 10.1158/1078-0432.CCR-05-0876. - DOI - PubMed
Publication types
MeSH terms
Substances
Grants and funding
LinkOut - more resources
Full Text Sources
Research Materials
